This pipeline computes the correlation between significant copy number variation (cnv focal) genes and selected clinical features.
Testing the association between subtypes identified by 98 different clustering approaches and 5 clinical features across 447 patients, 156 significant findings detected with Q value < 0.25.
-
2 subtypes identified in current cancer cohort by 'Amp Peak 1(1p35.2) mutation analysis'. These subtypes correlate to 'AGE' and 'HISTOLOGICAL.TYPE'.
-
2 subtypes identified in current cancer cohort by 'Amp Peak 2(1p34.2) mutation analysis'. These subtypes correlate to 'AGE' and 'HISTOLOGICAL.TYPE'.
-
2 subtypes identified in current cancer cohort by 'Amp Peak 3(1p22.3) mutation analysis'. These subtypes correlate to 'AGE'.
-
2 subtypes identified in current cancer cohort by 'Amp Peak 4(1q21.3) mutation analysis'. These subtypes correlate to 'AGE'.
-
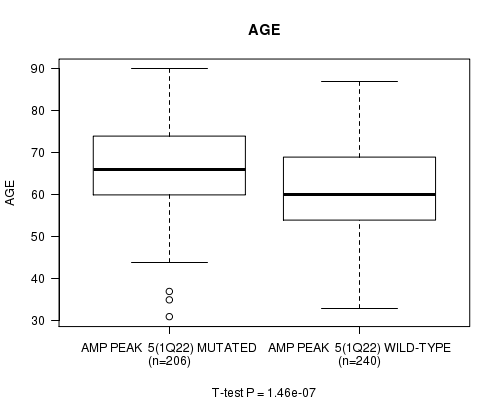
2 subtypes identified in current cancer cohort by 'Amp Peak 5(1q22) mutation analysis'. These subtypes correlate to 'AGE' and 'HISTOLOGICAL.TYPE'.
-
2 subtypes identified in current cancer cohort by 'Amp Peak 6(1q42.3) mutation analysis'. These subtypes do not correlate to any clinical features.
-
2 subtypes identified in current cancer cohort by 'Amp Peak 7(2p23.2) mutation analysis'. These subtypes correlate to 'HISTOLOGICAL.TYPE'.
-
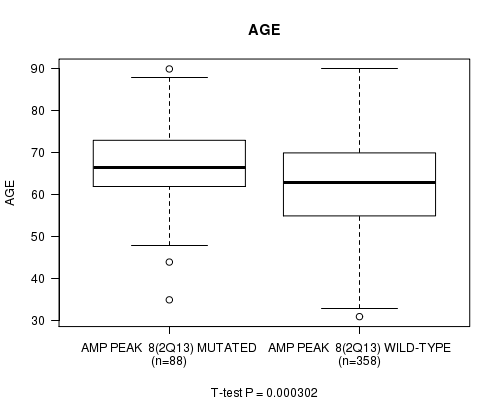
2 subtypes identified in current cancer cohort by 'Amp Peak 8(2q13) mutation analysis'. These subtypes correlate to 'AGE' and 'HISTOLOGICAL.TYPE'.
-
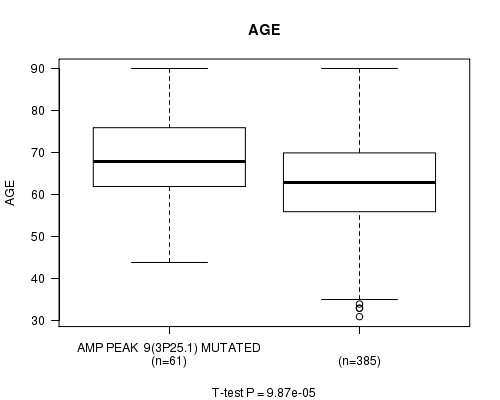
2 subtypes identified in current cancer cohort by 'Amp Peak 9(3p25.1) mutation analysis'. These subtypes correlate to 'AGE' and 'HISTOLOGICAL.TYPE'.
-
2 subtypes identified in current cancer cohort by 'Amp Peak 10(3p14.1) mutation analysis'. These subtypes correlate to 'HISTOLOGICAL.TYPE'.
-
2 subtypes identified in current cancer cohort by 'Amp Peak 11(3q26.2) mutation analysis'. These subtypes correlate to 'AGE' and 'HISTOLOGICAL.TYPE'.
-
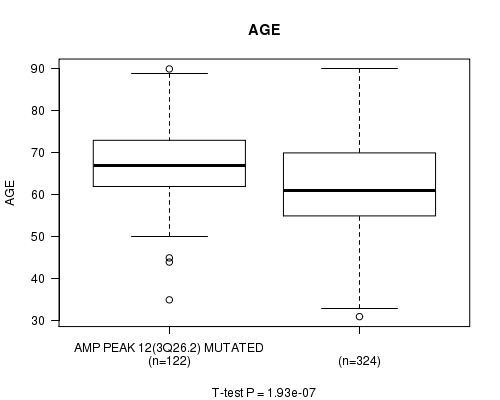
2 subtypes identified in current cancer cohort by 'Amp Peak 12(3q26.2) mutation analysis'. These subtypes correlate to 'AGE' and 'HISTOLOGICAL.TYPE'.
-
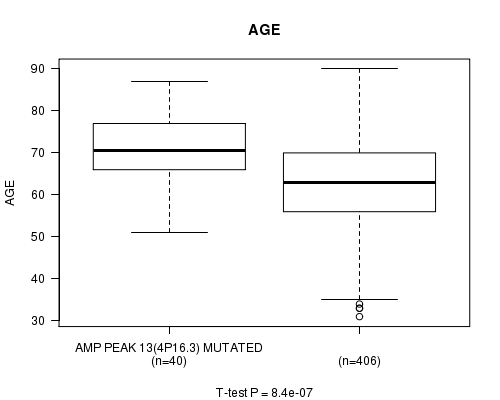
2 subtypes identified in current cancer cohort by 'Amp Peak 13(4p16.3) mutation analysis'. These subtypes correlate to 'AGE' and 'HISTOLOGICAL.TYPE'.
-
2 subtypes identified in current cancer cohort by 'Amp Peak 14(5p15.33) mutation analysis'. These subtypes correlate to 'HISTOLOGICAL.TYPE'.
-
2 subtypes identified in current cancer cohort by 'Amp Peak 15(5q35.3) mutation analysis'. These subtypes correlate to 'AGE' and 'HISTOLOGICAL.TYPE'.
-
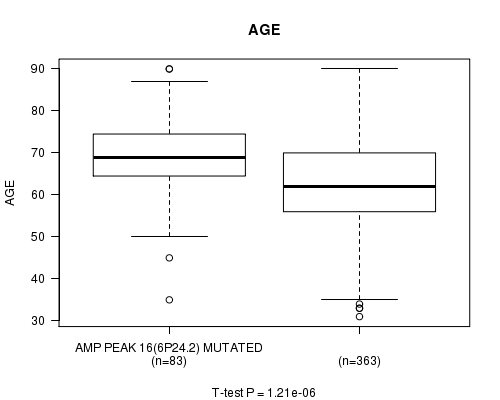
2 subtypes identified in current cancer cohort by 'Amp Peak 16(6p24.2) mutation analysis'. These subtypes correlate to 'AGE' and 'HISTOLOGICAL.TYPE'.
-
2 subtypes identified in current cancer cohort by 'Amp Peak 17(6q25.1) mutation analysis'. These subtypes correlate to 'HISTOLOGICAL.TYPE'.
-
2 subtypes identified in current cancer cohort by 'Amp Peak 18(7q22.1) mutation analysis'. These subtypes correlate to 'Time to Death'.
-
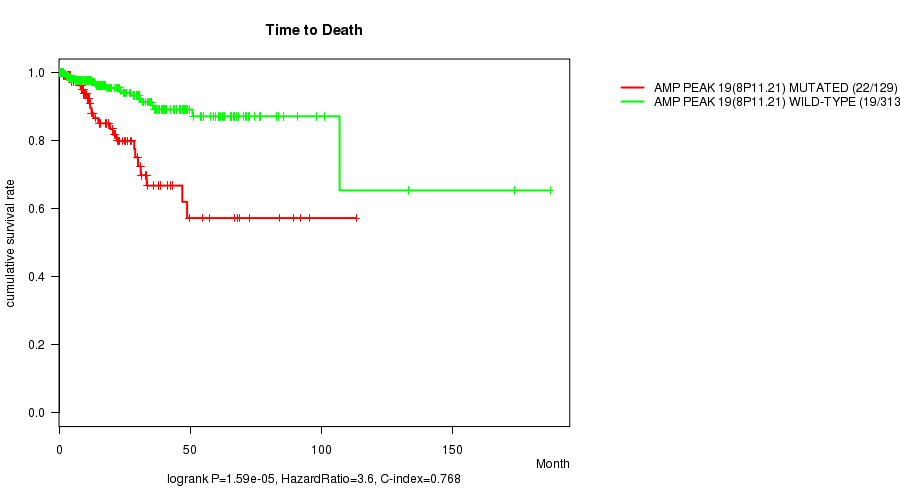
2 subtypes identified in current cancer cohort by 'Amp Peak 19(8p11.21) mutation analysis'. These subtypes correlate to 'Time to Death' and 'HISTOLOGICAL.TYPE'.
-
2 subtypes identified in current cancer cohort by 'Amp Peak 20(8q24.21) mutation analysis'. These subtypes correlate to 'HISTOLOGICAL.TYPE'.
-
2 subtypes identified in current cancer cohort by 'Amp Peak 21(8q24.21) mutation analysis'. These subtypes correlate to 'HISTOLOGICAL.TYPE' and 'COMPLETENESS.OF.RESECTION'.
-
2 subtypes identified in current cancer cohort by 'Amp Peak 22(9p24.2) mutation analysis'. These subtypes correlate to 'HISTOLOGICAL.TYPE'.
-
2 subtypes identified in current cancer cohort by 'Amp Peak 23(9q34.3) mutation analysis'. These subtypes correlate to 'AGE' and 'HISTOLOGICAL.TYPE'.
-
2 subtypes identified in current cancer cohort by 'Amp Peak 24(10q22.2) mutation analysis'. These subtypes do not correlate to any clinical features.
-
2 subtypes identified in current cancer cohort by 'Amp Peak 25(11p11.2) mutation analysis'. These subtypes correlate to 'AGE' and 'HISTOLOGICAL.TYPE'.
-
2 subtypes identified in current cancer cohort by 'Amp Peak 26(11q13.2) mutation analysis'. These subtypes correlate to 'HISTOLOGICAL.TYPE'.
-
2 subtypes identified in current cancer cohort by 'Amp Peak 27(12p12.1) mutation analysis'. These subtypes correlate to 'HISTOLOGICAL.TYPE'.
-
2 subtypes identified in current cancer cohort by 'Amp Peak 28(12q13.11) mutation analysis'. These subtypes correlate to 'HISTOLOGICAL.TYPE'.
-
2 subtypes identified in current cancer cohort by 'Amp Peak 29(12q13.2) mutation analysis'. These subtypes correlate to 'HISTOLOGICAL.TYPE'.
-
2 subtypes identified in current cancer cohort by 'Amp Peak 30(13q34) mutation analysis'. These subtypes correlate to 'AGE' and 'HISTOLOGICAL.TYPE'.
-
2 subtypes identified in current cancer cohort by 'Amp Peak 31(14q24.3) mutation analysis'. These subtypes correlate to 'AGE' and 'HISTOLOGICAL.TYPE'.
-
2 subtypes identified in current cancer cohort by 'Amp Peak 32(14q32.33) mutation analysis'. These subtypes correlate to 'AGE' and 'HISTOLOGICAL.TYPE'.
-
2 subtypes identified in current cancer cohort by 'Amp Peak 33(16p11.2) mutation analysis'. These subtypes correlate to 'AGE' and 'HISTOLOGICAL.TYPE'.
-
2 subtypes identified in current cancer cohort by 'Amp Peak 34(17q11.2) mutation analysis'. These subtypes correlate to 'AGE', 'HISTOLOGICAL.TYPE', and 'COMPLETENESS.OF.RESECTION'.
-
2 subtypes identified in current cancer cohort by 'Amp Peak 35(17q12) mutation analysis'. These subtypes correlate to 'AGE' and 'HISTOLOGICAL.TYPE'.
-
2 subtypes identified in current cancer cohort by 'Amp Peak 36(17q25.1) mutation analysis'. These subtypes correlate to 'AGE' and 'HISTOLOGICAL.TYPE'.
-
2 subtypes identified in current cancer cohort by 'Amp Peak 37(18p11.31) mutation analysis'. These subtypes correlate to 'AGE' and 'HISTOLOGICAL.TYPE'.
-
2 subtypes identified in current cancer cohort by 'Amp Peak 38(18q11.2) mutation analysis'. These subtypes correlate to 'HISTOLOGICAL.TYPE'.
-
2 subtypes identified in current cancer cohort by 'Amp Peak 39(19p13.2) mutation analysis'. These subtypes correlate to 'AGE' and 'HISTOLOGICAL.TYPE'.
-
2 subtypes identified in current cancer cohort by 'Amp Peak 40(19p13.11) mutation analysis'. These subtypes correlate to 'AGE' and 'HISTOLOGICAL.TYPE'.
-
2 subtypes identified in current cancer cohort by 'Amp Peak 41(19q12) mutation analysis'. These subtypes correlate to 'AGE' and 'HISTOLOGICAL.TYPE'.
-
2 subtypes identified in current cancer cohort by 'Amp Peak 42(20p13) mutation analysis'. These subtypes correlate to 'AGE' and 'HISTOLOGICAL.TYPE'.
-
2 subtypes identified in current cancer cohort by 'Amp Peak 43(20q11.21) mutation analysis'. These subtypes correlate to 'AGE' and 'HISTOLOGICAL.TYPE'.
-
2 subtypes identified in current cancer cohort by 'Amp Peak 44(20q13.12) mutation analysis'. These subtypes correlate to 'AGE' and 'HISTOLOGICAL.TYPE'.
-
2 subtypes identified in current cancer cohort by 'Amp Peak 45(20q13.33) mutation analysis'. These subtypes correlate to 'AGE' and 'HISTOLOGICAL.TYPE'.
-
2 subtypes identified in current cancer cohort by 'Amp Peak 46(22q12.2) mutation analysis'. These subtypes correlate to 'HISTOLOGICAL.TYPE' and 'COMPLETENESS.OF.RESECTION'.
-
2 subtypes identified in current cancer cohort by 'Amp Peak 47(Xp11.23) mutation analysis'. These subtypes do not correlate to any clinical features.
-
2 subtypes identified in current cancer cohort by 'Amp Peak 48(Xq28) mutation analysis'. These subtypes do not correlate to any clinical features.
-
2 subtypes identified in current cancer cohort by 'Del Peak 1(1p36.21) mutation analysis'. These subtypes correlate to 'AGE' and 'HISTOLOGICAL.TYPE'.
-
2 subtypes identified in current cancer cohort by 'Del Peak 2(1p36.11) mutation analysis'. These subtypes correlate to 'AGE' and 'HISTOLOGICAL.TYPE'.
-
2 subtypes identified in current cancer cohort by 'Del Peak 3(1q43) mutation analysis'. These subtypes do not correlate to any clinical features.
-
2 subtypes identified in current cancer cohort by 'Del Peak 4(2p25.3) mutation analysis'. These subtypes do not correlate to any clinical features.
-
2 subtypes identified in current cancer cohort by 'Del Peak 5(2q22.1) mutation analysis'. These subtypes correlate to 'Time to Death' and 'HISTOLOGICAL.TYPE'.
-
2 subtypes identified in current cancer cohort by 'Del Peak 6(2q37.3) mutation analysis'. These subtypes do not correlate to any clinical features.
-
2 subtypes identified in current cancer cohort by 'Del Peak 7(3p14.2) mutation analysis'. These subtypes correlate to 'AGE' and 'HISTOLOGICAL.TYPE'.
-
2 subtypes identified in current cancer cohort by 'Del Peak 8(3q13.31) mutation analysis'. These subtypes correlate to 'HISTOLOGICAL.TYPE'.
-
2 subtypes identified in current cancer cohort by 'Del Peak 9(4p16.3) mutation analysis'. These subtypes correlate to 'AGE' and 'HISTOLOGICAL.TYPE'.
-
2 subtypes identified in current cancer cohort by 'Del Peak 10(4p15.31) mutation analysis'. These subtypes correlate to 'AGE' and 'HISTOLOGICAL.TYPE'.
-
2 subtypes identified in current cancer cohort by 'Del Peak 11(4q22.1) mutation analysis'. These subtypes correlate to 'AGE' and 'HISTOLOGICAL.TYPE'.
-
2 subtypes identified in current cancer cohort by 'Del Peak 12(4q34.3) mutation analysis'. These subtypes correlate to 'AGE' and 'HISTOLOGICAL.TYPE'.
-
2 subtypes identified in current cancer cohort by 'Del Peak 13(5q11.2) mutation analysis'. These subtypes correlate to 'AGE' and 'HISTOLOGICAL.TYPE'.
-
2 subtypes identified in current cancer cohort by 'Del Peak 14(6q26) mutation analysis'. These subtypes correlate to 'HISTOLOGICAL.TYPE'.
-
2 subtypes identified in current cancer cohort by 'Del Peak 15(7p22.3) mutation analysis'. These subtypes correlate to 'AGE' and 'HISTOLOGICAL.TYPE'.
-
2 subtypes identified in current cancer cohort by 'Del Peak 16(7q11.22) mutation analysis'. These subtypes correlate to 'AGE' and 'HISTOLOGICAL.TYPE'.
-
2 subtypes identified in current cancer cohort by 'Del Peak 17(7q31.1) mutation analysis'. These subtypes correlate to 'AGE' and 'HISTOLOGICAL.TYPE'.
-
2 subtypes identified in current cancer cohort by 'Del Peak 18(7q36.3) mutation analysis'. These subtypes correlate to 'AGE' and 'HISTOLOGICAL.TYPE'.
-
2 subtypes identified in current cancer cohort by 'Del Peak 19(8p23.2) mutation analysis'. These subtypes correlate to 'HISTOLOGICAL.TYPE'.
-
2 subtypes identified in current cancer cohort by 'Del Peak 20(9p23) mutation analysis'. These subtypes correlate to 'HISTOLOGICAL.TYPE'.
-
2 subtypes identified in current cancer cohort by 'Del Peak 21(9q34.11) mutation analysis'. These subtypes correlate to 'AGE' and 'HISTOLOGICAL.TYPE'.
-
2 subtypes identified in current cancer cohort by 'Del Peak 22(10q23.31) mutation analysis'. These subtypes correlate to 'HISTOLOGICAL.TYPE'.
-
2 subtypes identified in current cancer cohort by 'Del Peak 23(11p15.5) mutation analysis'. These subtypes correlate to 'AGE' and 'HISTOLOGICAL.TYPE'.
-
2 subtypes identified in current cancer cohort by 'Del Peak 24(11q14.1) mutation analysis'. These subtypes correlate to 'AGE' and 'HISTOLOGICAL.TYPE'.
-
2 subtypes identified in current cancer cohort by 'Del Peak 25(11q25) mutation analysis'. These subtypes correlate to 'AGE' and 'HISTOLOGICAL.TYPE'.
-
2 subtypes identified in current cancer cohort by 'Del Peak 26(12q23.1) mutation analysis'. These subtypes correlate to 'HISTOLOGICAL.TYPE'.
-
2 subtypes identified in current cancer cohort by 'Del Peak 27(12q24.33) mutation analysis'. These subtypes correlate to 'AGE' and 'HISTOLOGICAL.TYPE'.
-
2 subtypes identified in current cancer cohort by 'Del Peak 28(13q11) mutation analysis'. These subtypes correlate to 'HISTOLOGICAL.TYPE'.
-
2 subtypes identified in current cancer cohort by 'Del Peak 29(13q14.2) mutation analysis'. These subtypes correlate to 'AGE' and 'HISTOLOGICAL.TYPE'.
-
2 subtypes identified in current cancer cohort by 'Del Peak 30(14q13.1) mutation analysis'. These subtypes correlate to 'AGE' and 'HISTOLOGICAL.TYPE'.
-
2 subtypes identified in current cancer cohort by 'Del Peak 31(15q15.1) mutation analysis'. These subtypes correlate to 'AGE' and 'HISTOLOGICAL.TYPE'.
-
2 subtypes identified in current cancer cohort by 'Del Peak 32(15q23) mutation analysis'. These subtypes correlate to 'AGE' and 'HISTOLOGICAL.TYPE'.
-
2 subtypes identified in current cancer cohort by 'Del Peak 33(16p13.3) mutation analysis'. These subtypes correlate to 'AGE' and 'HISTOLOGICAL.TYPE'.
-
2 subtypes identified in current cancer cohort by 'Del Peak 34(16q21) mutation analysis'. These subtypes correlate to 'AGE' and 'HISTOLOGICAL.TYPE'.
-
2 subtypes identified in current cancer cohort by 'Del Peak 35(16q23.1) mutation analysis'. These subtypes correlate to 'AGE' and 'HISTOLOGICAL.TYPE'.
-
2 subtypes identified in current cancer cohort by 'Del Peak 36(17p13.3) mutation analysis'. These subtypes correlate to 'AGE' and 'HISTOLOGICAL.TYPE'.
-
2 subtypes identified in current cancer cohort by 'Del Peak 37(17p12) mutation analysis'. These subtypes correlate to 'AGE' and 'HISTOLOGICAL.TYPE'.
-
2 subtypes identified in current cancer cohort by 'Del Peak 38(17p11.2) mutation analysis'. These subtypes correlate to 'AGE' and 'HISTOLOGICAL.TYPE'.
-
2 subtypes identified in current cancer cohort by 'Del Peak 39(17q11.2) mutation analysis'. These subtypes correlate to 'AGE' and 'HISTOLOGICAL.TYPE'.
-
2 subtypes identified in current cancer cohort by 'Del Peak 40(17q21.2) mutation analysis'. These subtypes correlate to 'AGE' and 'HISTOLOGICAL.TYPE'.
-
2 subtypes identified in current cancer cohort by 'Del Peak 41(18q23) mutation analysis'. These subtypes correlate to 'HISTOLOGICAL.TYPE'.
-
2 subtypes identified in current cancer cohort by 'Del Peak 42(19p13.3) mutation analysis'. These subtypes correlate to 'AGE' and 'HISTOLOGICAL.TYPE'.
-
2 subtypes identified in current cancer cohort by 'Del Peak 43(19p12) mutation analysis'. These subtypes correlate to 'HISTOLOGICAL.TYPE'.
-
2 subtypes identified in current cancer cohort by 'Del Peak 44(19q13.43) mutation analysis'. These subtypes correlate to 'HISTOLOGICAL.TYPE'.
-
2 subtypes identified in current cancer cohort by 'Del Peak 45(20p12.1) mutation analysis'. These subtypes do not correlate to any clinical features.
-
2 subtypes identified in current cancer cohort by 'Del Peak 46(22q11.1) mutation analysis'. These subtypes correlate to 'AGE' and 'HISTOLOGICAL.TYPE'.
-
2 subtypes identified in current cancer cohort by 'Del Peak 47(22q12.1) mutation analysis'. These subtypes correlate to 'HISTOLOGICAL.TYPE'.
-
2 subtypes identified in current cancer cohort by 'Del Peak 48(22q13.31) mutation analysis'. These subtypes correlate to 'AGE' and 'HISTOLOGICAL.TYPE'.
-
2 subtypes identified in current cancer cohort by 'Del Peak 49(22q13.32) mutation analysis'. These subtypes correlate to 'AGE' and 'HISTOLOGICAL.TYPE'.
-
2 subtypes identified in current cancer cohort by 'Del Peak 50(Xp21.1) mutation analysis'. These subtypes correlate to 'AGE' and 'HISTOLOGICAL.TYPE'.
Table 1. Get Full Table Overview of the association between subtypes identified by 98 different clustering approaches and 5 clinical features. Shown in the table are P values (Q values). Thresholded by Q value < 0.25, 156 significant findings detected.
|
Clinical Features |
Time to Death |
AGE |
HISTOLOGICAL TYPE |
RADIATIONS RADIATION REGIMENINDICATION |
COMPLETENESS OF RESECTION |
| Statistical Tests | logrank test | t-test | Fisher's exact test | Fisher's exact test | Fisher's exact test |
| Amp Peak 1(1p35 2) |
0.945 (1.00) |
0.000295 (0.102) |
3.23e-11 (1.39e-08) |
1 (1.00) |
0.872 (1.00) |
| Amp Peak 2(1p34 2) |
0.648 (1.00) |
0.00012 (0.0427) |
6.05e-16 (2.78e-13) |
0.333 (1.00) |
0.145 (1.00) |
| Amp Peak 3(1p22 3) |
0.732 (1.00) |
0.000314 (0.108) |
0.00305 (0.965) |
0.889 (1.00) |
0.502 (1.00) |
| Amp Peak 4(1q21 3) |
0.173 (1.00) |
3.09e-06 (0.00119) |
0.00268 (0.852) |
0.603 (1.00) |
0.437 (1.00) |
| Amp Peak 5(1q22) |
0.0389 (1.00) |
1.46e-07 (5.85e-05) |
1.6e-05 (0.00605) |
0.534 (1.00) |
0.256 (1.00) |
| Amp Peak 6(1q42 3) |
0.267 (1.00) |
0.000978 (0.325) |
0.121 (1.00) |
0.6 (1.00) |
0.44 (1.00) |
| Amp Peak 7(2p23 2) |
0.00563 (1.00) |
0.00406 (1.00) |
6.3e-12 (2.76e-09) |
0.0433 (1.00) |
0.887 (1.00) |
| Amp Peak 8(2q13) |
0.0153 (1.00) |
0.000302 (0.104) |
2.52e-15 (1.15e-12) |
0.796 (1.00) |
0.246 (1.00) |
| Amp Peak 9(3p25 1) |
0.403 (1.00) |
9.87e-05 (0.0352) |
3.04e-09 (1.27e-06) |
0.134 (1.00) |
0.766 (1.00) |
| Amp Peak 10(3p14 1) |
0.00402 (1.00) |
0.00956 (1.00) |
0.000352 (0.12) |
0.0439 (1.00) |
0.377 (1.00) |
| Amp Peak 11(3q26 2) |
0.151 (1.00) |
1.78e-09 (7.51e-07) |
1.21e-22 (5.83e-20) |
0.171 (1.00) |
0.182 (1.00) |
| Amp Peak 12(3q26 2) |
0.0874 (1.00) |
1.93e-07 (7.73e-05) |
5.47e-23 (2.65e-20) |
0.246 (1.00) |
0.122 (1.00) |
| Amp Peak 13(4p16 3) |
0.974 (1.00) |
8.4e-07 (0.000328) |
6.2e-13 (2.74e-10) |
0.718 (1.00) |
0.726 (1.00) |
| Amp Peak 14(5p15 33) |
0.0477 (1.00) |
0.00587 (1.00) |
1.72e-15 (7.87e-13) |
0.658 (1.00) |
0.131 (1.00) |
| Amp Peak 15(5q35 3) |
0.105 (1.00) |
0.00053 (0.179) |
1.16e-07 (4.69e-05) |
0.463 (1.00) |
0.544 (1.00) |
| Amp Peak 16(6p24 2) |
0.824 (1.00) |
1.21e-06 (0.000469) |
4.15e-17 (1.94e-14) |
0.233 (1.00) |
0.822 (1.00) |
| Amp Peak 17(6q25 1) |
0.824 (1.00) |
0.0101 (1.00) |
3.39e-05 (0.0124) |
0.658 (1.00) |
0.253 (1.00) |
| Amp Peak 18(7q22 1) |
0.00054 (0.182) |
0.0487 (1.00) |
0.00497 (1.00) |
0.117 (1.00) |
0.512 (1.00) |
| Amp Peak 19(8p11 21) |
1.59e-05 (0.00599) |
0.402 (1.00) |
1.36e-07 (5.49e-05) |
0.0417 (1.00) |
0.00477 (1.00) |
| Amp Peak 20(8q24 21) |
0.00129 (0.424) |
0.548 (1.00) |
1.36e-12 (5.98e-10) |
0.042 (1.00) |
0.0262 (1.00) |
| Amp Peak 21(8q24 21) |
0.00672 (1.00) |
0.238 (1.00) |
1.52e-13 (6.77e-11) |
0.0142 (1.00) |
0.000433 (0.147) |
| Amp Peak 22(9p24 2) |
0.748 (1.00) |
0.00576 (1.00) |
1.1e-07 (4.45e-05) |
0.182 (1.00) |
0.436 (1.00) |
| Amp Peak 23(9q34 3) |
0.0777 (1.00) |
0.000554 (0.186) |
2.26e-07 (9.04e-05) |
0.839 (1.00) |
0.327 (1.00) |
| Amp Peak 24(10q22 2) |
0.185 (1.00) |
0.458 (1.00) |
0.045 (1.00) |
0.727 (1.00) |
0.39 (1.00) |
| Amp Peak 25(11p11 2) |
0.0353 (1.00) |
0.000241 (0.0839) |
5.11e-08 (2.1e-05) |
0.851 (1.00) |
0.609 (1.00) |
| Amp Peak 26(11q13 2) |
0.0908 (1.00) |
0.00119 (0.392) |
2.53e-07 (0.000101) |
1 (1.00) |
0.235 (1.00) |
| Amp Peak 27(12p12 1) |
0.736 (1.00) |
0.51 (1.00) |
2.77e-07 (0.00011) |
0.664 (1.00) |
0.322 (1.00) |
| Amp Peak 28(12q13 11) |
0.821 (1.00) |
0.832 (1.00) |
5.46e-07 (0.000215) |
0.192 (1.00) |
0.252 (1.00) |
| Amp Peak 29(12q13 2) |
0.887 (1.00) |
0.076 (1.00) |
7.52e-07 (0.000295) |
0.0524 (1.00) |
0.066 (1.00) |
| Amp Peak 30(13q34) |
0.671 (1.00) |
8.08e-07 (0.000316) |
9.08e-11 (3.9e-08) |
1 (1.00) |
0.125 (1.00) |
| Amp Peak 31(14q24 3) |
0.495 (1.00) |
2.03e-05 (0.0076) |
1.62e-11 (7.01e-09) |
0.182 (1.00) |
0.774 (1.00) |
| Amp Peak 32(14q32 33) |
0.175 (1.00) |
0.000239 (0.0838) |
1.45e-09 (6.13e-07) |
0.162 (1.00) |
0.109 (1.00) |
| Amp Peak 33(16p11 2) |
0.0868 (1.00) |
0.00031 (0.107) |
8.05e-14 (3.61e-11) |
1 (1.00) |
0.0749 (1.00) |
| Amp Peak 34(17q11 2) |
0.0432 (1.00) |
0.000251 (0.0873) |
4.04e-16 (1.86e-13) |
0.747 (1.00) |
0.000336 (0.115) |
| Amp Peak 35(17q12) |
0.0605 (1.00) |
6.81e-05 (0.0246) |
1.86e-16 (8.63e-14) |
0.749 (1.00) |
0.0467 (1.00) |
| Amp Peak 36(17q25 1) |
0.0505 (1.00) |
2.97e-05 (0.0109) |
2.56e-15 (1.16e-12) |
1 (1.00) |
0.263 (1.00) |
| Amp Peak 37(18p11 31) |
0.494 (1.00) |
0.00028 (0.097) |
2.58e-18 (1.22e-15) |
0.0587 (1.00) |
0.00948 (1.00) |
| Amp Peak 38(18q11 2) |
0.151 (1.00) |
0.0105 (1.00) |
8.76e-13 (3.87e-10) |
0.52 (1.00) |
0.076 (1.00) |
| Amp Peak 39(19p13 2) |
0.65 (1.00) |
4.89e-11 (2.1e-08) |
1.19e-17 (5.58e-15) |
0.252 (1.00) |
0.795 (1.00) |
| Amp Peak 40(19p13 11) |
0.594 (1.00) |
1.45e-10 (6.18e-08) |
1.86e-19 (8.8e-17) |
0.084 (1.00) |
0.306 (1.00) |
| Amp Peak 41(19q12) |
0.00175 (0.565) |
3.71e-10 (1.58e-07) |
1.93e-34 (9.43e-32) |
0.687 (1.00) |
0.283 (1.00) |
| Amp Peak 42(20p13) |
0.193 (1.00) |
5.29e-05 (0.0193) |
4.27e-12 (1.87e-09) |
0.24 (1.00) |
0.225 (1.00) |
| Amp Peak 43(20q11 21) |
0.0393 (1.00) |
3.4e-07 (0.000135) |
5.23e-24 (2.54e-21) |
0.0687 (1.00) |
0.0632 (1.00) |
| Amp Peak 44(20q13 12) |
0.305 (1.00) |
9.91e-08 (4.03e-05) |
1.1e-20 (5.25e-18) |
0.0166 (1.00) |
0.035 (1.00) |
| Amp Peak 45(20q13 33) |
0.334 (1.00) |
3.68e-07 (0.000145) |
1.61e-16 (7.48e-14) |
0.00554 (1.00) |
0.0264 (1.00) |
| Amp Peak 46(22q12 2) |
0.692 (1.00) |
0.00306 (0.968) |
5.75e-17 (2.67e-14) |
0.221 (1.00) |
0.000227 (0.0796) |
| Amp Peak 47(Xp11 23) |
0.464 (1.00) |
0.226 (1.00) |
0.0265 (1.00) |
0.048 (1.00) |
0.311 (1.00) |
| Amp Peak 48(Xq28) |
0.00822 (1.00) |
0.108 (1.00) |
0.00131 (0.428) |
1 (1.00) |
0.263 (1.00) |
| Del Peak 1(1p36 21) |
0.45 (1.00) |
3.28e-05 (0.0121) |
1.05e-08 (4.36e-06) |
0.529 (1.00) |
0.367 (1.00) |
| Del Peak 2(1p36 11) |
0.356 (1.00) |
3.68e-05 (0.0135) |
1.23e-11 (5.37e-09) |
0.76 (1.00) |
0.00882 (1.00) |
| Del Peak 3(1q43) |
0.0272 (1.00) |
0.0221 (1.00) |
0.252 (1.00) |
0.109 (1.00) |
0.0337 (1.00) |
| Del Peak 4(2p25 3) |
0.0264 (1.00) |
0.123 (1.00) |
0.00405 (1.00) |
0.0993 (1.00) |
0.191 (1.00) |
| Del Peak 5(2q22 1) |
9.57e-09 (4e-06) |
0.00825 (1.00) |
2.41e-05 (0.00895) |
0.0181 (1.00) |
0.0019 (0.613) |
| Del Peak 6(2q37 3) |
0.582 (1.00) |
0.000788 (0.262) |
0.0103 (1.00) |
0.366 (1.00) |
0.022 (1.00) |
| Del Peak 7(3p14 2) |
0.81 (1.00) |
7.54e-05 (0.0272) |
6.23e-15 (2.83e-12) |
0.439 (1.00) |
0.446 (1.00) |
| Del Peak 8(3q13 31) |
0.931 (1.00) |
0.00342 (1.00) |
6.98e-06 (0.00268) |
0.632 (1.00) |
0.924 (1.00) |
| Del Peak 9(4p16 3) |
0.142 (1.00) |
0.000139 (0.049) |
2.78e-13 (1.24e-10) |
0.47 (1.00) |
0.597 (1.00) |
| Del Peak 10(4p15 31) |
0.166 (1.00) |
8.27e-05 (0.0297) |
7.92e-12 (3.46e-09) |
0.11 (1.00) |
0.161 (1.00) |
| Del Peak 11(4q22 1) |
0.00691 (1.00) |
1.58e-05 (0.00597) |
1.33e-22 (6.43e-20) |
0.218 (1.00) |
0.0485 (1.00) |
| Del Peak 12(4q34 3) |
0.0279 (1.00) |
1.14e-05 (0.00433) |
2.59e-22 (1.24e-19) |
0.521 (1.00) |
0.0704 (1.00) |
| Del Peak 13(5q11 2) |
0.0763 (1.00) |
6.49e-05 (0.0236) |
1.47e-21 (7.04e-19) |
0.588 (1.00) |
0.261 (1.00) |
| Del Peak 14(6q26) |
0.268 (1.00) |
0.00493 (1.00) |
1.05e-08 (4.36e-06) |
0.848 (1.00) |
0.802 (1.00) |
| Del Peak 15(7p22 3) |
0.0149 (1.00) |
2.51e-05 (0.0093) |
1.1e-13 (4.9e-11) |
0.541 (1.00) |
0.069 (1.00) |
| Del Peak 16(7q11 22) |
0.557 (1.00) |
2.09e-05 (0.00778) |
9.54e-08 (3.9e-05) |
0.689 (1.00) |
0.426 (1.00) |
| Del Peak 17(7q31 1) |
0.705 (1.00) |
3.68e-06 (0.00142) |
4.18e-16 (1.92e-13) |
0.588 (1.00) |
0.478 (1.00) |
| Del Peak 18(7q36 3) |
0.569 (1.00) |
4.14e-08 (1.71e-05) |
2.21e-16 (1.02e-13) |
0.87 (1.00) |
0.235 (1.00) |
| Del Peak 19(8p23 2) |
0.355 (1.00) |
0.00242 (0.773) |
1.08e-23 (5.26e-21) |
0.687 (1.00) |
0.0146 (1.00) |
| Del Peak 20(9p23) |
0.409 (1.00) |
0.00078 (0.26) |
9.61e-11 (4.11e-08) |
0.333 (1.00) |
0.309 (1.00) |
| Del Peak 21(9q34 11) |
0.319 (1.00) |
7.77e-10 (3.3e-07) |
6.56e-18 (3.09e-15) |
0.325 (1.00) |
0.306 (1.00) |
| Del Peak 22(10q23 31) |
0.131 (1.00) |
0.00786 (1.00) |
1.9e-05 (0.00712) |
0.0779 (1.00) |
0.0761 (1.00) |
| Del Peak 23(11p15 5) |
0.0121 (1.00) |
3.06e-08 (1.26e-05) |
2.7e-21 (1.29e-18) |
0.102 (1.00) |
0.0212 (1.00) |
| Del Peak 24(11q14 1) |
0.0557 (1.00) |
2.66e-05 (0.00984) |
3.72e-14 (1.67e-11) |
0.52 (1.00) |
0.4 (1.00) |
| Del Peak 25(11q25) |
0.0038 (1.00) |
0.000158 (0.0558) |
6.29e-15 (2.85e-12) |
0.032 (1.00) |
0.175 (1.00) |
| Del Peak 26(12q23 1) |
0.0542 (1.00) |
0.00552 (1.00) |
4.05e-11 (1.75e-08) |
0.558 (1.00) |
0.0213 (1.00) |
| Del Peak 27(12q24 33) |
0.11 (1.00) |
0.000116 (0.0413) |
4.36e-13 (1.94e-10) |
0.0843 (1.00) |
0.0323 (1.00) |
| Del Peak 28(13q11) |
0.0112 (1.00) |
0.00108 (0.356) |
7.87e-10 (3.33e-07) |
0.311 (1.00) |
0.0483 (1.00) |
| Del Peak 29(13q14 2) |
0.0408 (1.00) |
0.000327 (0.112) |
5.28e-05 (0.0193) |
0.159 (1.00) |
0.203 (1.00) |
| Del Peak 30(14q13 1) |
0.00136 (0.444) |
0.000739 (0.247) |
9.68e-12 (4.22e-09) |
0.53 (1.00) |
0.899 (1.00) |
| Del Peak 31(15q15 1) |
0.0386 (1.00) |
1.44e-08 (5.97e-06) |
6.83e-21 (3.26e-18) |
0.0658 (1.00) |
0.0207 (1.00) |
| Del Peak 32(15q23) |
0.0577 (1.00) |
1.79e-05 (0.00674) |
7.29e-20 (3.46e-17) |
0.233 (1.00) |
0.433 (1.00) |
| Del Peak 33(16p13 3) |
0.0339 (1.00) |
9.74e-08 (3.97e-05) |
1.02e-15 (4.69e-13) |
0.55 (1.00) |
0.0126 (1.00) |
| Del Peak 34(16q21) |
0.052 (1.00) |
7.63e-09 (3.2e-06) |
1.85e-21 (8.88e-19) |
0.29 (1.00) |
0.122 (1.00) |
| Del Peak 35(16q23 1) |
0.0634 (1.00) |
5.24e-08 (2.15e-05) |
3.42e-25 (1.67e-22) |
0.423 (1.00) |
0.00562 (1.00) |
| Del Peak 36(17p13 3) |
0.116 (1.00) |
8.02e-05 (0.0289) |
4.59e-17 (2.14e-14) |
0.293 (1.00) |
0.223 (1.00) |
| Del Peak 37(17p12) |
0.0757 (1.00) |
1.56e-07 (6.24e-05) |
4.91e-24 (2.39e-21) |
0.531 (1.00) |
0.669 (1.00) |
| Del Peak 38(17p11 2) |
0.0439 (1.00) |
1.86e-06 (0.000721) |
2.42e-17 (1.14e-14) |
0.438 (1.00) |
0.778 (1.00) |
| Del Peak 39(17q11 2) |
0.616 (1.00) |
8.22e-06 (0.00315) |
1.73e-10 (7.36e-08) |
0.174 (1.00) |
0.219 (1.00) |
| Del Peak 40(17q21 2) |
0.145 (1.00) |
1.11e-05 (0.00425) |
4.62e-14 (2.07e-11) |
0.144 (1.00) |
0.113 (1.00) |
| Del Peak 41(18q23) |
0.0107 (1.00) |
0.00195 (0.624) |
1.3e-14 (5.88e-12) |
0.00743 (1.00) |
0.0107 (1.00) |
| Del Peak 42(19p13 3) |
0.0131 (1.00) |
1.81e-11 (7.83e-09) |
3.19e-46 (1.56e-43) |
0.345 (1.00) |
0.0041 (1.00) |
| Del Peak 43(19p12) |
0.109 (1.00) |
0.0703 (1.00) |
1.35e-07 (5.45e-05) |
0.268 (1.00) |
0.301 (1.00) |
| Del Peak 44(19q13 43) |
0.00165 (0.536) |
0.00213 (0.682) |
1.08e-14 (4.89e-12) |
1 (1.00) |
0.0438 (1.00) |
| Del Peak 45(20p12 1) |
0.0867 (1.00) |
0.0531 (1.00) |
0.00111 (0.367) |
0.823 (1.00) |
0.158 (1.00) |
| Del Peak 46(22q11 1) |
0.418 (1.00) |
9.75e-05 (0.0349) |
1.25e-05 (0.00473) |
0.0284 (1.00) |
0.787 (1.00) |
| Del Peak 47(22q12 1) |
0.197 (1.00) |
0.00171 (0.553) |
2.09e-06 (0.000808) |
0.117 (1.00) |
0.665 (1.00) |
| Del Peak 48(22q13 31) |
0.0141 (1.00) |
2.37e-08 (9.81e-06) |
4.51e-17 (2.11e-14) |
0.319 (1.00) |
0.811 (1.00) |
| Del Peak 49(22q13 32) |
0.0126 (1.00) |
5.33e-07 (0.00021) |
4.69e-18 (2.21e-15) |
0.0877 (1.00) |
0.609 (1.00) |
| Del Peak 50(Xp21 1) |
0.00348 (1.00) |
0.000158 (0.0558) |
1.32e-12 (5.83e-10) |
0.55 (1.00) |
0.106 (1.00) |
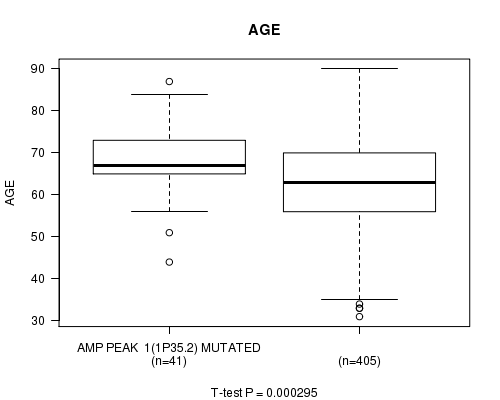
Table S1. Description of clustering approach #1: 'Amp Peak 1(1p35.2) mutation analysis'
| Cluster Labels | AMP PEAK 1(1P35.2) MUTATED | AMP PEAK 1(1P35.2) WILD-TYPE |
|---|---|---|
| Number of samples | 41 | 406 |
P value = 0.000295 (t-test), Q value = 0.1
Table S2. Clustering Approach #1: 'Amp Peak 1(1p35.2) mutation analysis' versus Clinical Feature #2: 'AGE'
| nPatients | Mean (Std.Dev) | |
|---|---|---|
| ALL | 446 | 63.6 (11.3) |
| AMP PEAK 1(1P35.2) MUTATED | 41 | 68.7 (8.7) |
| AMP PEAK 1(1P35.2) WILD-TYPE | 405 | 63.1 (11.4) |
Figure S1. Get High-res Image Clustering Approach #1: 'Amp Peak 1(1p35.2) mutation analysis' versus Clinical Feature #2: 'AGE'
P value = 3.23e-11 (Fisher's exact test), Q value = 1.4e-08
Table S3. Clustering Approach #1: 'Amp Peak 1(1p35.2) mutation analysis' versus Clinical Feature #3: 'HISTOLOGICAL.TYPE'
| nPatients | ENDOMETRIOID ENDOMETRIAL ADENOCARCINOMA | MIXED SEROUS AND ENDOMETRIOID | SEROUS ENDOMETRIAL ADENOCARCINOMA |
|---|---|---|---|
| ALL | 350 | 18 | 79 |
| AMP PEAK 1(1P35.2) MUTATED | 13 | 4 | 24 |
| AMP PEAK 1(1P35.2) WILD-TYPE | 337 | 14 | 55 |
Figure S2. Get High-res Image Clustering Approach #1: 'Amp Peak 1(1p35.2) mutation analysis' versus Clinical Feature #3: 'HISTOLOGICAL.TYPE'
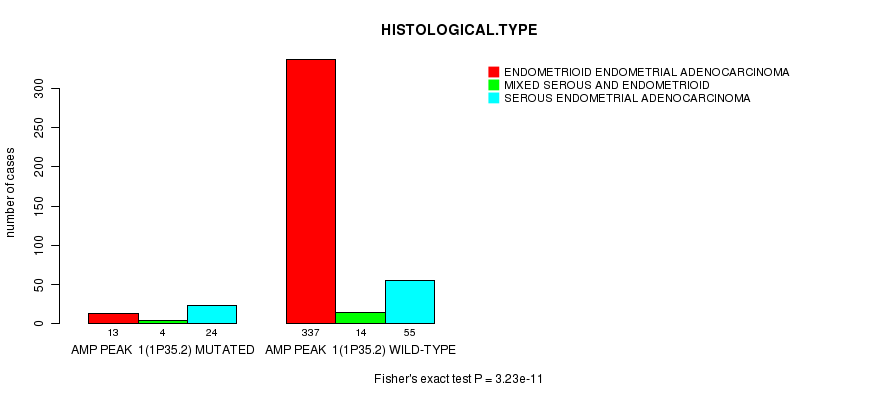
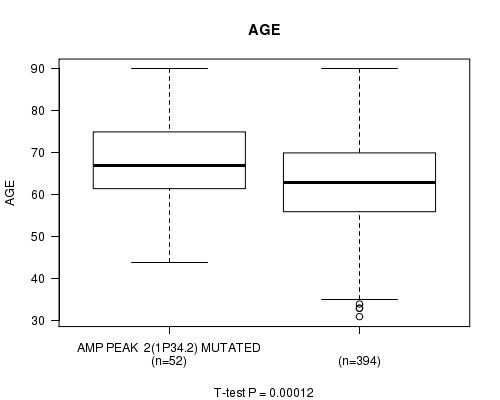
Table S4. Description of clustering approach #2: 'Amp Peak 2(1p34.2) mutation analysis'
| Cluster Labels | AMP PEAK 2(1P34.2) MUTATED | AMP PEAK 2(1P34.2) WILD-TYPE |
|---|---|---|
| Number of samples | 52 | 395 |
P value = 0.00012 (t-test), Q value = 0.043
Table S5. Clustering Approach #2: 'Amp Peak 2(1p34.2) mutation analysis' versus Clinical Feature #2: 'AGE'
| nPatients | Mean (Std.Dev) | |
|---|---|---|
| ALL | 446 | 63.6 (11.3) |
| AMP PEAK 2(1P34.2) MUTATED | 52 | 68.9 (9.8) |
| AMP PEAK 2(1P34.2) WILD-TYPE | 394 | 62.9 (11.3) |
Figure S3. Get High-res Image Clustering Approach #2: 'Amp Peak 2(1p34.2) mutation analysis' versus Clinical Feature #2: 'AGE'
P value = 6.05e-16 (Fisher's exact test), Q value = 2.8e-13
Table S6. Clustering Approach #2: 'Amp Peak 2(1p34.2) mutation analysis' versus Clinical Feature #3: 'HISTOLOGICAL.TYPE'
| nPatients | ENDOMETRIOID ENDOMETRIAL ADENOCARCINOMA | MIXED SEROUS AND ENDOMETRIOID | SEROUS ENDOMETRIAL ADENOCARCINOMA |
|---|---|---|---|
| ALL | 350 | 18 | 79 |
| AMP PEAK 2(1P34.2) MUTATED | 15 | 6 | 31 |
| AMP PEAK 2(1P34.2) WILD-TYPE | 335 | 12 | 48 |
Figure S4. Get High-res Image Clustering Approach #2: 'Amp Peak 2(1p34.2) mutation analysis' versus Clinical Feature #3: 'HISTOLOGICAL.TYPE'

Table S7. Description of clustering approach #3: 'Amp Peak 3(1p22.3) mutation analysis'
| Cluster Labels | AMP PEAK 3(1P22.3) MUTATED | AMP PEAK 3(1P22.3) WILD-TYPE |
|---|---|---|
| Number of samples | 74 | 373 |
P value = 0.000314 (t-test), Q value = 0.11
Table S8. Clustering Approach #3: 'Amp Peak 3(1p22.3) mutation analysis' versus Clinical Feature #2: 'AGE'
| nPatients | Mean (Std.Dev) | |
|---|---|---|
| ALL | 446 | 63.6 (11.3) |
| AMP PEAK 3(1P22.3) MUTATED | 74 | 67.6 (10.1) |
| AMP PEAK 3(1P22.3) WILD-TYPE | 372 | 62.8 (11.3) |
Figure S5. Get High-res Image Clustering Approach #3: 'Amp Peak 3(1p22.3) mutation analysis' versus Clinical Feature #2: 'AGE'

Table S9. Description of clustering approach #4: 'Amp Peak 4(1q21.3) mutation analysis'
| Cluster Labels | AMP PEAK 4(1Q21.3) MUTATED | AMP PEAK 4(1Q21.3) WILD-TYPE |
|---|---|---|
| Number of samples | 194 | 253 |
P value = 3.09e-06 (t-test), Q value = 0.0012
Table S10. Clustering Approach #4: 'Amp Peak 4(1q21.3) mutation analysis' versus Clinical Feature #2: 'AGE'
| nPatients | Mean (Std.Dev) | |
|---|---|---|
| ALL | 446 | 63.6 (11.3) |
| AMP PEAK 4(1Q21.3) MUTATED | 194 | 66.4 (10.5) |
| AMP PEAK 4(1Q21.3) WILD-TYPE | 252 | 61.4 (11.4) |
Figure S6. Get High-res Image Clustering Approach #4: 'Amp Peak 4(1q21.3) mutation analysis' versus Clinical Feature #2: 'AGE'
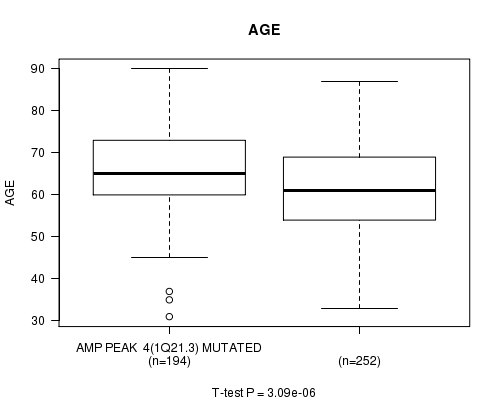
Table S11. Description of clustering approach #5: 'Amp Peak 5(1q22) mutation analysis'
| Cluster Labels | AMP PEAK 5(1Q22) MUTATED | AMP PEAK 5(1Q22) WILD-TYPE |
|---|---|---|
| Number of samples | 206 | 241 |
P value = 1.46e-07 (t-test), Q value = 5.9e-05
Table S12. Clustering Approach #5: 'Amp Peak 5(1q22) mutation analysis' versus Clinical Feature #2: 'AGE'
| nPatients | Mean (Std.Dev) | |
|---|---|---|
| ALL | 446 | 63.6 (11.3) |
| AMP PEAK 5(1Q22) MUTATED | 206 | 66.5 (10.5) |
| AMP PEAK 5(1Q22) WILD-TYPE | 240 | 61.0 (11.3) |
Figure S7. Get High-res Image Clustering Approach #5: 'Amp Peak 5(1q22) mutation analysis' versus Clinical Feature #2: 'AGE'
P value = 1.6e-05 (Fisher's exact test), Q value = 0.006
Table S13. Clustering Approach #5: 'Amp Peak 5(1q22) mutation analysis' versus Clinical Feature #3: 'HISTOLOGICAL.TYPE'
| nPatients | ENDOMETRIOID ENDOMETRIAL ADENOCARCINOMA | MIXED SEROUS AND ENDOMETRIOID | SEROUS ENDOMETRIAL ADENOCARCINOMA |
|---|---|---|---|
| ALL | 350 | 18 | 79 |
| AMP PEAK 5(1Q22) MUTATED | 143 | 8 | 55 |
| AMP PEAK 5(1Q22) WILD-TYPE | 207 | 10 | 24 |
Figure S8. Get High-res Image Clustering Approach #5: 'Amp Peak 5(1q22) mutation analysis' versus Clinical Feature #3: 'HISTOLOGICAL.TYPE'
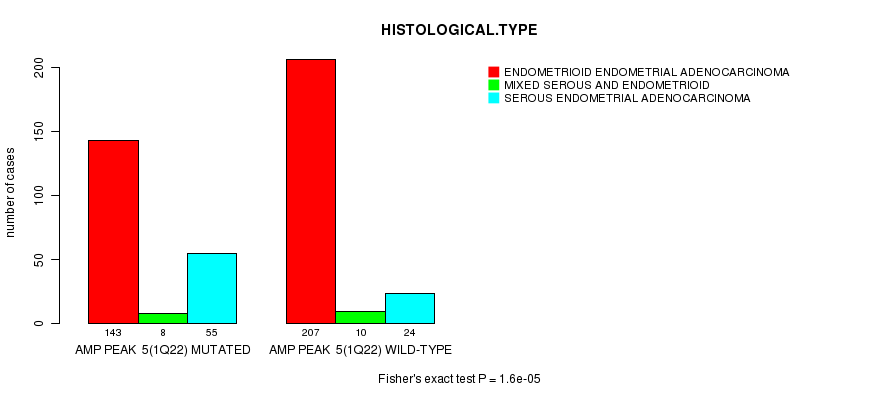
Table S14. Description of clustering approach #6: 'Amp Peak 6(1q42.3) mutation analysis'
| Cluster Labels | AMP PEAK 6(1Q42.3) MUTATED | AMP PEAK 6(1Q42.3) WILD-TYPE |
|---|---|---|
| Number of samples | 184 | 263 |
Table S15. Description of clustering approach #7: 'Amp Peak 7(2p23.2) mutation analysis'
| Cluster Labels | AMP PEAK 7(2P23.2) MUTATED | AMP PEAK 7(2P23.2) WILD-TYPE |
|---|---|---|
| Number of samples | 94 | 353 |
P value = 6.3e-12 (Fisher's exact test), Q value = 2.8e-09
Table S16. Clustering Approach #7: 'Amp Peak 7(2p23.2) mutation analysis' versus Clinical Feature #3: 'HISTOLOGICAL.TYPE'
| nPatients | ENDOMETRIOID ENDOMETRIAL ADENOCARCINOMA | MIXED SEROUS AND ENDOMETRIOID | SEROUS ENDOMETRIAL ADENOCARCINOMA |
|---|---|---|---|
| ALL | 350 | 18 | 79 |
| AMP PEAK 7(2P23.2) MUTATED | 47 | 7 | 40 |
| AMP PEAK 7(2P23.2) WILD-TYPE | 303 | 11 | 39 |
Figure S9. Get High-res Image Clustering Approach #7: 'Amp Peak 7(2p23.2) mutation analysis' versus Clinical Feature #3: 'HISTOLOGICAL.TYPE'
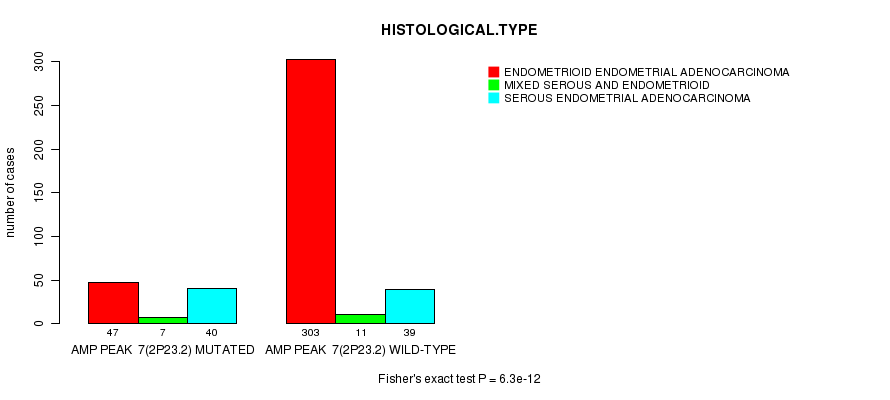
Table S17. Description of clustering approach #8: 'Amp Peak 8(2q13) mutation analysis'
| Cluster Labels | AMP PEAK 8(2Q13) MUTATED | AMP PEAK 8(2Q13) WILD-TYPE |
|---|---|---|
| Number of samples | 89 | 358 |
P value = 0.000302 (t-test), Q value = 0.1
Table S18. Clustering Approach #8: 'Amp Peak 8(2q13) mutation analysis' versus Clinical Feature #2: 'AGE'
| nPatients | Mean (Std.Dev) | |
|---|---|---|
| ALL | 446 | 63.6 (11.3) |
| AMP PEAK 8(2Q13) MUTATED | 88 | 67.0 (9.1) |
| AMP PEAK 8(2Q13) WILD-TYPE | 358 | 62.7 (11.6) |
Figure S10. Get High-res Image Clustering Approach #8: 'Amp Peak 8(2q13) mutation analysis' versus Clinical Feature #2: 'AGE'
P value = 2.52e-15 (Fisher's exact test), Q value = 1.1e-12
Table S19. Clustering Approach #8: 'Amp Peak 8(2q13) mutation analysis' versus Clinical Feature #3: 'HISTOLOGICAL.TYPE'
| nPatients | ENDOMETRIOID ENDOMETRIAL ADENOCARCINOMA | MIXED SEROUS AND ENDOMETRIOID | SEROUS ENDOMETRIAL ADENOCARCINOMA |
|---|---|---|---|
| ALL | 350 | 18 | 79 |
| AMP PEAK 8(2Q13) MUTATED | 41 | 4 | 44 |
| AMP PEAK 8(2Q13) WILD-TYPE | 309 | 14 | 35 |
Figure S11. Get High-res Image Clustering Approach #8: 'Amp Peak 8(2q13) mutation analysis' versus Clinical Feature #3: 'HISTOLOGICAL.TYPE'
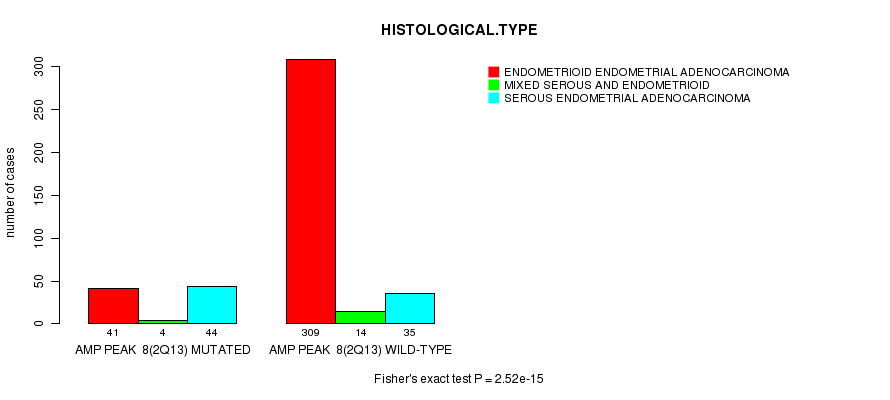
Table S20. Description of clustering approach #9: 'Amp Peak 9(3p25.1) mutation analysis'
| Cluster Labels | AMP PEAK 9(3P25.1) MUTATED | AMP PEAK 9(3P25.1) WILD-TYPE |
|---|---|---|
| Number of samples | 61 | 386 |
P value = 9.87e-05 (t-test), Q value = 0.035
Table S21. Clustering Approach #9: 'Amp Peak 9(3p25.1) mutation analysis' versus Clinical Feature #2: 'AGE'
| nPatients | Mean (Std.Dev) | |
|---|---|---|
| ALL | 446 | 63.6 (11.3) |
| AMP PEAK 9(3P25.1) MUTATED | 61 | 68.9 (10.9) |
| AMP PEAK 9(3P25.1) WILD-TYPE | 385 | 62.7 (11.1) |
Figure S12. Get High-res Image Clustering Approach #9: 'Amp Peak 9(3p25.1) mutation analysis' versus Clinical Feature #2: 'AGE'
P value = 3.04e-09 (Fisher's exact test), Q value = 1.3e-06
Table S22. Clustering Approach #9: 'Amp Peak 9(3p25.1) mutation analysis' versus Clinical Feature #3: 'HISTOLOGICAL.TYPE'
| nPatients | ENDOMETRIOID ENDOMETRIAL ADENOCARCINOMA | MIXED SEROUS AND ENDOMETRIOID | SEROUS ENDOMETRIAL ADENOCARCINOMA |
|---|---|---|---|
| ALL | 350 | 18 | 79 |
| AMP PEAK 9(3P25.1) MUTATED | 30 | 1 | 30 |
| AMP PEAK 9(3P25.1) WILD-TYPE | 320 | 17 | 49 |
Figure S13. Get High-res Image Clustering Approach #9: 'Amp Peak 9(3p25.1) mutation analysis' versus Clinical Feature #3: 'HISTOLOGICAL.TYPE'
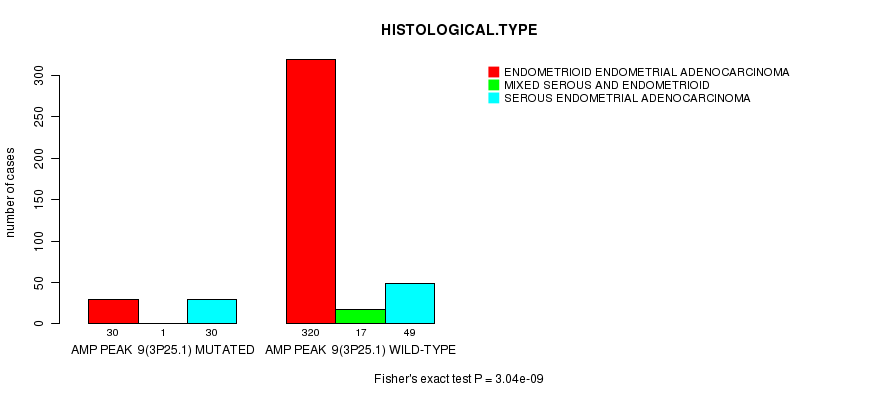
Table S23. Description of clustering approach #10: 'Amp Peak 10(3p14.1) mutation analysis'
| Cluster Labels | AMP PEAK 10(3P14.1) MUTATED | AMP PEAK 10(3P14.1) WILD-TYPE |
|---|---|---|
| Number of samples | 48 | 399 |
P value = 0.000352 (Fisher's exact test), Q value = 0.12
Table S24. Clustering Approach #10: 'Amp Peak 10(3p14.1) mutation analysis' versus Clinical Feature #3: 'HISTOLOGICAL.TYPE'
| nPatients | ENDOMETRIOID ENDOMETRIAL ADENOCARCINOMA | MIXED SEROUS AND ENDOMETRIOID | SEROUS ENDOMETRIAL ADENOCARCINOMA |
|---|---|---|---|
| ALL | 350 | 18 | 79 |
| AMP PEAK 10(3P14.1) MUTATED | 27 | 2 | 19 |
| AMP PEAK 10(3P14.1) WILD-TYPE | 323 | 16 | 60 |
Figure S14. Get High-res Image Clustering Approach #10: 'Amp Peak 10(3p14.1) mutation analysis' versus Clinical Feature #3: 'HISTOLOGICAL.TYPE'
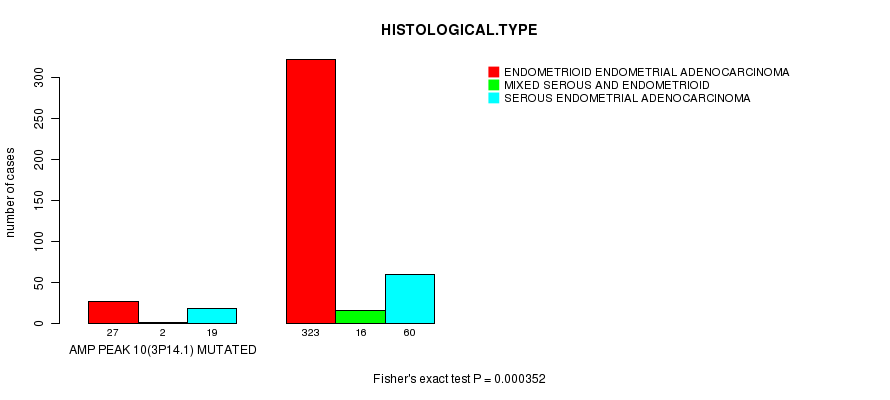
Table S25. Description of clustering approach #11: 'Amp Peak 11(3q26.2) mutation analysis'
| Cluster Labels | AMP PEAK 11(3Q26.2) MUTATED | AMP PEAK 11(3Q26.2) WILD-TYPE |
|---|---|---|
| Number of samples | 129 | 318 |
P value = 1.78e-09 (t-test), Q value = 7.5e-07
Table S26. Clustering Approach #11: 'Amp Peak 11(3q26.2) mutation analysis' versus Clinical Feature #2: 'AGE'
| nPatients | Mean (Std.Dev) | |
|---|---|---|
| ALL | 446 | 63.6 (11.3) |
| AMP PEAK 11(3Q26.2) MUTATED | 129 | 68.2 (9.5) |
| AMP PEAK 11(3Q26.2) WILD-TYPE | 317 | 61.7 (11.4) |
Figure S15. Get High-res Image Clustering Approach #11: 'Amp Peak 11(3q26.2) mutation analysis' versus Clinical Feature #2: 'AGE'
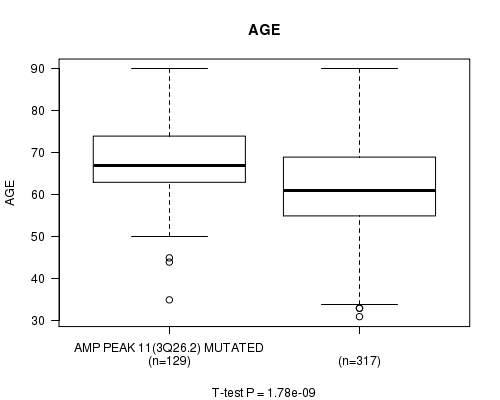
P value = 1.21e-22 (Fisher's exact test), Q value = 5.8e-20
Table S27. Clustering Approach #11: 'Amp Peak 11(3q26.2) mutation analysis' versus Clinical Feature #3: 'HISTOLOGICAL.TYPE'
| nPatients | ENDOMETRIOID ENDOMETRIAL ADENOCARCINOMA | MIXED SEROUS AND ENDOMETRIOID | SEROUS ENDOMETRIAL ADENOCARCINOMA |
|---|---|---|---|
| ALL | 350 | 18 | 79 |
| AMP PEAK 11(3Q26.2) MUTATED | 62 | 7 | 60 |
| AMP PEAK 11(3Q26.2) WILD-TYPE | 288 | 11 | 19 |
Figure S16. Get High-res Image Clustering Approach #11: 'Amp Peak 11(3q26.2) mutation analysis' versus Clinical Feature #3: 'HISTOLOGICAL.TYPE'
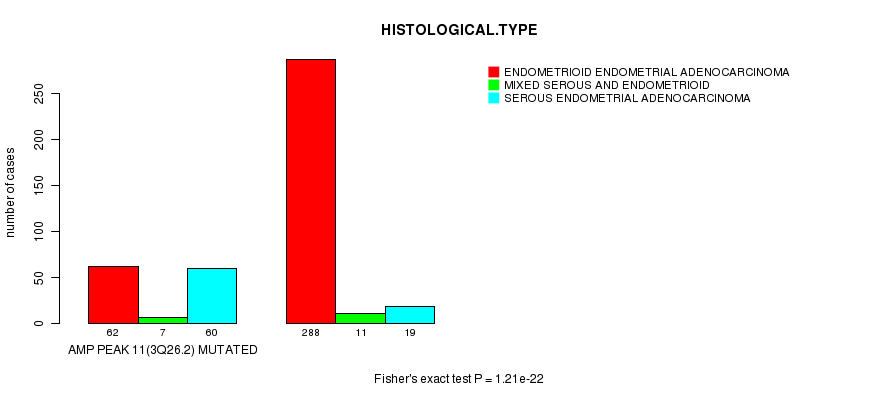
Table S28. Description of clustering approach #12: 'Amp Peak 12(3q26.2) mutation analysis'
| Cluster Labels | AMP PEAK 12(3Q26.2) MUTATED | AMP PEAK 12(3Q26.2) WILD-TYPE |
|---|---|---|
| Number of samples | 122 | 325 |
P value = 1.93e-07 (t-test), Q value = 7.7e-05
Table S29. Clustering Approach #12: 'Amp Peak 12(3q26.2) mutation analysis' versus Clinical Feature #2: 'AGE'
| nPatients | Mean (Std.Dev) | |
|---|---|---|
| ALL | 446 | 63.6 (11.3) |
| AMP PEAK 12(3Q26.2) MUTATED | 122 | 67.7 (9.5) |
| AMP PEAK 12(3Q26.2) WILD-TYPE | 324 | 62.0 (11.5) |
Figure S17. Get High-res Image Clustering Approach #12: 'Amp Peak 12(3q26.2) mutation analysis' versus Clinical Feature #2: 'AGE'
P value = 5.47e-23 (Fisher's exact test), Q value = 2.6e-20
Table S30. Clustering Approach #12: 'Amp Peak 12(3q26.2) mutation analysis' versus Clinical Feature #3: 'HISTOLOGICAL.TYPE'
| nPatients | ENDOMETRIOID ENDOMETRIAL ADENOCARCINOMA | MIXED SEROUS AND ENDOMETRIOID | SEROUS ENDOMETRIAL ADENOCARCINOMA |
|---|---|---|---|
| ALL | 350 | 18 | 79 |
| AMP PEAK 12(3Q26.2) MUTATED | 57 | 6 | 59 |
| AMP PEAK 12(3Q26.2) WILD-TYPE | 293 | 12 | 20 |
Figure S18. Get High-res Image Clustering Approach #12: 'Amp Peak 12(3q26.2) mutation analysis' versus Clinical Feature #3: 'HISTOLOGICAL.TYPE'

Table S31. Description of clustering approach #13: 'Amp Peak 13(4p16.3) mutation analysis'
| Cluster Labels | AMP PEAK 13(4P16.3) MUTATED | AMP PEAK 13(4P16.3) WILD-TYPE |
|---|---|---|
| Number of samples | 40 | 407 |
P value = 8.4e-07 (t-test), Q value = 0.00033
Table S32. Clustering Approach #13: 'Amp Peak 13(4p16.3) mutation analysis' versus Clinical Feature #2: 'AGE'
| nPatients | Mean (Std.Dev) | |
|---|---|---|
| ALL | 446 | 63.6 (11.3) |
| AMP PEAK 13(4P16.3) MUTATED | 40 | 70.9 (8.4) |
| AMP PEAK 13(4P16.3) WILD-TYPE | 406 | 62.9 (11.3) |
Figure S19. Get High-res Image Clustering Approach #13: 'Amp Peak 13(4p16.3) mutation analysis' versus Clinical Feature #2: 'AGE'
P value = 6.2e-13 (Fisher's exact test), Q value = 2.7e-10
Table S33. Clustering Approach #13: 'Amp Peak 13(4p16.3) mutation analysis' versus Clinical Feature #3: 'HISTOLOGICAL.TYPE'
| nPatients | ENDOMETRIOID ENDOMETRIAL ADENOCARCINOMA | MIXED SEROUS AND ENDOMETRIOID | SEROUS ENDOMETRIAL ADENOCARCINOMA |
|---|---|---|---|
| ALL | 350 | 18 | 79 |
| AMP PEAK 13(4P16.3) MUTATED | 12 | 1 | 27 |
| AMP PEAK 13(4P16.3) WILD-TYPE | 338 | 17 | 52 |
Figure S20. Get High-res Image Clustering Approach #13: 'Amp Peak 13(4p16.3) mutation analysis' versus Clinical Feature #3: 'HISTOLOGICAL.TYPE'

Table S34. Description of clustering approach #14: 'Amp Peak 14(5p15.33) mutation analysis'
| Cluster Labels | AMP PEAK 14(5P15.33) MUTATED | AMP PEAK 14(5P15.33) WILD-TYPE |
|---|---|---|
| Number of samples | 64 | 383 |
P value = 1.72e-15 (Fisher's exact test), Q value = 7.9e-13
Table S35. Clustering Approach #14: 'Amp Peak 14(5p15.33) mutation analysis' versus Clinical Feature #3: 'HISTOLOGICAL.TYPE'
| nPatients | ENDOMETRIOID ENDOMETRIAL ADENOCARCINOMA | MIXED SEROUS AND ENDOMETRIOID | SEROUS ENDOMETRIAL ADENOCARCINOMA |
|---|---|---|---|
| ALL | 350 | 18 | 79 |
| AMP PEAK 14(5P15.33) MUTATED | 24 | 3 | 37 |
| AMP PEAK 14(5P15.33) WILD-TYPE | 326 | 15 | 42 |
Figure S21. Get High-res Image Clustering Approach #14: 'Amp Peak 14(5p15.33) mutation analysis' versus Clinical Feature #3: 'HISTOLOGICAL.TYPE'
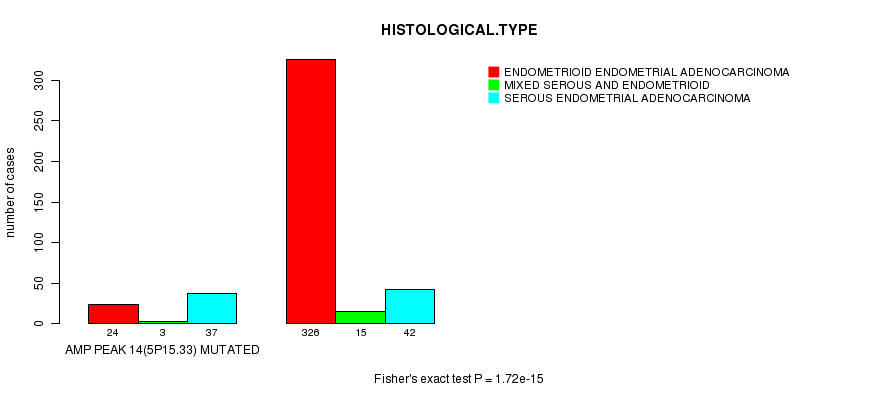
Table S36. Description of clustering approach #15: 'Amp Peak 15(5q35.3) mutation analysis'
| Cluster Labels | AMP PEAK 15(5Q35.3) MUTATED | AMP PEAK 15(5Q35.3) WILD-TYPE |
|---|---|---|
| Number of samples | 39 | 408 |
P value = 0.00053 (t-test), Q value = 0.18
Table S37. Clustering Approach #15: 'Amp Peak 15(5q35.3) mutation analysis' versus Clinical Feature #2: 'AGE'
| nPatients | Mean (Std.Dev) | |
|---|---|---|
| ALL | 446 | 63.6 (11.3) |
| AMP PEAK 15(5Q35.3) MUTATED | 39 | 69.7 (10.7) |
| AMP PEAK 15(5Q35.3) WILD-TYPE | 407 | 63.0 (11.1) |
Figure S22. Get High-res Image Clustering Approach #15: 'Amp Peak 15(5q35.3) mutation analysis' versus Clinical Feature #2: 'AGE'

P value = 1.16e-07 (Fisher's exact test), Q value = 4.7e-05
Table S38. Clustering Approach #15: 'Amp Peak 15(5q35.3) mutation analysis' versus Clinical Feature #3: 'HISTOLOGICAL.TYPE'
| nPatients | ENDOMETRIOID ENDOMETRIAL ADENOCARCINOMA | MIXED SEROUS AND ENDOMETRIOID | SEROUS ENDOMETRIAL ADENOCARCINOMA |
|---|---|---|---|
| ALL | 350 | 18 | 79 |
| AMP PEAK 15(5Q35.3) MUTATED | 16 | 2 | 21 |
| AMP PEAK 15(5Q35.3) WILD-TYPE | 334 | 16 | 58 |
Figure S23. Get High-res Image Clustering Approach #15: 'Amp Peak 15(5q35.3) mutation analysis' versus Clinical Feature #3: 'HISTOLOGICAL.TYPE'

Table S39. Description of clustering approach #16: 'Amp Peak 16(6p24.2) mutation analysis'
| Cluster Labels | AMP PEAK 16(6P24.2) MUTATED | AMP PEAK 16(6P24.2) WILD-TYPE |
|---|---|---|
| Number of samples | 83 | 364 |
P value = 1.21e-06 (t-test), Q value = 0.00047
Table S40. Clustering Approach #16: 'Amp Peak 16(6p24.2) mutation analysis' versus Clinical Feature #2: 'AGE'
| nPatients | Mean (Std.Dev) | |
|---|---|---|
| ALL | 446 | 63.6 (11.3) |
| AMP PEAK 16(6P24.2) MUTATED | 83 | 68.7 (9.9) |
| AMP PEAK 16(6P24.2) WILD-TYPE | 363 | 62.4 (11.2) |
Figure S24. Get High-res Image Clustering Approach #16: 'Amp Peak 16(6p24.2) mutation analysis' versus Clinical Feature #2: 'AGE'
P value = 4.15e-17 (Fisher's exact test), Q value = 1.9e-14
Table S41. Clustering Approach #16: 'Amp Peak 16(6p24.2) mutation analysis' versus Clinical Feature #3: 'HISTOLOGICAL.TYPE'
| nPatients | ENDOMETRIOID ENDOMETRIAL ADENOCARCINOMA | MIXED SEROUS AND ENDOMETRIOID | SEROUS ENDOMETRIAL ADENOCARCINOMA |
|---|---|---|---|
| ALL | 350 | 18 | 79 |
| AMP PEAK 16(6P24.2) MUTATED | 35 | 4 | 44 |
| AMP PEAK 16(6P24.2) WILD-TYPE | 315 | 14 | 35 |
Figure S25. Get High-res Image Clustering Approach #16: 'Amp Peak 16(6p24.2) mutation analysis' versus Clinical Feature #3: 'HISTOLOGICAL.TYPE'

Table S42. Description of clustering approach #17: 'Amp Peak 17(6q25.1) mutation analysis'
| Cluster Labels | AMP PEAK 17(6Q25.1) MUTATED | AMP PEAK 17(6Q25.1) WILD-TYPE |
|---|---|---|
| Number of samples | 64 | 383 |
P value = 3.39e-05 (Fisher's exact test), Q value = 0.012
Table S43. Clustering Approach #17: 'Amp Peak 17(6q25.1) mutation analysis' versus Clinical Feature #3: 'HISTOLOGICAL.TYPE'
| nPatients | ENDOMETRIOID ENDOMETRIAL ADENOCARCINOMA | MIXED SEROUS AND ENDOMETRIOID | SEROUS ENDOMETRIAL ADENOCARCINOMA |
|---|---|---|---|
| ALL | 350 | 18 | 79 |
| AMP PEAK 17(6Q25.1) MUTATED | 37 | 2 | 25 |
| AMP PEAK 17(6Q25.1) WILD-TYPE | 313 | 16 | 54 |
Figure S26. Get High-res Image Clustering Approach #17: 'Amp Peak 17(6q25.1) mutation analysis' versus Clinical Feature #3: 'HISTOLOGICAL.TYPE'

Table S44. Description of clustering approach #18: 'Amp Peak 18(7q22.1) mutation analysis'
| Cluster Labels | AMP PEAK 18(7Q22.1) MUTATED | AMP PEAK 18(7Q22.1) WILD-TYPE |
|---|---|---|
| Number of samples | 70 | 377 |
P value = 0.00054 (logrank test), Q value = 0.18
Table S45. Clustering Approach #18: 'Amp Peak 18(7q22.1) mutation analysis' versus Clinical Feature #1: 'Time to Death'
| nPatients | nDeath | Duration Range (Median), Month | |
|---|---|---|---|
| ALL | 442 | 41 | 0.0 - 187.1 (15.9) |
| AMP PEAK 18(7Q22.1) MUTATED | 68 | 13 | 0.0 - 113.2 (13.1) |
| AMP PEAK 18(7Q22.1) WILD-TYPE | 374 | 28 | 0.1 - 187.1 (16.4) |
Figure S27. Get High-res Image Clustering Approach #18: 'Amp Peak 18(7q22.1) mutation analysis' versus Clinical Feature #1: 'Time to Death'
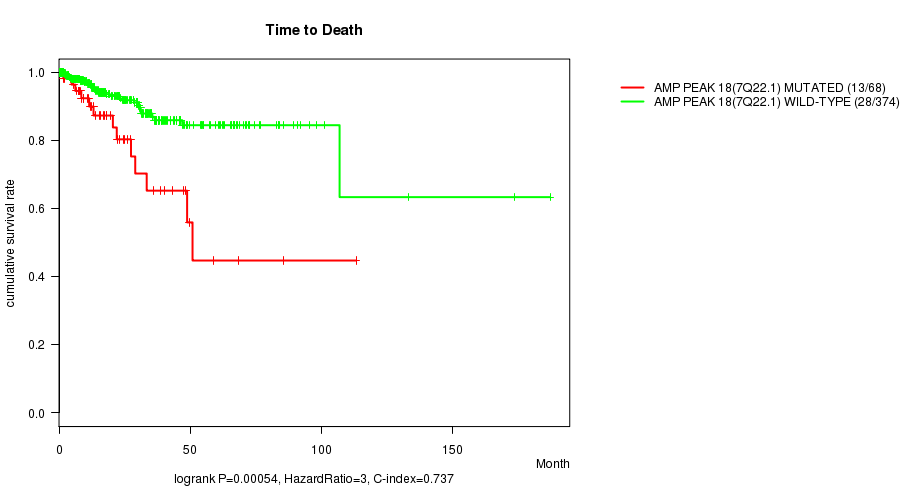
Table S46. Description of clustering approach #19: 'Amp Peak 19(8p11.21) mutation analysis'
| Cluster Labels | AMP PEAK 19(8P11.21) MUTATED | AMP PEAK 19(8P11.21) WILD-TYPE |
|---|---|---|
| Number of samples | 131 | 316 |
P value = 1.59e-05 (logrank test), Q value = 0.006
Table S47. Clustering Approach #19: 'Amp Peak 19(8p11.21) mutation analysis' versus Clinical Feature #1: 'Time to Death'
| nPatients | nDeath | Duration Range (Median), Month | |
|---|---|---|---|
| ALL | 442 | 41 | 0.0 - 187.1 (15.9) |
| AMP PEAK 19(8P11.21) MUTATED | 129 | 22 | 0.0 - 113.2 (11.5) |
| AMP PEAK 19(8P11.21) WILD-TYPE | 313 | 19 | 0.0 - 187.1 (16.9) |
Figure S28. Get High-res Image Clustering Approach #19: 'Amp Peak 19(8p11.21) mutation analysis' versus Clinical Feature #1: 'Time to Death'
P value = 1.36e-07 (Fisher's exact test), Q value = 5.5e-05
Table S48. Clustering Approach #19: 'Amp Peak 19(8p11.21) mutation analysis' versus Clinical Feature #3: 'HISTOLOGICAL.TYPE'
| nPatients | ENDOMETRIOID ENDOMETRIAL ADENOCARCINOMA | MIXED SEROUS AND ENDOMETRIOID | SEROUS ENDOMETRIAL ADENOCARCINOMA |
|---|---|---|---|
| ALL | 350 | 18 | 79 |
| AMP PEAK 19(8P11.21) MUTATED | 81 | 6 | 44 |
| AMP PEAK 19(8P11.21) WILD-TYPE | 269 | 12 | 35 |
Figure S29. Get High-res Image Clustering Approach #19: 'Amp Peak 19(8p11.21) mutation analysis' versus Clinical Feature #3: 'HISTOLOGICAL.TYPE'
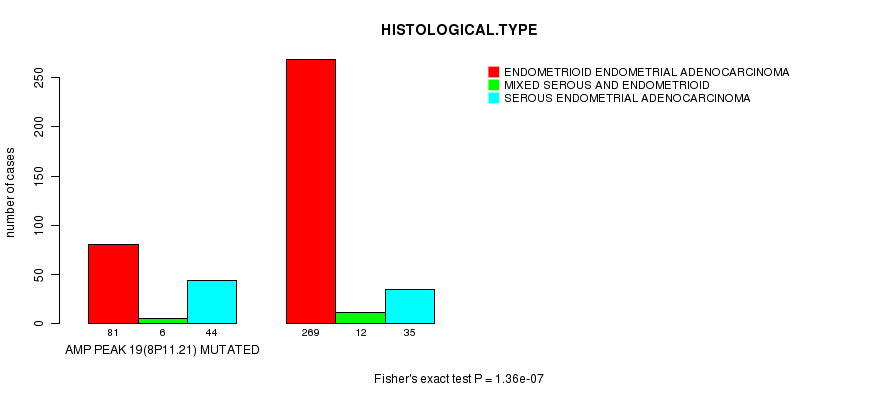
Table S49. Description of clustering approach #20: 'Amp Peak 20(8q24.21) mutation analysis'
| Cluster Labels | AMP PEAK 20(8Q24.21) MUTATED | AMP PEAK 20(8Q24.21) WILD-TYPE |
|---|---|---|
| Number of samples | 163 | 284 |
P value = 1.36e-12 (Fisher's exact test), Q value = 6e-10
Table S50. Clustering Approach #20: 'Amp Peak 20(8q24.21) mutation analysis' versus Clinical Feature #3: 'HISTOLOGICAL.TYPE'
| nPatients | ENDOMETRIOID ENDOMETRIAL ADENOCARCINOMA | MIXED SEROUS AND ENDOMETRIOID | SEROUS ENDOMETRIAL ADENOCARCINOMA |
|---|---|---|---|
| ALL | 350 | 18 | 79 |
| AMP PEAK 20(8Q24.21) MUTATED | 98 | 8 | 57 |
| AMP PEAK 20(8Q24.21) WILD-TYPE | 252 | 10 | 22 |
Figure S30. Get High-res Image Clustering Approach #20: 'Amp Peak 20(8q24.21) mutation analysis' versus Clinical Feature #3: 'HISTOLOGICAL.TYPE'
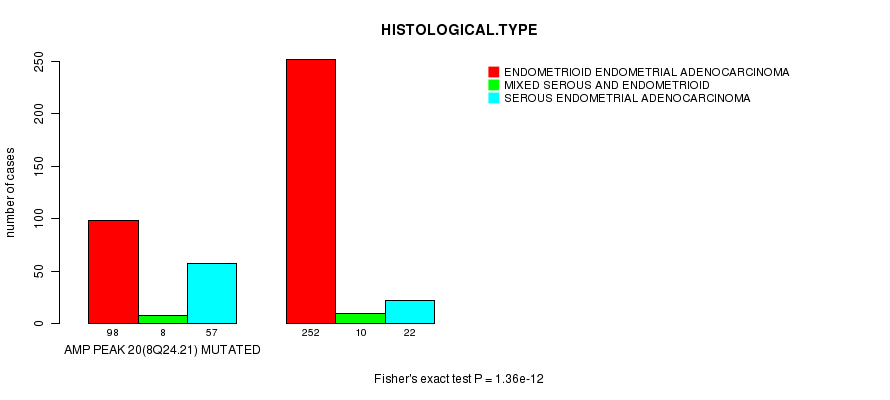
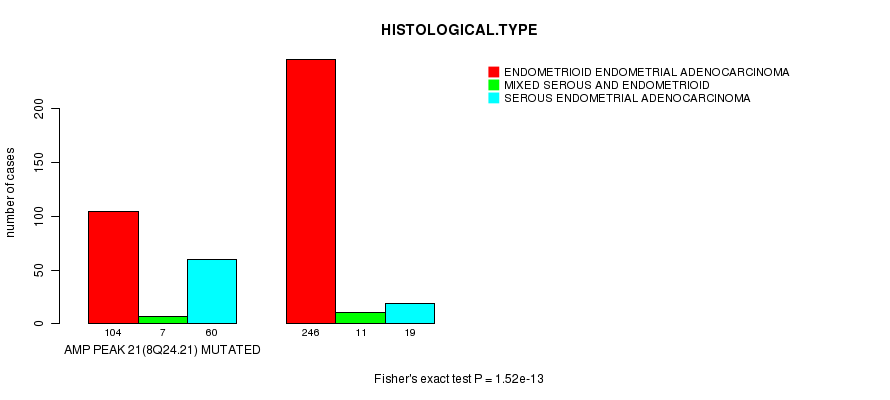
Table S51. Description of clustering approach #21: 'Amp Peak 21(8q24.21) mutation analysis'
| Cluster Labels | AMP PEAK 21(8Q24.21) MUTATED | AMP PEAK 21(8Q24.21) WILD-TYPE |
|---|---|---|
| Number of samples | 171 | 276 |
P value = 1.52e-13 (Fisher's exact test), Q value = 6.8e-11
Table S52. Clustering Approach #21: 'Amp Peak 21(8q24.21) mutation analysis' versus Clinical Feature #3: 'HISTOLOGICAL.TYPE'
| nPatients | ENDOMETRIOID ENDOMETRIAL ADENOCARCINOMA | MIXED SEROUS AND ENDOMETRIOID | SEROUS ENDOMETRIAL ADENOCARCINOMA |
|---|---|---|---|
| ALL | 350 | 18 | 79 |
| AMP PEAK 21(8Q24.21) MUTATED | 104 | 7 | 60 |
| AMP PEAK 21(8Q24.21) WILD-TYPE | 246 | 11 | 19 |
Figure S31. Get High-res Image Clustering Approach #21: 'Amp Peak 21(8q24.21) mutation analysis' versus Clinical Feature #3: 'HISTOLOGICAL.TYPE'
P value = 0.000433 (Fisher's exact test), Q value = 0.15
Table S53. Clustering Approach #21: 'Amp Peak 21(8q24.21) mutation analysis' versus Clinical Feature #5: 'COMPLETENESS.OF.RESECTION'
| nPatients | R0 | R1 | R2 | RX |
|---|---|---|---|---|
| ALL | 307 | 24 | 15 | 24 |
| AMP PEAK 21(8Q24.21) MUTATED | 115 | 5 | 13 | 10 |
| AMP PEAK 21(8Q24.21) WILD-TYPE | 192 | 19 | 2 | 14 |
Figure S32. Get High-res Image Clustering Approach #21: 'Amp Peak 21(8q24.21) mutation analysis' versus Clinical Feature #5: 'COMPLETENESS.OF.RESECTION'
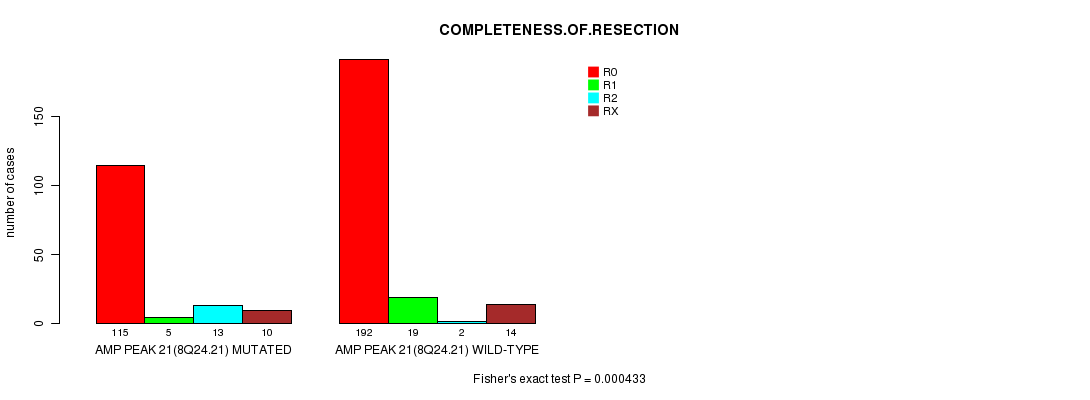
Table S54. Description of clustering approach #22: 'Amp Peak 22(9p24.2) mutation analysis'
| Cluster Labels | AMP PEAK 22(9P24.2) MUTATED | AMP PEAK 22(9P24.2) WILD-TYPE |
|---|---|---|
| Number of samples | 48 | 399 |
P value = 1.1e-07 (Fisher's exact test), Q value = 4.4e-05
Table S55. Clustering Approach #22: 'Amp Peak 22(9p24.2) mutation analysis' versus Clinical Feature #3: 'HISTOLOGICAL.TYPE'
| nPatients | ENDOMETRIOID ENDOMETRIAL ADENOCARCINOMA | MIXED SEROUS AND ENDOMETRIOID | SEROUS ENDOMETRIAL ADENOCARCINOMA |
|---|---|---|---|
| ALL | 350 | 18 | 79 |
| AMP PEAK 22(9P24.2) MUTATED | 22 | 2 | 24 |
| AMP PEAK 22(9P24.2) WILD-TYPE | 328 | 16 | 55 |
Figure S33. Get High-res Image Clustering Approach #22: 'Amp Peak 22(9p24.2) mutation analysis' versus Clinical Feature #3: 'HISTOLOGICAL.TYPE'

Table S56. Description of clustering approach #23: 'Amp Peak 23(9q34.3) mutation analysis'
| Cluster Labels | AMP PEAK 23(9Q34.3) MUTATED | AMP PEAK 23(9Q34.3) WILD-TYPE |
|---|---|---|
| Number of samples | 31 | 416 |
P value = 0.000554 (t-test), Q value = 0.19
Table S57. Clustering Approach #23: 'Amp Peak 23(9q34.3) mutation analysis' versus Clinical Feature #2: 'AGE'
| nPatients | Mean (Std.Dev) | |
|---|---|---|
| ALL | 446 | 63.6 (11.3) |
| AMP PEAK 23(9Q34.3) MUTATED | 31 | 69.0 (8.0) |
| AMP PEAK 23(9Q34.3) WILD-TYPE | 415 | 63.2 (11.4) |
Figure S34. Get High-res Image Clustering Approach #23: 'Amp Peak 23(9q34.3) mutation analysis' versus Clinical Feature #2: 'AGE'
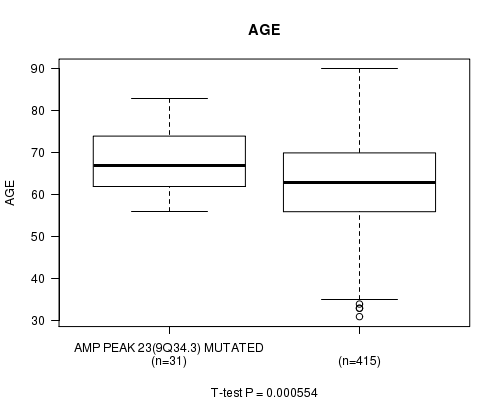
P value = 2.26e-07 (Fisher's exact test), Q value = 9e-05
Table S58. Clustering Approach #23: 'Amp Peak 23(9q34.3) mutation analysis' versus Clinical Feature #3: 'HISTOLOGICAL.TYPE'
| nPatients | ENDOMETRIOID ENDOMETRIAL ADENOCARCINOMA | MIXED SEROUS AND ENDOMETRIOID | SEROUS ENDOMETRIAL ADENOCARCINOMA |
|---|---|---|---|
| ALL | 350 | 18 | 79 |
| AMP PEAK 23(9Q34.3) MUTATED | 11 | 4 | 16 |
| AMP PEAK 23(9Q34.3) WILD-TYPE | 339 | 14 | 63 |
Figure S35. Get High-res Image Clustering Approach #23: 'Amp Peak 23(9q34.3) mutation analysis' versus Clinical Feature #3: 'HISTOLOGICAL.TYPE'
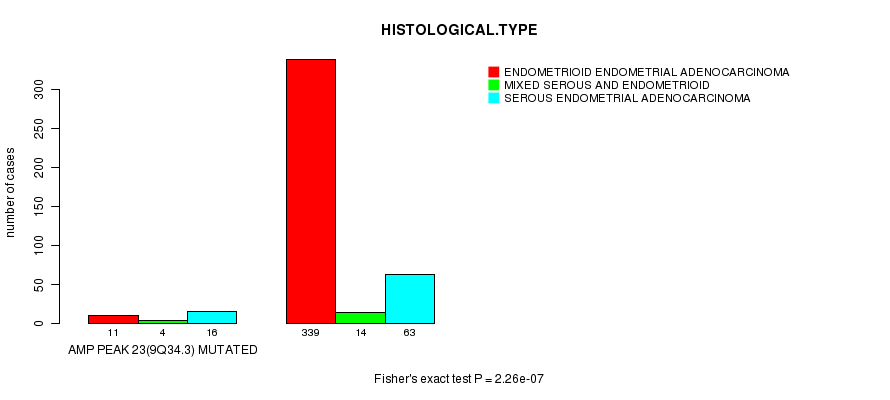
Table S59. Description of clustering approach #24: 'Amp Peak 24(10q22.2) mutation analysis'
| Cluster Labels | AMP PEAK 24(10Q22.2) MUTATED | AMP PEAK 24(10Q22.2) WILD-TYPE |
|---|---|---|
| Number of samples | 121 | 326 |
Table S60. Description of clustering approach #25: 'Amp Peak 25(11p11.2) mutation analysis'
| Cluster Labels | AMP PEAK 25(11P11.2) MUTATED | AMP PEAK 25(11P11.2) WILD-TYPE |
|---|---|---|
| Number of samples | 37 | 410 |
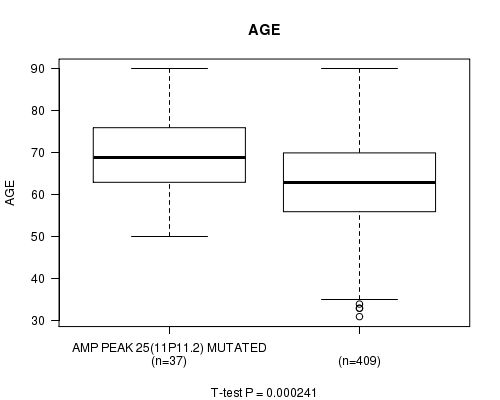
P value = 0.000241 (t-test), Q value = 0.084
Table S61. Clustering Approach #25: 'Amp Peak 25(11p11.2) mutation analysis' versus Clinical Feature #2: 'AGE'
| nPatients | Mean (Std.Dev) | |
|---|---|---|
| ALL | 446 | 63.6 (11.3) |
| AMP PEAK 25(11P11.2) MUTATED | 37 | 69.7 (9.6) |
| AMP PEAK 25(11P11.2) WILD-TYPE | 409 | 63.0 (11.2) |
Figure S36. Get High-res Image Clustering Approach #25: 'Amp Peak 25(11p11.2) mutation analysis' versus Clinical Feature #2: 'AGE'
P value = 5.11e-08 (Fisher's exact test), Q value = 2.1e-05
Table S62. Clustering Approach #25: 'Amp Peak 25(11p11.2) mutation analysis' versus Clinical Feature #3: 'HISTOLOGICAL.TYPE'
| nPatients | ENDOMETRIOID ENDOMETRIAL ADENOCARCINOMA | MIXED SEROUS AND ENDOMETRIOID | SEROUS ENDOMETRIAL ADENOCARCINOMA |
|---|---|---|---|
| ALL | 350 | 18 | 79 |
| AMP PEAK 25(11P11.2) MUTATED | 14 | 3 | 20 |
| AMP PEAK 25(11P11.2) WILD-TYPE | 336 | 15 | 59 |
Figure S37. Get High-res Image Clustering Approach #25: 'Amp Peak 25(11p11.2) mutation analysis' versus Clinical Feature #3: 'HISTOLOGICAL.TYPE'

Table S63. Description of clustering approach #26: 'Amp Peak 26(11q13.2) mutation analysis'
| Cluster Labels | AMP PEAK 26(11Q13.2) MUTATED | AMP PEAK 26(11Q13.2) WILD-TYPE |
|---|---|---|
| Number of samples | 56 | 391 |
P value = 2.53e-07 (Fisher's exact test), Q value = 1e-04
Table S64. Clustering Approach #26: 'Amp Peak 26(11q13.2) mutation analysis' versus Clinical Feature #3: 'HISTOLOGICAL.TYPE'
| nPatients | ENDOMETRIOID ENDOMETRIAL ADENOCARCINOMA | MIXED SEROUS AND ENDOMETRIOID | SEROUS ENDOMETRIAL ADENOCARCINOMA |
|---|---|---|---|
| ALL | 350 | 18 | 79 |
| AMP PEAK 26(11Q13.2) MUTATED | 28 | 2 | 26 |
| AMP PEAK 26(11Q13.2) WILD-TYPE | 322 | 16 | 53 |
Figure S38. Get High-res Image Clustering Approach #26: 'Amp Peak 26(11q13.2) mutation analysis' versus Clinical Feature #3: 'HISTOLOGICAL.TYPE'

Table S65. Description of clustering approach #27: 'Amp Peak 27(12p12.1) mutation analysis'
| Cluster Labels | AMP PEAK 27(12P12.1) MUTATED | AMP PEAK 27(12P12.1) WILD-TYPE |
|---|---|---|
| Number of samples | 67 | 380 |
P value = 2.77e-07 (Fisher's exact test), Q value = 0.00011
Table S66. Clustering Approach #27: 'Amp Peak 27(12p12.1) mutation analysis' versus Clinical Feature #3: 'HISTOLOGICAL.TYPE'
| nPatients | ENDOMETRIOID ENDOMETRIAL ADENOCARCINOMA | MIXED SEROUS AND ENDOMETRIOID | SEROUS ENDOMETRIAL ADENOCARCINOMA |
|---|---|---|---|
| ALL | 350 | 18 | 79 |
| AMP PEAK 27(12P12.1) MUTATED | 36 | 2 | 29 |
| AMP PEAK 27(12P12.1) WILD-TYPE | 314 | 16 | 50 |
Figure S39. Get High-res Image Clustering Approach #27: 'Amp Peak 27(12p12.1) mutation analysis' versus Clinical Feature #3: 'HISTOLOGICAL.TYPE'

Table S67. Description of clustering approach #28: 'Amp Peak 28(12q13.11) mutation analysis'
| Cluster Labels | AMP PEAK 28(12Q13.11) MUTATED | AMP PEAK 28(12Q13.11) WILD-TYPE |
|---|---|---|
| Number of samples | 66 | 381 |
P value = 5.46e-07 (Fisher's exact test), Q value = 0.00021
Table S68. Clustering Approach #28: 'Amp Peak 28(12q13.11) mutation analysis' versus Clinical Feature #3: 'HISTOLOGICAL.TYPE'
| nPatients | ENDOMETRIOID ENDOMETRIAL ADENOCARCINOMA | MIXED SEROUS AND ENDOMETRIOID | SEROUS ENDOMETRIAL ADENOCARCINOMA |
|---|---|---|---|
| ALL | 350 | 18 | 79 |
| AMP PEAK 28(12Q13.11) MUTATED | 35 | 3 | 28 |
| AMP PEAK 28(12Q13.11) WILD-TYPE | 315 | 15 | 51 |
Figure S40. Get High-res Image Clustering Approach #28: 'Amp Peak 28(12q13.11) mutation analysis' versus Clinical Feature #3: 'HISTOLOGICAL.TYPE'
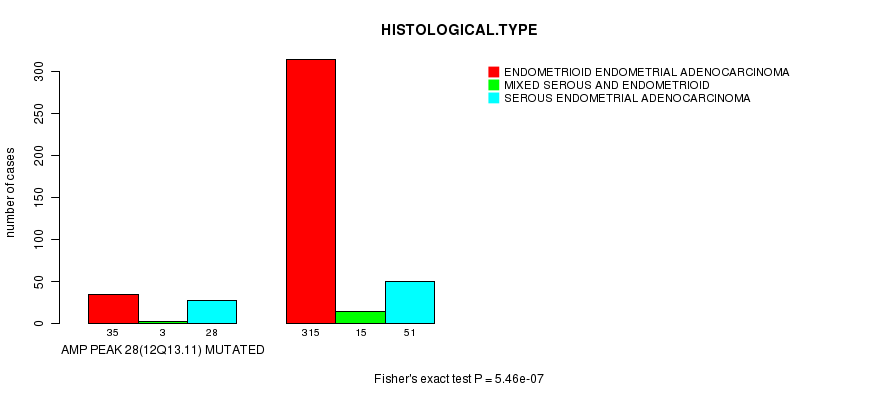
Table S69. Description of clustering approach #29: 'Amp Peak 29(12q13.2) mutation analysis'
| Cluster Labels | AMP PEAK 29(12Q13.2) MUTATED | AMP PEAK 29(12Q13.2) WILD-TYPE |
|---|---|---|
| Number of samples | 74 | 373 |
P value = 7.52e-07 (Fisher's exact test), Q value = 0.00029
Table S70. Clustering Approach #29: 'Amp Peak 29(12q13.2) mutation analysis' versus Clinical Feature #3: 'HISTOLOGICAL.TYPE'
| nPatients | ENDOMETRIOID ENDOMETRIAL ADENOCARCINOMA | MIXED SEROUS AND ENDOMETRIOID | SEROUS ENDOMETRIAL ADENOCARCINOMA |
|---|---|---|---|
| ALL | 350 | 18 | 79 |
| AMP PEAK 29(12Q13.2) MUTATED | 41 | 3 | 30 |
| AMP PEAK 29(12Q13.2) WILD-TYPE | 309 | 15 | 49 |
Figure S41. Get High-res Image Clustering Approach #29: 'Amp Peak 29(12q13.2) mutation analysis' versus Clinical Feature #3: 'HISTOLOGICAL.TYPE'
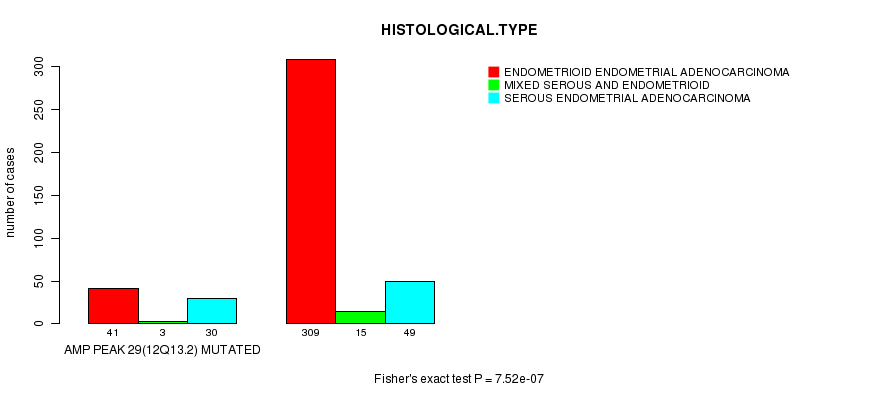
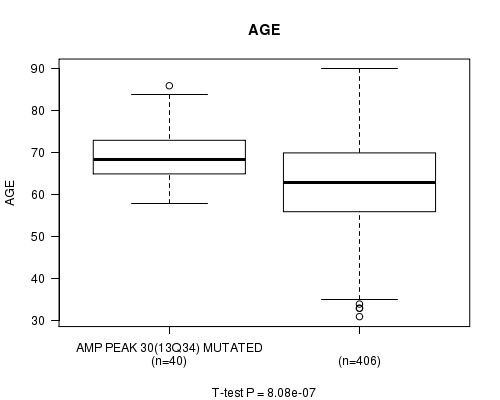
Table S71. Description of clustering approach #30: 'Amp Peak 30(13q34) mutation analysis'
| Cluster Labels | AMP PEAK 30(13Q34) MUTATED | AMP PEAK 30(13Q34) WILD-TYPE |
|---|---|---|
| Number of samples | 40 | 407 |
P value = 8.08e-07 (t-test), Q value = 0.00032
Table S72. Clustering Approach #30: 'Amp Peak 30(13q34) mutation analysis' versus Clinical Feature #2: 'AGE'
| nPatients | Mean (Std.Dev) | |
|---|---|---|
| ALL | 446 | 63.6 (11.3) |
| AMP PEAK 30(13Q34) MUTATED | 40 | 69.9 (7.1) |
| AMP PEAK 30(13Q34) WILD-TYPE | 406 | 63.0 (11.4) |
Figure S42. Get High-res Image Clustering Approach #30: 'Amp Peak 30(13q34) mutation analysis' versus Clinical Feature #2: 'AGE'
P value = 9.08e-11 (Fisher's exact test), Q value = 3.9e-08
Table S73. Clustering Approach #30: 'Amp Peak 30(13q34) mutation analysis' versus Clinical Feature #3: 'HISTOLOGICAL.TYPE'
| nPatients | ENDOMETRIOID ENDOMETRIAL ADENOCARCINOMA | MIXED SEROUS AND ENDOMETRIOID | SEROUS ENDOMETRIAL ADENOCARCINOMA |
|---|---|---|---|
| ALL | 350 | 18 | 79 |
| AMP PEAK 30(13Q34) MUTATED | 13 | 3 | 24 |
| AMP PEAK 30(13Q34) WILD-TYPE | 337 | 15 | 55 |
Figure S43. Get High-res Image Clustering Approach #30: 'Amp Peak 30(13q34) mutation analysis' versus Clinical Feature #3: 'HISTOLOGICAL.TYPE'
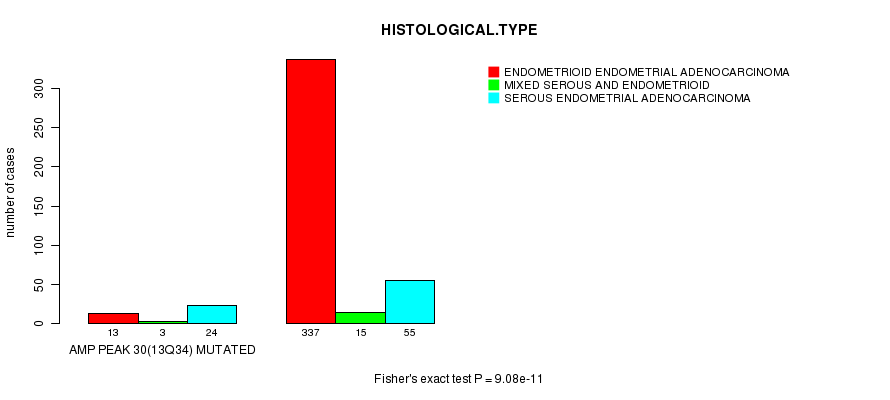
Table S74. Description of clustering approach #31: 'Amp Peak 31(14q24.3) mutation analysis'
| Cluster Labels | AMP PEAK 31(14Q24.3) MUTATED | AMP PEAK 31(14Q24.3) WILD-TYPE |
|---|---|---|
| Number of samples | 48 | 399 |
P value = 2.03e-05 (t-test), Q value = 0.0076
Table S75. Clustering Approach #31: 'Amp Peak 31(14q24.3) mutation analysis' versus Clinical Feature #2: 'AGE'
| nPatients | Mean (Std.Dev) | |
|---|---|---|
| ALL | 446 | 63.6 (11.3) |
| AMP PEAK 31(14Q24.3) MUTATED | 48 | 69.0 (8.4) |
| AMP PEAK 31(14Q24.3) WILD-TYPE | 398 | 62.9 (11.4) |
Figure S44. Get High-res Image Clustering Approach #31: 'Amp Peak 31(14q24.3) mutation analysis' versus Clinical Feature #2: 'AGE'

P value = 1.62e-11 (Fisher's exact test), Q value = 7e-09
Table S76. Clustering Approach #31: 'Amp Peak 31(14q24.3) mutation analysis' versus Clinical Feature #3: 'HISTOLOGICAL.TYPE'
| nPatients | ENDOMETRIOID ENDOMETRIAL ADENOCARCINOMA | MIXED SEROUS AND ENDOMETRIOID | SEROUS ENDOMETRIAL ADENOCARCINOMA |
|---|---|---|---|
| ALL | 350 | 18 | 79 |
| AMP PEAK 31(14Q24.3) MUTATED | 17 | 4 | 27 |
| AMP PEAK 31(14Q24.3) WILD-TYPE | 333 | 14 | 52 |
Figure S45. Get High-res Image Clustering Approach #31: 'Amp Peak 31(14q24.3) mutation analysis' versus Clinical Feature #3: 'HISTOLOGICAL.TYPE'

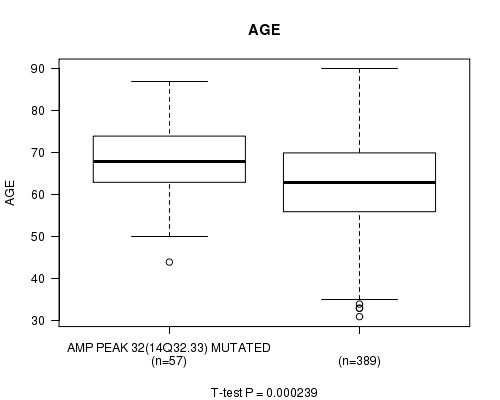
Table S77. Description of clustering approach #32: 'Amp Peak 32(14q32.33) mutation analysis'
| Cluster Labels | AMP PEAK 32(14Q32.33) MUTATED | AMP PEAK 32(14Q32.33) WILD-TYPE |
|---|---|---|
| Number of samples | 57 | 390 |
P value = 0.000239 (t-test), Q value = 0.084
Table S78. Clustering Approach #32: 'Amp Peak 32(14q32.33) mutation analysis' versus Clinical Feature #2: 'AGE'
| nPatients | Mean (Std.Dev) | |
|---|---|---|
| ALL | 446 | 63.6 (11.3) |
| AMP PEAK 32(14Q32.33) MUTATED | 57 | 68.2 (9.4) |
| AMP PEAK 32(14Q32.33) WILD-TYPE | 389 | 62.9 (11.4) |
Figure S46. Get High-res Image Clustering Approach #32: 'Amp Peak 32(14q32.33) mutation analysis' versus Clinical Feature #2: 'AGE'
P value = 1.45e-09 (Fisher's exact test), Q value = 6.1e-07
Table S79. Clustering Approach #32: 'Amp Peak 32(14q32.33) mutation analysis' versus Clinical Feature #3: 'HISTOLOGICAL.TYPE'
| nPatients | ENDOMETRIOID ENDOMETRIAL ADENOCARCINOMA | MIXED SEROUS AND ENDOMETRIOID | SEROUS ENDOMETRIAL ADENOCARCINOMA |
|---|---|---|---|
| ALL | 350 | 18 | 79 |
| AMP PEAK 32(14Q32.33) MUTATED | 25 | 4 | 28 |
| AMP PEAK 32(14Q32.33) WILD-TYPE | 325 | 14 | 51 |
Figure S47. Get High-res Image Clustering Approach #32: 'Amp Peak 32(14q32.33) mutation analysis' versus Clinical Feature #3: 'HISTOLOGICAL.TYPE'

Table S80. Description of clustering approach #33: 'Amp Peak 33(16p11.2) mutation analysis'
| Cluster Labels | AMP PEAK 33(16P11.2) MUTATED | AMP PEAK 33(16P11.2) WILD-TYPE |
|---|---|---|
| Number of samples | 47 | 400 |
P value = 0.00031 (t-test), Q value = 0.11
Table S81. Clustering Approach #33: 'Amp Peak 33(16p11.2) mutation analysis' versus Clinical Feature #2: 'AGE'
| nPatients | Mean (Std.Dev) | |
|---|---|---|
| ALL | 446 | 63.6 (11.3) |
| AMP PEAK 33(16P11.2) MUTATED | 47 | 68.3 (8.6) |
| AMP PEAK 33(16P11.2) WILD-TYPE | 399 | 63.0 (11.4) |
Figure S48. Get High-res Image Clustering Approach #33: 'Amp Peak 33(16p11.2) mutation analysis' versus Clinical Feature #2: 'AGE'

P value = 8.05e-14 (Fisher's exact test), Q value = 3.6e-11
Table S82. Clustering Approach #33: 'Amp Peak 33(16p11.2) mutation analysis' versus Clinical Feature #3: 'HISTOLOGICAL.TYPE'
| nPatients | ENDOMETRIOID ENDOMETRIAL ADENOCARCINOMA | MIXED SEROUS AND ENDOMETRIOID | SEROUS ENDOMETRIAL ADENOCARCINOMA |
|---|---|---|---|
| ALL | 350 | 18 | 79 |
| AMP PEAK 33(16P11.2) MUTATED | 15 | 2 | 30 |
| AMP PEAK 33(16P11.2) WILD-TYPE | 335 | 16 | 49 |
Figure S49. Get High-res Image Clustering Approach #33: 'Amp Peak 33(16p11.2) mutation analysis' versus Clinical Feature #3: 'HISTOLOGICAL.TYPE'

Table S83. Description of clustering approach #34: 'Amp Peak 34(17q11.2) mutation analysis'
| Cluster Labels | AMP PEAK 34(17Q11.2) MUTATED | AMP PEAK 34(17Q11.2) WILD-TYPE |
|---|---|---|
| Number of samples | 52 | 395 |
P value = 0.000251 (t-test), Q value = 0.087
Table S84. Clustering Approach #34: 'Amp Peak 34(17q11.2) mutation analysis' versus Clinical Feature #2: 'AGE'
| nPatients | Mean (Std.Dev) | |
|---|---|---|
| ALL | 446 | 63.6 (11.3) |
| AMP PEAK 34(17Q11.2) MUTATED | 52 | 68.0 (8.5) |
| AMP PEAK 34(17Q11.2) WILD-TYPE | 394 | 63.0 (11.4) |
Figure S50. Get High-res Image Clustering Approach #34: 'Amp Peak 34(17q11.2) mutation analysis' versus Clinical Feature #2: 'AGE'

P value = 4.04e-16 (Fisher's exact test), Q value = 1.9e-13
Table S85. Clustering Approach #34: 'Amp Peak 34(17q11.2) mutation analysis' versus Clinical Feature #3: 'HISTOLOGICAL.TYPE'
| nPatients | ENDOMETRIOID ENDOMETRIAL ADENOCARCINOMA | MIXED SEROUS AND ENDOMETRIOID | SEROUS ENDOMETRIAL ADENOCARCINOMA |
|---|---|---|---|
| ALL | 350 | 18 | 79 |
| AMP PEAK 34(17Q11.2) MUTATED | 15 | 5 | 32 |
| AMP PEAK 34(17Q11.2) WILD-TYPE | 335 | 13 | 47 |
Figure S51. Get High-res Image Clustering Approach #34: 'Amp Peak 34(17q11.2) mutation analysis' versus Clinical Feature #3: 'HISTOLOGICAL.TYPE'

P value = 0.000336 (Fisher's exact test), Q value = 0.11
Table S86. Clustering Approach #34: 'Amp Peak 34(17q11.2) mutation analysis' versus Clinical Feature #5: 'COMPLETENESS.OF.RESECTION'
| nPatients | R0 | R1 | R2 | RX |
|---|---|---|---|---|
| ALL | 307 | 24 | 15 | 24 |
| AMP PEAK 34(17Q11.2) MUTATED | 28 | 7 | 6 | 4 |
| AMP PEAK 34(17Q11.2) WILD-TYPE | 279 | 17 | 9 | 20 |
Figure S52. Get High-res Image Clustering Approach #34: 'Amp Peak 34(17q11.2) mutation analysis' versus Clinical Feature #5: 'COMPLETENESS.OF.RESECTION'
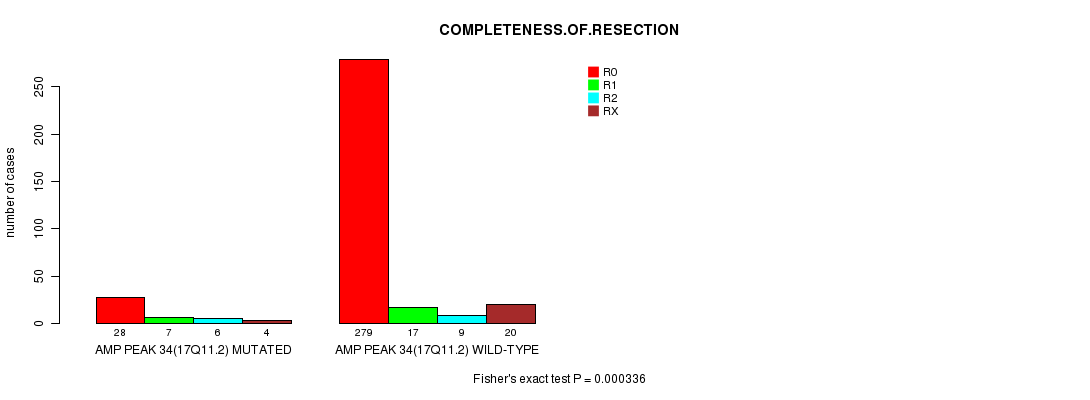
Table S87. Description of clustering approach #35: 'Amp Peak 35(17q12) mutation analysis'
| Cluster Labels | AMP PEAK 35(17Q12) MUTATED | AMP PEAK 35(17Q12) WILD-TYPE |
|---|---|---|
| Number of samples | 53 | 394 |
P value = 6.81e-05 (t-test), Q value = 0.025
Table S88. Clustering Approach #35: 'Amp Peak 35(17q12) mutation analysis' versus Clinical Feature #2: 'AGE'
| nPatients | Mean (Std.Dev) | |
|---|---|---|
| ALL | 446 | 63.6 (11.3) |
| AMP PEAK 35(17Q12) MUTATED | 53 | 68.8 (9.4) |
| AMP PEAK 35(17Q12) WILD-TYPE | 393 | 62.9 (11.3) |
Figure S53. Get High-res Image Clustering Approach #35: 'Amp Peak 35(17q12) mutation analysis' versus Clinical Feature #2: 'AGE'

P value = 1.86e-16 (Fisher's exact test), Q value = 8.6e-14
Table S89. Clustering Approach #35: 'Amp Peak 35(17q12) mutation analysis' versus Clinical Feature #3: 'HISTOLOGICAL.TYPE'
| nPatients | ENDOMETRIOID ENDOMETRIAL ADENOCARCINOMA | MIXED SEROUS AND ENDOMETRIOID | SEROUS ENDOMETRIAL ADENOCARCINOMA |
|---|---|---|---|
| ALL | 350 | 18 | 79 |
| AMP PEAK 35(17Q12) MUTATED | 16 | 3 | 34 |
| AMP PEAK 35(17Q12) WILD-TYPE | 334 | 15 | 45 |
Figure S54. Get High-res Image Clustering Approach #35: 'Amp Peak 35(17q12) mutation analysis' versus Clinical Feature #3: 'HISTOLOGICAL.TYPE'

Table S90. Description of clustering approach #36: 'Amp Peak 36(17q25.1) mutation analysis'
| Cluster Labels | AMP PEAK 36(17Q25.1) MUTATED | AMP PEAK 36(17Q25.1) WILD-TYPE |
|---|---|---|
| Number of samples | 75 | 372 |
P value = 2.97e-05 (t-test), Q value = 0.011
Table S91. Clustering Approach #36: 'Amp Peak 36(17q25.1) mutation analysis' versus Clinical Feature #2: 'AGE'
| nPatients | Mean (Std.Dev) | |
|---|---|---|
| ALL | 446 | 63.6 (11.3) |
| AMP PEAK 36(17Q25.1) MUTATED | 75 | 67.9 (9.0) |
| AMP PEAK 36(17Q25.1) WILD-TYPE | 371 | 62.7 (11.5) |
Figure S55. Get High-res Image Clustering Approach #36: 'Amp Peak 36(17q25.1) mutation analysis' versus Clinical Feature #2: 'AGE'

P value = 2.56e-15 (Fisher's exact test), Q value = 1.2e-12
Table S92. Clustering Approach #36: 'Amp Peak 36(17q25.1) mutation analysis' versus Clinical Feature #3: 'HISTOLOGICAL.TYPE'
| nPatients | ENDOMETRIOID ENDOMETRIAL ADENOCARCINOMA | MIXED SEROUS AND ENDOMETRIOID | SEROUS ENDOMETRIAL ADENOCARCINOMA |
|---|---|---|---|
| ALL | 350 | 18 | 79 |
| AMP PEAK 36(17Q25.1) MUTATED | 30 | 8 | 37 |
| AMP PEAK 36(17Q25.1) WILD-TYPE | 320 | 10 | 42 |
Figure S56. Get High-res Image Clustering Approach #36: 'Amp Peak 36(17q25.1) mutation analysis' versus Clinical Feature #3: 'HISTOLOGICAL.TYPE'
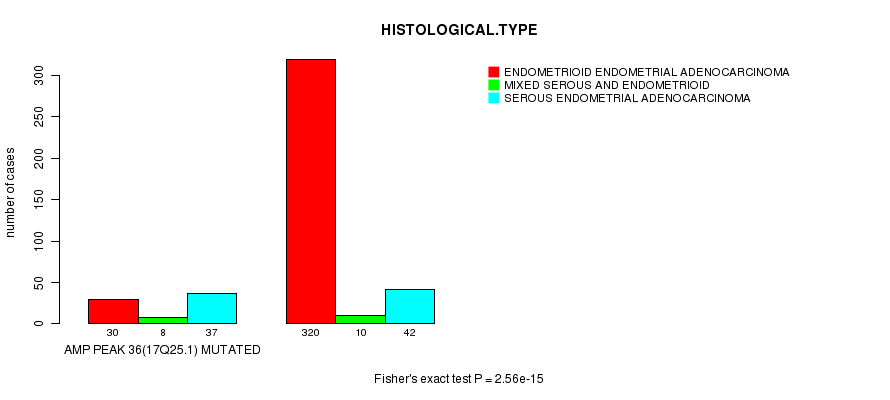
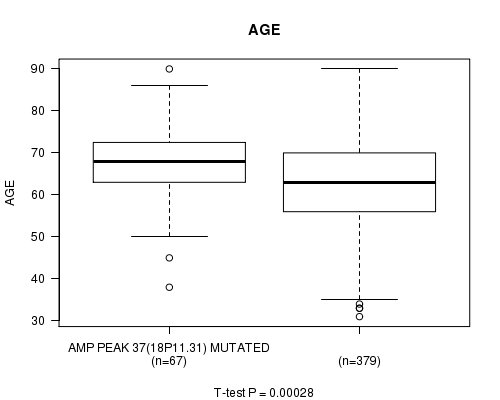
Table S93. Description of clustering approach #37: 'Amp Peak 37(18p11.31) mutation analysis'
| Cluster Labels | AMP PEAK 37(18P11.31) MUTATED | AMP PEAK 37(18P11.31) WILD-TYPE |
|---|---|---|
| Number of samples | 67 | 380 |
P value = 0.00028 (t-test), Q value = 0.097
Table S94. Clustering Approach #37: 'Amp Peak 37(18p11.31) mutation analysis' versus Clinical Feature #2: 'AGE'
| nPatients | Mean (Std.Dev) | |
|---|---|---|
| ALL | 446 | 63.6 (11.3) |
| AMP PEAK 37(18P11.31) MUTATED | 67 | 67.6 (9.2) |
| AMP PEAK 37(18P11.31) WILD-TYPE | 379 | 62.9 (11.4) |
Figure S57. Get High-res Image Clustering Approach #37: 'Amp Peak 37(18p11.31) mutation analysis' versus Clinical Feature #2: 'AGE'
P value = 2.58e-18 (Fisher's exact test), Q value = 1.2e-15
Table S95. Clustering Approach #37: 'Amp Peak 37(18p11.31) mutation analysis' versus Clinical Feature #3: 'HISTOLOGICAL.TYPE'
| nPatients | ENDOMETRIOID ENDOMETRIAL ADENOCARCINOMA | MIXED SEROUS AND ENDOMETRIOID | SEROUS ENDOMETRIAL ADENOCARCINOMA |
|---|---|---|---|
| ALL | 350 | 18 | 79 |
| AMP PEAK 37(18P11.31) MUTATED | 23 | 4 | 40 |
| AMP PEAK 37(18P11.31) WILD-TYPE | 327 | 14 | 39 |
Figure S58. Get High-res Image Clustering Approach #37: 'Amp Peak 37(18p11.31) mutation analysis' versus Clinical Feature #3: 'HISTOLOGICAL.TYPE'

Table S96. Description of clustering approach #38: 'Amp Peak 38(18q11.2) mutation analysis'
| Cluster Labels | AMP PEAK 38(18Q11.2) MUTATED | AMP PEAK 38(18Q11.2) WILD-TYPE |
|---|---|---|
| Number of samples | 51 | 396 |
P value = 8.76e-13 (Fisher's exact test), Q value = 3.9e-10
Table S97. Clustering Approach #38: 'Amp Peak 38(18q11.2) mutation analysis' versus Clinical Feature #3: 'HISTOLOGICAL.TYPE'
| nPatients | ENDOMETRIOID ENDOMETRIAL ADENOCARCINOMA | MIXED SEROUS AND ENDOMETRIOID | SEROUS ENDOMETRIAL ADENOCARCINOMA |
|---|---|---|---|
| ALL | 350 | 18 | 79 |
| AMP PEAK 38(18Q11.2) MUTATED | 18 | 3 | 30 |
| AMP PEAK 38(18Q11.2) WILD-TYPE | 332 | 15 | 49 |
Figure S59. Get High-res Image Clustering Approach #38: 'Amp Peak 38(18q11.2) mutation analysis' versus Clinical Feature #3: 'HISTOLOGICAL.TYPE'

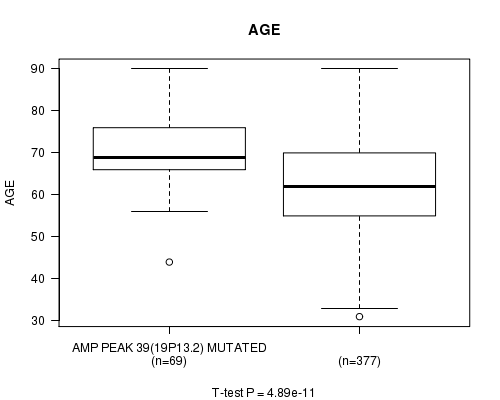
Table S98. Description of clustering approach #39: 'Amp Peak 39(19p13.2) mutation analysis'
| Cluster Labels | AMP PEAK 39(19P13.2) MUTATED | AMP PEAK 39(19P13.2) WILD-TYPE |
|---|---|---|
| Number of samples | 69 | 378 |
P value = 4.89e-11 (t-test), Q value = 2.1e-08
Table S99. Clustering Approach #39: 'Amp Peak 39(19p13.2) mutation analysis' versus Clinical Feature #2: 'AGE'
| nPatients | Mean (Std.Dev) | |
|---|---|---|
| ALL | 446 | 63.6 (11.3) |
| AMP PEAK 39(19P13.2) MUTATED | 69 | 70.7 (8.4) |
| AMP PEAK 39(19P13.2) WILD-TYPE | 377 | 62.3 (11.2) |
Figure S60. Get High-res Image Clustering Approach #39: 'Amp Peak 39(19p13.2) mutation analysis' versus Clinical Feature #2: 'AGE'
P value = 1.19e-17 (Fisher's exact test), Q value = 5.6e-15
Table S100. Clustering Approach #39: 'Amp Peak 39(19p13.2) mutation analysis' versus Clinical Feature #3: 'HISTOLOGICAL.TYPE'
| nPatients | ENDOMETRIOID ENDOMETRIAL ADENOCARCINOMA | MIXED SEROUS AND ENDOMETRIOID | SEROUS ENDOMETRIAL ADENOCARCINOMA |
|---|---|---|---|
| ALL | 350 | 18 | 79 |
| AMP PEAK 39(19P13.2) MUTATED | 24 | 7 | 38 |
| AMP PEAK 39(19P13.2) WILD-TYPE | 326 | 11 | 41 |
Figure S61. Get High-res Image Clustering Approach #39: 'Amp Peak 39(19p13.2) mutation analysis' versus Clinical Feature #3: 'HISTOLOGICAL.TYPE'

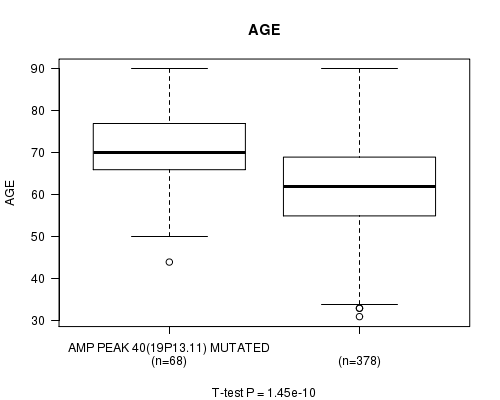
Table S101. Description of clustering approach #40: 'Amp Peak 40(19p13.11) mutation analysis'
| Cluster Labels | AMP PEAK 40(19P13.11) MUTATED | AMP PEAK 40(19P13.11) WILD-TYPE |
|---|---|---|
| Number of samples | 68 | 379 |
P value = 1.45e-10 (t-test), Q value = 6.2e-08
Table S102. Clustering Approach #40: 'Amp Peak 40(19p13.11) mutation analysis' versus Clinical Feature #2: 'AGE'
| nPatients | Mean (Std.Dev) | |
|---|---|---|
| ALL | 446 | 63.6 (11.3) |
| AMP PEAK 40(19P13.11) MUTATED | 68 | 71.0 (9.0) |
| AMP PEAK 40(19P13.11) WILD-TYPE | 378 | 62.2 (11.1) |
Figure S62. Get High-res Image Clustering Approach #40: 'Amp Peak 40(19p13.11) mutation analysis' versus Clinical Feature #2: 'AGE'
P value = 1.86e-19 (Fisher's exact test), Q value = 8.8e-17
Table S103. Clustering Approach #40: 'Amp Peak 40(19p13.11) mutation analysis' versus Clinical Feature #3: 'HISTOLOGICAL.TYPE'
| nPatients | ENDOMETRIOID ENDOMETRIAL ADENOCARCINOMA | MIXED SEROUS AND ENDOMETRIOID | SEROUS ENDOMETRIAL ADENOCARCINOMA |
|---|---|---|---|
| ALL | 350 | 18 | 79 |
| AMP PEAK 40(19P13.11) MUTATED | 22 | 6 | 40 |
| AMP PEAK 40(19P13.11) WILD-TYPE | 328 | 12 | 39 |
Figure S63. Get High-res Image Clustering Approach #40: 'Amp Peak 40(19p13.11) mutation analysis' versus Clinical Feature #3: 'HISTOLOGICAL.TYPE'

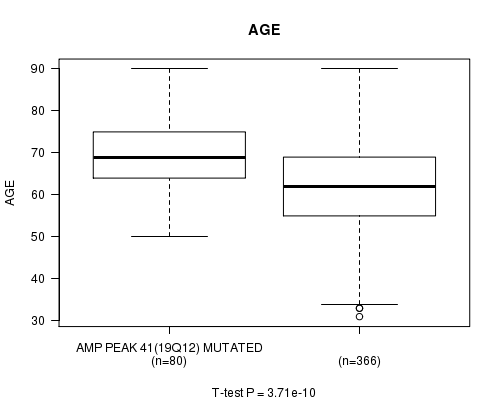
Table S104. Description of clustering approach #41: 'Amp Peak 41(19q12) mutation analysis'
| Cluster Labels | AMP PEAK 41(19Q12) MUTATED | AMP PEAK 41(19Q12) WILD-TYPE |
|---|---|---|
| Number of samples | 80 | 367 |
P value = 3.71e-10 (t-test), Q value = 1.6e-07
Table S105. Clustering Approach #41: 'Amp Peak 41(19q12) mutation analysis' versus Clinical Feature #2: 'AGE'
| nPatients | Mean (Std.Dev) | |
|---|---|---|
| ALL | 446 | 63.6 (11.3) |
| AMP PEAK 41(19Q12) MUTATED | 80 | 69.5 (8.1) |
| AMP PEAK 41(19Q12) WILD-TYPE | 366 | 62.3 (11.4) |
Figure S64. Get High-res Image Clustering Approach #41: 'Amp Peak 41(19q12) mutation analysis' versus Clinical Feature #2: 'AGE'
P value = 1.93e-34 (Fisher's exact test), Q value = 9.4e-32
Table S106. Clustering Approach #41: 'Amp Peak 41(19q12) mutation analysis' versus Clinical Feature #3: 'HISTOLOGICAL.TYPE'
| nPatients | ENDOMETRIOID ENDOMETRIAL ADENOCARCINOMA | MIXED SEROUS AND ENDOMETRIOID | SEROUS ENDOMETRIAL ADENOCARCINOMA |
|---|---|---|---|
| ALL | 350 | 18 | 79 |
| AMP PEAK 41(19Q12) MUTATED | 18 | 9 | 53 |
| AMP PEAK 41(19Q12) WILD-TYPE | 332 | 9 | 26 |
Figure S65. Get High-res Image Clustering Approach #41: 'Amp Peak 41(19q12) mutation analysis' versus Clinical Feature #3: 'HISTOLOGICAL.TYPE'
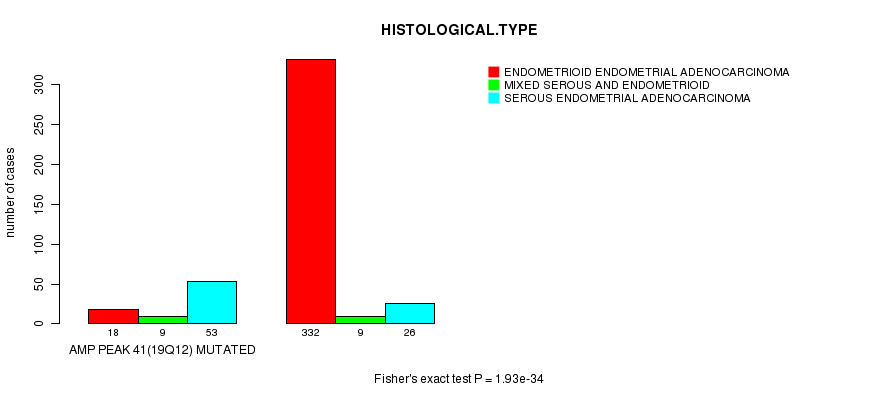
Table S107. Description of clustering approach #42: 'Amp Peak 42(20p13) mutation analysis'
| Cluster Labels | AMP PEAK 42(20P13) MUTATED | AMP PEAK 42(20P13) WILD-TYPE |
|---|---|---|
| Number of samples | 87 | 360 |
P value = 5.29e-05 (t-test), Q value = 0.019
Table S108. Clustering Approach #42: 'Amp Peak 42(20p13) mutation analysis' versus Clinical Feature #2: 'AGE'
| nPatients | Mean (Std.Dev) | |
|---|---|---|
| ALL | 446 | 63.6 (11.3) |
| AMP PEAK 42(20P13) MUTATED | 87 | 68.1 (11.2) |
| AMP PEAK 42(20P13) WILD-TYPE | 359 | 62.5 (11.0) |
Figure S66. Get High-res Image Clustering Approach #42: 'Amp Peak 42(20p13) mutation analysis' versus Clinical Feature #2: 'AGE'
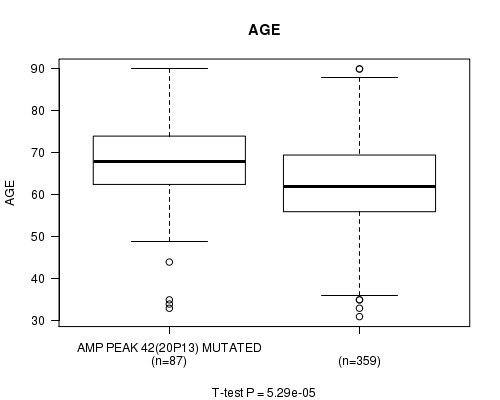
P value = 4.27e-12 (Fisher's exact test), Q value = 1.9e-09
Table S109. Clustering Approach #42: 'Amp Peak 42(20p13) mutation analysis' versus Clinical Feature #3: 'HISTOLOGICAL.TYPE'
| nPatients | ENDOMETRIOID ENDOMETRIAL ADENOCARCINOMA | MIXED SEROUS AND ENDOMETRIOID | SEROUS ENDOMETRIAL ADENOCARCINOMA |
|---|---|---|---|
| ALL | 350 | 18 | 79 |
| AMP PEAK 42(20P13) MUTATED | 43 | 4 | 40 |
| AMP PEAK 42(20P13) WILD-TYPE | 307 | 14 | 39 |
Figure S67. Get High-res Image Clustering Approach #42: 'Amp Peak 42(20p13) mutation analysis' versus Clinical Feature #3: 'HISTOLOGICAL.TYPE'

Table S110. Description of clustering approach #43: 'Amp Peak 43(20q11.21) mutation analysis'
| Cluster Labels | AMP PEAK 43(20Q11.21) MUTATED | AMP PEAK 43(20Q11.21) WILD-TYPE |
|---|---|---|
| Number of samples | 107 | 340 |
P value = 3.4e-07 (t-test), Q value = 0.00013
Table S111. Clustering Approach #43: 'Amp Peak 43(20q11.21) mutation analysis' versus Clinical Feature #2: 'AGE'
| nPatients | Mean (Std.Dev) | |
|---|---|---|
| ALL | 446 | 63.6 (11.3) |
| AMP PEAK 43(20Q11.21) MUTATED | 107 | 68.2 (10.0) |
| AMP PEAK 43(20Q11.21) WILD-TYPE | 339 | 62.1 (11.3) |
Figure S68. Get High-res Image Clustering Approach #43: 'Amp Peak 43(20q11.21) mutation analysis' versus Clinical Feature #2: 'AGE'
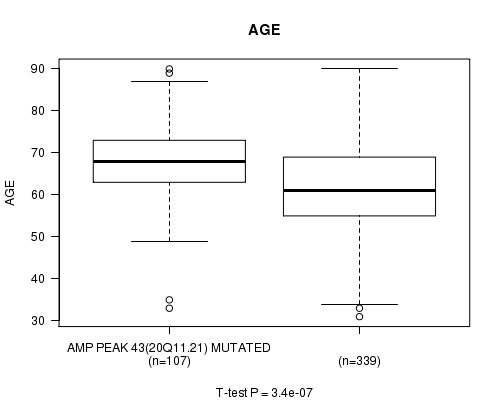
P value = 5.23e-24 (Fisher's exact test), Q value = 2.5e-21
Table S112. Clustering Approach #43: 'Amp Peak 43(20q11.21) mutation analysis' versus Clinical Feature #3: 'HISTOLOGICAL.TYPE'
| nPatients | ENDOMETRIOID ENDOMETRIAL ADENOCARCINOMA | MIXED SEROUS AND ENDOMETRIOID | SEROUS ENDOMETRIAL ADENOCARCINOMA |
|---|---|---|---|
| ALL | 350 | 18 | 79 |
| AMP PEAK 43(20Q11.21) MUTATED | 45 | 6 | 56 |
| AMP PEAK 43(20Q11.21) WILD-TYPE | 305 | 12 | 23 |
Figure S69. Get High-res Image Clustering Approach #43: 'Amp Peak 43(20q11.21) mutation analysis' versus Clinical Feature #3: 'HISTOLOGICAL.TYPE'
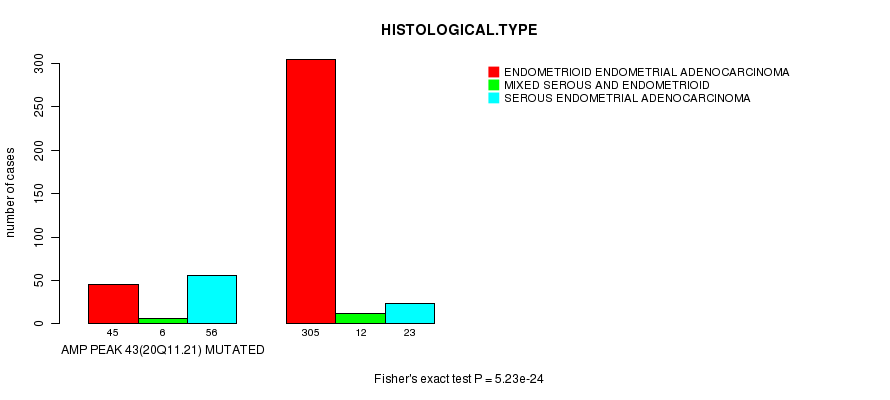
Table S113. Description of clustering approach #44: 'Amp Peak 44(20q13.12) mutation analysis'
| Cluster Labels | AMP PEAK 44(20Q13.12) MUTATED | AMP PEAK 44(20Q13.12) WILD-TYPE |
|---|---|---|
| Number of samples | 112 | 335 |
P value = 9.91e-08 (t-test), Q value = 4e-05
Table S114. Clustering Approach #44: 'Amp Peak 44(20q13.12) mutation analysis' versus Clinical Feature #2: 'AGE'
| nPatients | Mean (Std.Dev) | |
|---|---|---|
| ALL | 446 | 63.6 (11.3) |
| AMP PEAK 44(20Q13.12) MUTATED | 112 | 68.3 (10.3) |
| AMP PEAK 44(20Q13.12) WILD-TYPE | 334 | 62.0 (11.1) |
Figure S70. Get High-res Image Clustering Approach #44: 'Amp Peak 44(20q13.12) mutation analysis' versus Clinical Feature #2: 'AGE'

P value = 1.1e-20 (Fisher's exact test), Q value = 5.3e-18
Table S115. Clustering Approach #44: 'Amp Peak 44(20q13.12) mutation analysis' versus Clinical Feature #3: 'HISTOLOGICAL.TYPE'
| nPatients | ENDOMETRIOID ENDOMETRIAL ADENOCARCINOMA | MIXED SEROUS AND ENDOMETRIOID | SEROUS ENDOMETRIAL ADENOCARCINOMA |
|---|---|---|---|
| ALL | 350 | 18 | 79 |
| AMP PEAK 44(20Q13.12) MUTATED | 51 | 7 | 54 |
| AMP PEAK 44(20Q13.12) WILD-TYPE | 299 | 11 | 25 |
Figure S71. Get High-res Image Clustering Approach #44: 'Amp Peak 44(20q13.12) mutation analysis' versus Clinical Feature #3: 'HISTOLOGICAL.TYPE'
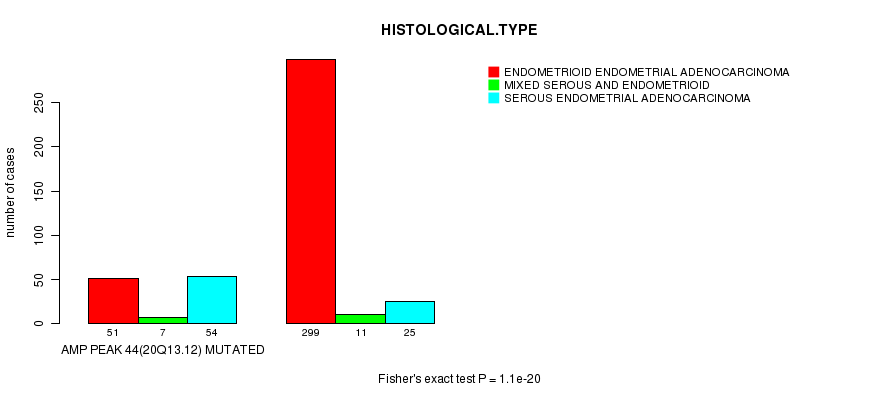
Table S116. Description of clustering approach #45: 'Amp Peak 45(20q13.33) mutation analysis'
| Cluster Labels | AMP PEAK 45(20Q13.33) MUTATED | AMP PEAK 45(20Q13.33) WILD-TYPE |
|---|---|---|
| Number of samples | 110 | 337 |
P value = 3.68e-07 (t-test), Q value = 0.00015
Table S117. Clustering Approach #45: 'Amp Peak 45(20q13.33) mutation analysis' versus Clinical Feature #2: 'AGE'
| nPatients | Mean (Std.Dev) | |
|---|---|---|
| ALL | 446 | 63.6 (11.3) |
| AMP PEAK 45(20Q13.33) MUTATED | 110 | 68.2 (10.5) |
| AMP PEAK 45(20Q13.33) WILD-TYPE | 336 | 62.1 (11.1) |
Figure S72. Get High-res Image Clustering Approach #45: 'Amp Peak 45(20q13.33) mutation analysis' versus Clinical Feature #2: 'AGE'
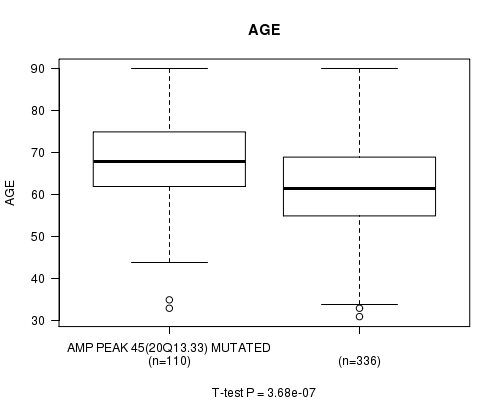
P value = 1.61e-16 (Fisher's exact test), Q value = 7.5e-14
Table S118. Clustering Approach #45: 'Amp Peak 45(20q13.33) mutation analysis' versus Clinical Feature #3: 'HISTOLOGICAL.TYPE'
| nPatients | ENDOMETRIOID ENDOMETRIAL ADENOCARCINOMA | MIXED SEROUS AND ENDOMETRIOID | SEROUS ENDOMETRIAL ADENOCARCINOMA |
|---|---|---|---|
| ALL | 350 | 18 | 79 |
| AMP PEAK 45(20Q13.33) MUTATED | 54 | 6 | 50 |
| AMP PEAK 45(20Q13.33) WILD-TYPE | 296 | 12 | 29 |
Figure S73. Get High-res Image Clustering Approach #45: 'Amp Peak 45(20q13.33) mutation analysis' versus Clinical Feature #3: 'HISTOLOGICAL.TYPE'
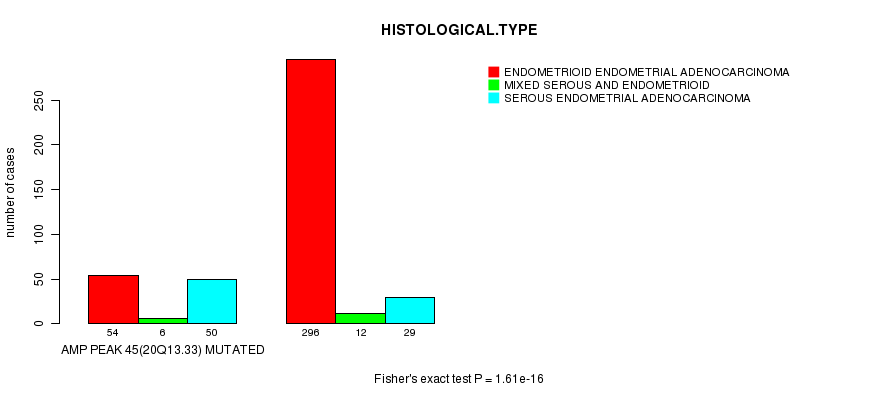
Table S119. Description of clustering approach #46: 'Amp Peak 46(22q12.2) mutation analysis'
| Cluster Labels | AMP PEAK 46(22Q12.2) MUTATED | AMP PEAK 46(22Q12.2) WILD-TYPE |
|---|---|---|
| Number of samples | 43 | 404 |
P value = 5.75e-17 (Fisher's exact test), Q value = 2.7e-14
Table S120. Clustering Approach #46: 'Amp Peak 46(22q12.2) mutation analysis' versus Clinical Feature #3: 'HISTOLOGICAL.TYPE'
| nPatients | ENDOMETRIOID ENDOMETRIAL ADENOCARCINOMA | MIXED SEROUS AND ENDOMETRIOID | SEROUS ENDOMETRIAL ADENOCARCINOMA |
|---|---|---|---|
| ALL | 350 | 18 | 79 |
| AMP PEAK 46(22Q12.2) MUTATED | 10 | 2 | 31 |
| AMP PEAK 46(22Q12.2) WILD-TYPE | 340 | 16 | 48 |
Figure S74. Get High-res Image Clustering Approach #46: 'Amp Peak 46(22q12.2) mutation analysis' versus Clinical Feature #3: 'HISTOLOGICAL.TYPE'
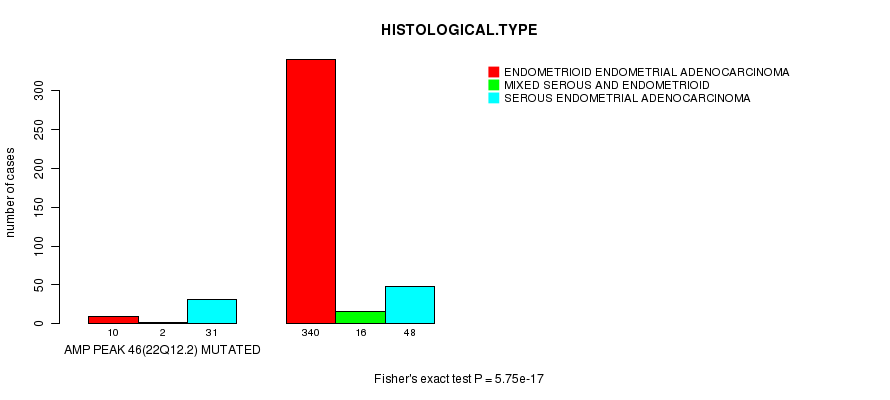
P value = 0.000227 (Fisher's exact test), Q value = 0.08
Table S121. Clustering Approach #46: 'Amp Peak 46(22q12.2) mutation analysis' versus Clinical Feature #5: 'COMPLETENESS.OF.RESECTION'
| nPatients | R0 | R1 | R2 | RX |
|---|---|---|---|---|
| ALL | 307 | 24 | 15 | 24 |
| AMP PEAK 46(22Q12.2) MUTATED | 23 | 2 | 7 | 4 |
| AMP PEAK 46(22Q12.2) WILD-TYPE | 284 | 22 | 8 | 20 |
Figure S75. Get High-res Image Clustering Approach #46: 'Amp Peak 46(22q12.2) mutation analysis' versus Clinical Feature #5: 'COMPLETENESS.OF.RESECTION'
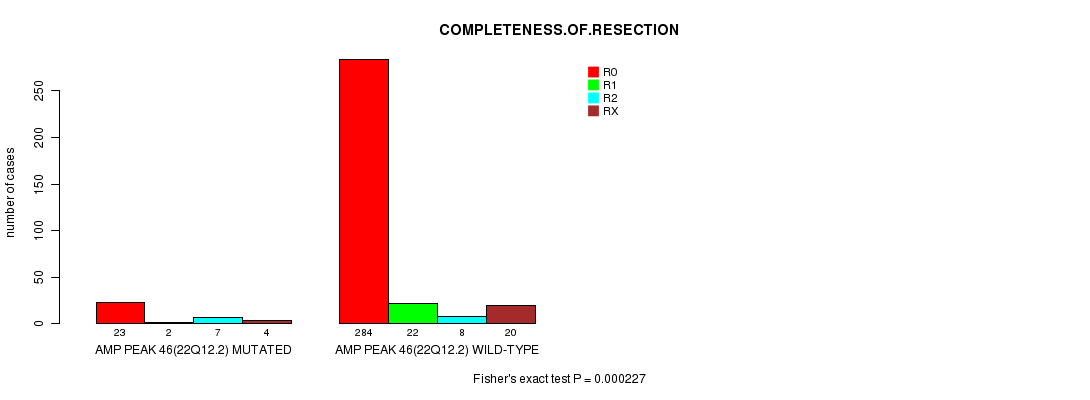
Table S122. Description of clustering approach #47: 'Amp Peak 47(Xp11.23) mutation analysis'
| Cluster Labels | AMP PEAK 47(XP11.23) MUTATED | AMP PEAK 47(XP11.23) WILD-TYPE |
|---|---|---|
| Number of samples | 72 | 375 |
Table S123. Description of clustering approach #48: 'Amp Peak 48(Xq28) mutation analysis'
| Cluster Labels | AMP PEAK 48(XQ28) MUTATED | AMP PEAK 48(XQ28) WILD-TYPE |
|---|---|---|
| Number of samples | 72 | 375 |
Table S124. Description of clustering approach #49: 'Del Peak 1(1p36.21) mutation analysis'
| Cluster Labels | DEL PEAK 1(1P36.21) MUTATED | DEL PEAK 1(1P36.21) WILD-TYPE |
|---|---|---|
| Number of samples | 54 | 393 |
P value = 3.28e-05 (t-test), Q value = 0.012
Table S125. Clustering Approach #49: 'Del Peak 1(1p36.21) mutation analysis' versus Clinical Feature #2: 'AGE'
| nPatients | Mean (Std.Dev) | |
|---|---|---|
| ALL | 446 | 63.6 (11.3) |
| DEL PEAK 1(1P36.21) MUTATED | 54 | 69.5 (10.3) |
| DEL PEAK 1(1P36.21) WILD-TYPE | 392 | 62.8 (11.1) |
Figure S76. Get High-res Image Clustering Approach #49: 'Del Peak 1(1p36.21) mutation analysis' versus Clinical Feature #2: 'AGE'
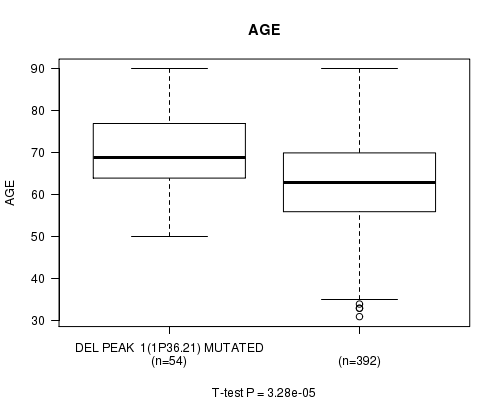
P value = 1.05e-08 (Fisher's exact test), Q value = 4.4e-06
Table S126. Clustering Approach #49: 'Del Peak 1(1p36.21) mutation analysis' versus Clinical Feature #3: 'HISTOLOGICAL.TYPE'
| nPatients | ENDOMETRIOID ENDOMETRIAL ADENOCARCINOMA | MIXED SEROUS AND ENDOMETRIOID | SEROUS ENDOMETRIAL ADENOCARCINOMA |
|---|---|---|---|
| ALL | 350 | 18 | 79 |
| DEL PEAK 1(1P36.21) MUTATED | 24 | 4 | 26 |
| DEL PEAK 1(1P36.21) WILD-TYPE | 326 | 14 | 53 |
Figure S77. Get High-res Image Clustering Approach #49: 'Del Peak 1(1p36.21) mutation analysis' versus Clinical Feature #3: 'HISTOLOGICAL.TYPE'

Table S127. Description of clustering approach #50: 'Del Peak 2(1p36.11) mutation analysis'
| Cluster Labels | DEL PEAK 2(1P36.11) MUTATED | DEL PEAK 2(1P36.11) WILD-TYPE |
|---|---|---|
| Number of samples | 59 | 388 |
P value = 3.68e-05 (t-test), Q value = 0.013
Table S128. Clustering Approach #50: 'Del Peak 2(1p36.11) mutation analysis' versus Clinical Feature #2: 'AGE'
| nPatients | Mean (Std.Dev) | |
|---|---|---|
| ALL | 446 | 63.6 (11.3) |
| DEL PEAK 2(1P36.11) MUTATED | 59 | 68.8 (9.7) |
| DEL PEAK 2(1P36.11) WILD-TYPE | 387 | 62.8 (11.3) |
Figure S78. Get High-res Image Clustering Approach #50: 'Del Peak 2(1p36.11) mutation analysis' versus Clinical Feature #2: 'AGE'

P value = 1.23e-11 (Fisher's exact test), Q value = 5.4e-09
Table S129. Clustering Approach #50: 'Del Peak 2(1p36.11) mutation analysis' versus Clinical Feature #3: 'HISTOLOGICAL.TYPE'
| nPatients | ENDOMETRIOID ENDOMETRIAL ADENOCARCINOMA | MIXED SEROUS AND ENDOMETRIOID | SEROUS ENDOMETRIAL ADENOCARCINOMA |
|---|---|---|---|
| ALL | 350 | 18 | 79 |
| DEL PEAK 2(1P36.11) MUTATED | 24 | 4 | 31 |
| DEL PEAK 2(1P36.11) WILD-TYPE | 326 | 14 | 48 |
Figure S79. Get High-res Image Clustering Approach #50: 'Del Peak 2(1p36.11) mutation analysis' versus Clinical Feature #3: 'HISTOLOGICAL.TYPE'

Table S130. Description of clustering approach #51: 'Del Peak 3(1q43) mutation analysis'
| Cluster Labels | DEL PEAK 3(1Q43) MUTATED | DEL PEAK 3(1Q43) WILD-TYPE |
|---|---|---|
| Number of samples | 7 | 440 |
Table S131. Description of clustering approach #52: 'Del Peak 4(2p25.3) mutation analysis'
| Cluster Labels | DEL PEAK 4(2P25.3) MUTATED | DEL PEAK 4(2P25.3) WILD-TYPE |
|---|---|---|
| Number of samples | 22 | 425 |
Table S132. Description of clustering approach #53: 'Del Peak 5(2q22.1) mutation analysis'
| Cluster Labels | DEL PEAK 5(2Q22.1) MUTATED | DEL PEAK 5(2Q22.1) WILD-TYPE |
|---|---|---|
| Number of samples | 34 | 413 |
P value = 9.57e-09 (logrank test), Q value = 4e-06
Table S133. Clustering Approach #53: 'Del Peak 5(2q22.1) mutation analysis' versus Clinical Feature #1: 'Time to Death'
| nPatients | nDeath | Duration Range (Median), Month | |
|---|---|---|---|
| ALL | 442 | 41 | 0.0 - 187.1 (15.9) |
| DEL PEAK 5(2Q22.1) MUTATED | 34 | 10 | 0.1 - 113.2 (7.9) |
| DEL PEAK 5(2Q22.1) WILD-TYPE | 408 | 31 | 0.0 - 187.1 (16.7) |
Figure S80. Get High-res Image Clustering Approach #53: 'Del Peak 5(2q22.1) mutation analysis' versus Clinical Feature #1: 'Time to Death'
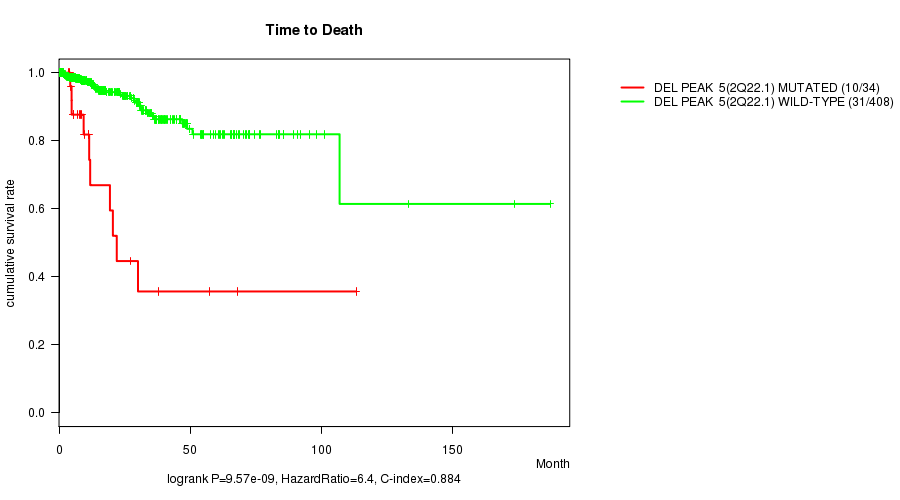
P value = 2.41e-05 (Fisher's exact test), Q value = 0.009
Table S134. Clustering Approach #53: 'Del Peak 5(2q22.1) mutation analysis' versus Clinical Feature #3: 'HISTOLOGICAL.TYPE'
| nPatients | ENDOMETRIOID ENDOMETRIAL ADENOCARCINOMA | MIXED SEROUS AND ENDOMETRIOID | SEROUS ENDOMETRIAL ADENOCARCINOMA |
|---|---|---|---|
| ALL | 350 | 18 | 79 |
| DEL PEAK 5(2Q22.1) MUTATED | 16 | 1 | 17 |
| DEL PEAK 5(2Q22.1) WILD-TYPE | 334 | 17 | 62 |
Figure S81. Get High-res Image Clustering Approach #53: 'Del Peak 5(2q22.1) mutation analysis' versus Clinical Feature #3: 'HISTOLOGICAL.TYPE'

Table S135. Description of clustering approach #54: 'Del Peak 6(2q37.3) mutation analysis'
| Cluster Labels | DEL PEAK 6(2Q37.3) MUTATED | DEL PEAK 6(2Q37.3) WILD-TYPE |
|---|---|---|
| Number of samples | 40 | 407 |
Table S136. Description of clustering approach #55: 'Del Peak 7(3p14.2) mutation analysis'
| Cluster Labels | DEL PEAK 7(3P14.2) MUTATED | DEL PEAK 7(3P14.2) WILD-TYPE |
|---|---|---|
| Number of samples | 57 | 390 |
P value = 7.54e-05 (t-test), Q value = 0.027
Table S137. Clustering Approach #55: 'Del Peak 7(3p14.2) mutation analysis' versus Clinical Feature #2: 'AGE'
| nPatients | Mean (Std.Dev) | |
|---|---|---|
| ALL | 446 | 63.6 (11.3) |
| DEL PEAK 7(3P14.2) MUTATED | 57 | 67.6 (7.2) |
| DEL PEAK 7(3P14.2) WILD-TYPE | 389 | 63.0 (11.6) |
Figure S82. Get High-res Image Clustering Approach #55: 'Del Peak 7(3p14.2) mutation analysis' versus Clinical Feature #2: 'AGE'
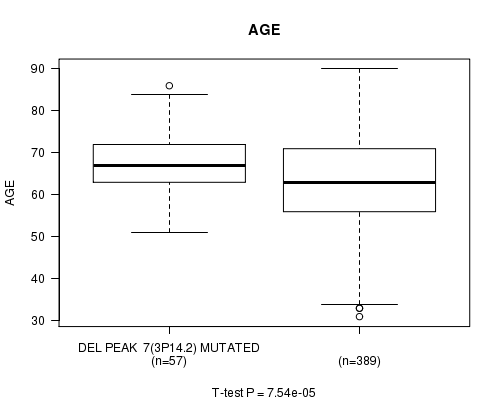
P value = 6.23e-15 (Fisher's exact test), Q value = 2.8e-12
Table S138. Clustering Approach #55: 'Del Peak 7(3p14.2) mutation analysis' versus Clinical Feature #3: 'HISTOLOGICAL.TYPE'
| nPatients | ENDOMETRIOID ENDOMETRIAL ADENOCARCINOMA | MIXED SEROUS AND ENDOMETRIOID | SEROUS ENDOMETRIAL ADENOCARCINOMA |
|---|---|---|---|
| ALL | 350 | 18 | 79 |
| DEL PEAK 7(3P14.2) MUTATED | 19 | 6 | 32 |
| DEL PEAK 7(3P14.2) WILD-TYPE | 331 | 12 | 47 |
Figure S83. Get High-res Image Clustering Approach #55: 'Del Peak 7(3p14.2) mutation analysis' versus Clinical Feature #3: 'HISTOLOGICAL.TYPE'
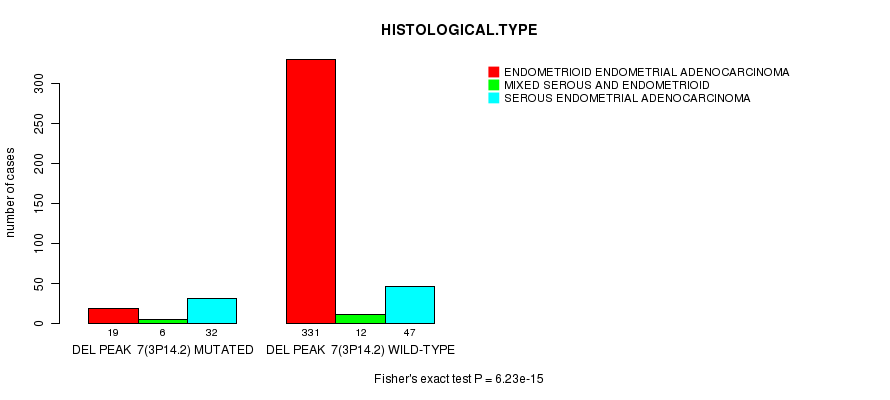
Table S139. Description of clustering approach #56: 'Del Peak 8(3q13.31) mutation analysis'
| Cluster Labels | DEL PEAK 8(3Q13.31) MUTATED | DEL PEAK 8(3Q13.31) WILD-TYPE |
|---|---|---|
| Number of samples | 21 | 426 |
P value = 6.98e-06 (Fisher's exact test), Q value = 0.0027
Table S140. Clustering Approach #56: 'Del Peak 8(3q13.31) mutation analysis' versus Clinical Feature #3: 'HISTOLOGICAL.TYPE'
| nPatients | ENDOMETRIOID ENDOMETRIAL ADENOCARCINOMA | MIXED SEROUS AND ENDOMETRIOID | SEROUS ENDOMETRIAL ADENOCARCINOMA |
|---|---|---|---|
| ALL | 350 | 18 | 79 |
| DEL PEAK 8(3Q13.31) MUTATED | 7 | 1 | 13 |
| DEL PEAK 8(3Q13.31) WILD-TYPE | 343 | 17 | 66 |
Figure S84. Get High-res Image Clustering Approach #56: 'Del Peak 8(3q13.31) mutation analysis' versus Clinical Feature #3: 'HISTOLOGICAL.TYPE'

Table S141. Description of clustering approach #57: 'Del Peak 9(4p16.3) mutation analysis'
| Cluster Labels | DEL PEAK 9(4P16.3) MUTATED | DEL PEAK 9(4P16.3) WILD-TYPE |
|---|---|---|
| Number of samples | 66 | 381 |
P value = 0.000139 (t-test), Q value = 0.049
Table S142. Clustering Approach #57: 'Del Peak 9(4p16.3) mutation analysis' versus Clinical Feature #2: 'AGE'
| nPatients | Mean (Std.Dev) | |
|---|---|---|
| ALL | 446 | 63.6 (11.3) |
| DEL PEAK 9(4P16.3) MUTATED | 66 | 67.9 (9.2) |
| DEL PEAK 9(4P16.3) WILD-TYPE | 380 | 62.8 (11.4) |
Figure S85. Get High-res Image Clustering Approach #57: 'Del Peak 9(4p16.3) mutation analysis' versus Clinical Feature #2: 'AGE'

P value = 2.78e-13 (Fisher's exact test), Q value = 1.2e-10
Table S143. Clustering Approach #57: 'Del Peak 9(4p16.3) mutation analysis' versus Clinical Feature #3: 'HISTOLOGICAL.TYPE'
| nPatients | ENDOMETRIOID ENDOMETRIAL ADENOCARCINOMA | MIXED SEROUS AND ENDOMETRIOID | SEROUS ENDOMETRIAL ADENOCARCINOMA |
|---|---|---|---|
| ALL | 350 | 18 | 79 |
| DEL PEAK 9(4P16.3) MUTATED | 27 | 4 | 35 |
| DEL PEAK 9(4P16.3) WILD-TYPE | 323 | 14 | 44 |
Figure S86. Get High-res Image Clustering Approach #57: 'Del Peak 9(4p16.3) mutation analysis' versus Clinical Feature #3: 'HISTOLOGICAL.TYPE'
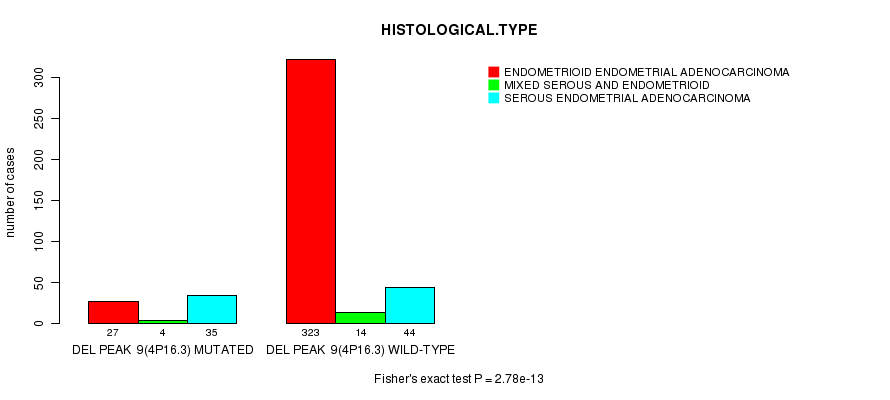
Table S144. Description of clustering approach #58: 'Del Peak 10(4p15.31) mutation analysis'
| Cluster Labels | DEL PEAK 10(4P15.31) MUTATED | DEL PEAK 10(4P15.31) WILD-TYPE |
|---|---|---|
| Number of samples | 66 | 381 |
P value = 8.27e-05 (t-test), Q value = 0.03
Table S145. Clustering Approach #58: 'Del Peak 10(4p15.31) mutation analysis' versus Clinical Feature #2: 'AGE'
| nPatients | Mean (Std.Dev) | |
|---|---|---|
| ALL | 446 | 63.6 (11.3) |
| DEL PEAK 10(4P15.31) MUTATED | 66 | 68.1 (9.5) |
| DEL PEAK 10(4P15.31) WILD-TYPE | 380 | 62.8 (11.4) |
Figure S87. Get High-res Image Clustering Approach #58: 'Del Peak 10(4p15.31) mutation analysis' versus Clinical Feature #2: 'AGE'
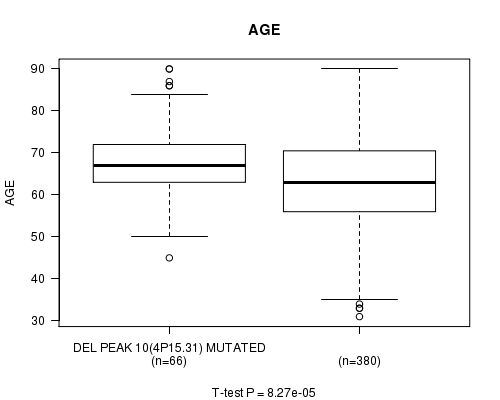
P value = 7.92e-12 (Fisher's exact test), Q value = 3.5e-09
Table S146. Clustering Approach #58: 'Del Peak 10(4p15.31) mutation analysis' versus Clinical Feature #3: 'HISTOLOGICAL.TYPE'
| nPatients | ENDOMETRIOID ENDOMETRIAL ADENOCARCINOMA | MIXED SEROUS AND ENDOMETRIOID | SEROUS ENDOMETRIAL ADENOCARCINOMA |
|---|---|---|---|
| ALL | 350 | 18 | 79 |
| DEL PEAK 10(4P15.31) MUTATED | 29 | 3 | 34 |
| DEL PEAK 10(4P15.31) WILD-TYPE | 321 | 15 | 45 |
Figure S88. Get High-res Image Clustering Approach #58: 'Del Peak 10(4p15.31) mutation analysis' versus Clinical Feature #3: 'HISTOLOGICAL.TYPE'

Table S147. Description of clustering approach #59: 'Del Peak 11(4q22.1) mutation analysis'
| Cluster Labels | DEL PEAK 11(4Q22.1) MUTATED | DEL PEAK 11(4Q22.1) WILD-TYPE |
|---|---|---|
| Number of samples | 76 | 371 |
P value = 1.58e-05 (t-test), Q value = 0.006
Table S148. Clustering Approach #59: 'Del Peak 11(4q22.1) mutation analysis' versus Clinical Feature #2: 'AGE'
| nPatients | Mean (Std.Dev) | |
|---|---|---|
| ALL | 446 | 63.6 (11.3) |
| DEL PEAK 11(4Q22.1) MUTATED | 76 | 68.1 (9.2) |
| DEL PEAK 11(4Q22.1) WILD-TYPE | 370 | 62.6 (11.4) |
Figure S89. Get High-res Image Clustering Approach #59: 'Del Peak 11(4q22.1) mutation analysis' versus Clinical Feature #2: 'AGE'

P value = 1.33e-22 (Fisher's exact test), Q value = 6.4e-20
Table S149. Clustering Approach #59: 'Del Peak 11(4q22.1) mutation analysis' versus Clinical Feature #3: 'HISTOLOGICAL.TYPE'
| nPatients | ENDOMETRIOID ENDOMETRIAL ADENOCARCINOMA | MIXED SEROUS AND ENDOMETRIOID | SEROUS ENDOMETRIAL ADENOCARCINOMA |
|---|---|---|---|
| ALL | 350 | 18 | 79 |
| DEL PEAK 11(4Q22.1) MUTATED | 25 | 5 | 46 |
| DEL PEAK 11(4Q22.1) WILD-TYPE | 325 | 13 | 33 |
Figure S90. Get High-res Image Clustering Approach #59: 'Del Peak 11(4q22.1) mutation analysis' versus Clinical Feature #3: 'HISTOLOGICAL.TYPE'

Table S150. Description of clustering approach #60: 'Del Peak 12(4q34.3) mutation analysis'
| Cluster Labels | DEL PEAK 12(4Q34.3) MUTATED | DEL PEAK 12(4Q34.3) WILD-TYPE |
|---|---|---|
| Number of samples | 91 | 356 |
P value = 1.14e-05 (t-test), Q value = 0.0043
Table S151. Clustering Approach #60: 'Del Peak 12(4q34.3) mutation analysis' versus Clinical Feature #2: 'AGE'
| nPatients | Mean (Std.Dev) | |
|---|---|---|
| ALL | 446 | 63.6 (11.3) |
| DEL PEAK 12(4Q34.3) MUTATED | 91 | 67.9 (10.0) |
| DEL PEAK 12(4Q34.3) WILD-TYPE | 355 | 62.5 (11.3) |
Figure S91. Get High-res Image Clustering Approach #60: 'Del Peak 12(4q34.3) mutation analysis' versus Clinical Feature #2: 'AGE'

P value = 2.59e-22 (Fisher's exact test), Q value = 1.2e-19
Table S152. Clustering Approach #60: 'Del Peak 12(4q34.3) mutation analysis' versus Clinical Feature #3: 'HISTOLOGICAL.TYPE'
| nPatients | ENDOMETRIOID ENDOMETRIAL ADENOCARCINOMA | MIXED SEROUS AND ENDOMETRIOID | SEROUS ENDOMETRIAL ADENOCARCINOMA |
|---|---|---|---|
| ALL | 350 | 18 | 79 |
| DEL PEAK 12(4Q34.3) MUTATED | 35 | 6 | 50 |
| DEL PEAK 12(4Q34.3) WILD-TYPE | 315 | 12 | 29 |
Figure S92. Get High-res Image Clustering Approach #60: 'Del Peak 12(4q34.3) mutation analysis' versus Clinical Feature #3: 'HISTOLOGICAL.TYPE'
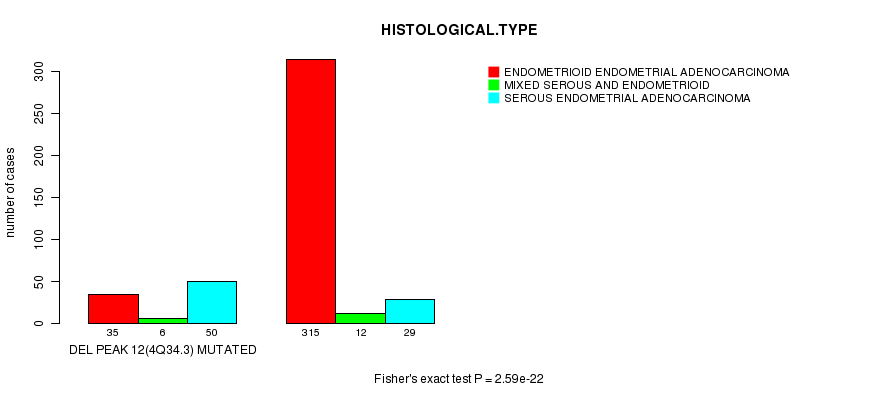
Table S153. Description of clustering approach #61: 'Del Peak 13(5q11.2) mutation analysis'
| Cluster Labels | DEL PEAK 13(5Q11.2) MUTATED | DEL PEAK 13(5Q11.2) WILD-TYPE |
|---|---|---|
| Number of samples | 78 | 369 |
P value = 6.49e-05 (t-test), Q value = 0.024
Table S154. Clustering Approach #61: 'Del Peak 13(5q11.2) mutation analysis' versus Clinical Feature #2: 'AGE'
| nPatients | Mean (Std.Dev) | |
|---|---|---|
| ALL | 446 | 63.6 (11.3) |
| DEL PEAK 13(5Q11.2) MUTATED | 78 | 67.9 (9.8) |
| DEL PEAK 13(5Q11.2) WILD-TYPE | 368 | 62.7 (11.3) |
Figure S93. Get High-res Image Clustering Approach #61: 'Del Peak 13(5q11.2) mutation analysis' versus Clinical Feature #2: 'AGE'

P value = 1.47e-21 (Fisher's exact test), Q value = 7e-19
Table S155. Clustering Approach #61: 'Del Peak 13(5q11.2) mutation analysis' versus Clinical Feature #3: 'HISTOLOGICAL.TYPE'
| nPatients | ENDOMETRIOID ENDOMETRIAL ADENOCARCINOMA | MIXED SEROUS AND ENDOMETRIOID | SEROUS ENDOMETRIAL ADENOCARCINOMA |
|---|---|---|---|
| ALL | 350 | 18 | 79 |
| DEL PEAK 13(5Q11.2) MUTATED | 29 | 2 | 47 |
| DEL PEAK 13(5Q11.2) WILD-TYPE | 321 | 16 | 32 |
Figure S94. Get High-res Image Clustering Approach #61: 'Del Peak 13(5q11.2) mutation analysis' versus Clinical Feature #3: 'HISTOLOGICAL.TYPE'

Table S156. Description of clustering approach #62: 'Del Peak 14(6q26) mutation analysis'
| Cluster Labels | DEL PEAK 14(6Q26) MUTATED | DEL PEAK 14(6Q26) WILD-TYPE |
|---|---|---|
| Number of samples | 35 | 412 |
P value = 1.05e-08 (Fisher's exact test), Q value = 4.4e-06
Table S157. Clustering Approach #62: 'Del Peak 14(6q26) mutation analysis' versus Clinical Feature #3: 'HISTOLOGICAL.TYPE'
| nPatients | ENDOMETRIOID ENDOMETRIAL ADENOCARCINOMA | MIXED SEROUS AND ENDOMETRIOID | SEROUS ENDOMETRIAL ADENOCARCINOMA |
|---|---|---|---|
| ALL | 350 | 18 | 79 |
| DEL PEAK 14(6Q26) MUTATED | 12 | 3 | 20 |
| DEL PEAK 14(6Q26) WILD-TYPE | 338 | 15 | 59 |
Figure S95. Get High-res Image Clustering Approach #62: 'Del Peak 14(6q26) mutation analysis' versus Clinical Feature #3: 'HISTOLOGICAL.TYPE'

Table S158. Description of clustering approach #63: 'Del Peak 15(7p22.3) mutation analysis'
| Cluster Labels | DEL PEAK 15(7P22.3) MUTATED | DEL PEAK 15(7P22.3) WILD-TYPE |
|---|---|---|
| Number of samples | 58 | 389 |
P value = 2.51e-05 (t-test), Q value = 0.0093
Table S159. Clustering Approach #63: 'Del Peak 15(7p22.3) mutation analysis' versus Clinical Feature #2: 'AGE'
| nPatients | Mean (Std.Dev) | |
|---|---|---|
| ALL | 446 | 63.6 (11.3) |
| DEL PEAK 15(7P22.3) MUTATED | 57 | 68.9 (9.5) |
| DEL PEAK 15(7P22.3) WILD-TYPE | 389 | 62.8 (11.3) |
Figure S96. Get High-res Image Clustering Approach #63: 'Del Peak 15(7p22.3) mutation analysis' versus Clinical Feature #2: 'AGE'

P value = 1.1e-13 (Fisher's exact test), Q value = 4.9e-11
Table S160. Clustering Approach #63: 'Del Peak 15(7p22.3) mutation analysis' versus Clinical Feature #3: 'HISTOLOGICAL.TYPE'
| nPatients | ENDOMETRIOID ENDOMETRIAL ADENOCARCINOMA | MIXED SEROUS AND ENDOMETRIOID | SEROUS ENDOMETRIAL ADENOCARCINOMA |
|---|---|---|---|
| ALL | 350 | 18 | 79 |
| DEL PEAK 15(7P22.3) MUTATED | 21 | 5 | 32 |
| DEL PEAK 15(7P22.3) WILD-TYPE | 329 | 13 | 47 |
Figure S97. Get High-res Image Clustering Approach #63: 'Del Peak 15(7p22.3) mutation analysis' versus Clinical Feature #3: 'HISTOLOGICAL.TYPE'

Table S161. Description of clustering approach #64: 'Del Peak 16(7q11.22) mutation analysis'
| Cluster Labels | DEL PEAK 16(7Q11.22) MUTATED | DEL PEAK 16(7Q11.22) WILD-TYPE |
|---|---|---|
| Number of samples | 31 | 416 |
P value = 2.09e-05 (t-test), Q value = 0.0078
Table S162. Clustering Approach #64: 'Del Peak 16(7q11.22) mutation analysis' versus Clinical Feature #2: 'AGE'
| nPatients | Mean (Std.Dev) | |
|---|---|---|
| ALL | 446 | 63.6 (11.3) |
| DEL PEAK 16(7Q11.22) MUTATED | 31 | 71.0 (8.6) |
| DEL PEAK 16(7Q11.22) WILD-TYPE | 415 | 63.0 (11.2) |
Figure S98. Get High-res Image Clustering Approach #64: 'Del Peak 16(7q11.22) mutation analysis' versus Clinical Feature #2: 'AGE'
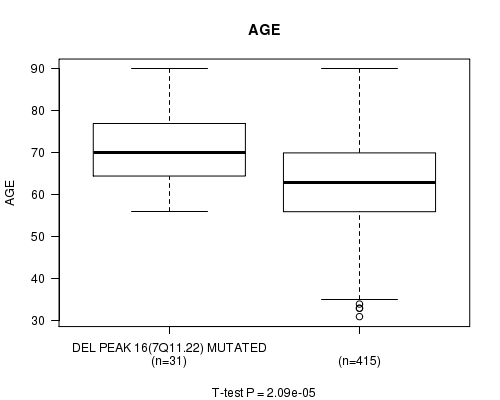
P value = 9.54e-08 (Fisher's exact test), Q value = 3.9e-05
Table S163. Clustering Approach #64: 'Del Peak 16(7q11.22) mutation analysis' versus Clinical Feature #3: 'HISTOLOGICAL.TYPE'
| nPatients | ENDOMETRIOID ENDOMETRIAL ADENOCARCINOMA | MIXED SEROUS AND ENDOMETRIOID | SEROUS ENDOMETRIAL ADENOCARCINOMA |
|---|---|---|---|
| ALL | 350 | 18 | 79 |
| DEL PEAK 16(7Q11.22) MUTATED | 11 | 2 | 18 |
| DEL PEAK 16(7Q11.22) WILD-TYPE | 339 | 16 | 61 |
Figure S99. Get High-res Image Clustering Approach #64: 'Del Peak 16(7q11.22) mutation analysis' versus Clinical Feature #3: 'HISTOLOGICAL.TYPE'

Table S164. Description of clustering approach #65: 'Del Peak 17(7q31.1) mutation analysis'
| Cluster Labels | DEL PEAK 17(7Q31.1) MUTATED | DEL PEAK 17(7Q31.1) WILD-TYPE |
|---|---|---|
| Number of samples | 39 | 408 |
P value = 3.68e-06 (t-test), Q value = 0.0014
Table S165. Clustering Approach #65: 'Del Peak 17(7q31.1) mutation analysis' versus Clinical Feature #2: 'AGE'
| nPatients | Mean (Std.Dev) | |
|---|---|---|
| ALL | 446 | 63.6 (11.3) |
| DEL PEAK 17(7Q31.1) MUTATED | 39 | 69.9 (7.6) |
| DEL PEAK 17(7Q31.1) WILD-TYPE | 407 | 63.0 (11.4) |
Figure S100. Get High-res Image Clustering Approach #65: 'Del Peak 17(7q31.1) mutation analysis' versus Clinical Feature #2: 'AGE'
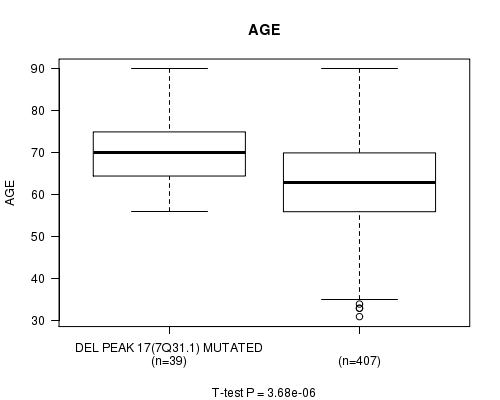
P value = 4.18e-16 (Fisher's exact test), Q value = 1.9e-13
Table S166. Clustering Approach #65: 'Del Peak 17(7q31.1) mutation analysis' versus Clinical Feature #3: 'HISTOLOGICAL.TYPE'
| nPatients | ENDOMETRIOID ENDOMETRIAL ADENOCARCINOMA | MIXED SEROUS AND ENDOMETRIOID | SEROUS ENDOMETRIAL ADENOCARCINOMA |
|---|---|---|---|
| ALL | 350 | 18 | 79 |
| DEL PEAK 17(7Q31.1) MUTATED | 8 | 3 | 28 |
| DEL PEAK 17(7Q31.1) WILD-TYPE | 342 | 15 | 51 |
Figure S101. Get High-res Image Clustering Approach #65: 'Del Peak 17(7q31.1) mutation analysis' versus Clinical Feature #3: 'HISTOLOGICAL.TYPE'
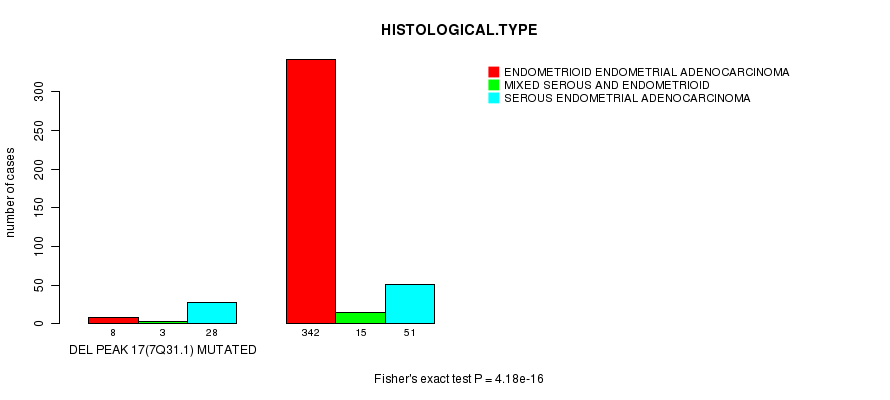
Table S167. Description of clustering approach #66: 'Del Peak 18(7q36.3) mutation analysis'
| Cluster Labels | DEL PEAK 18(7Q36.3) MUTATED | DEL PEAK 18(7Q36.3) WILD-TYPE |
|---|---|---|
| Number of samples | 49 | 398 |
P value = 4.14e-08 (t-test), Q value = 1.7e-05
Table S168. Clustering Approach #66: 'Del Peak 18(7q36.3) mutation analysis' versus Clinical Feature #2: 'AGE'
| nPatients | Mean (Std.Dev) | |
|---|---|---|
| ALL | 446 | 63.6 (11.3) |
| DEL PEAK 18(7Q36.3) MUTATED | 49 | 70.8 (8.4) |
| DEL PEAK 18(7Q36.3) WILD-TYPE | 397 | 62.7 (11.3) |
Figure S102. Get High-res Image Clustering Approach #66: 'Del Peak 18(7q36.3) mutation analysis' versus Clinical Feature #2: 'AGE'
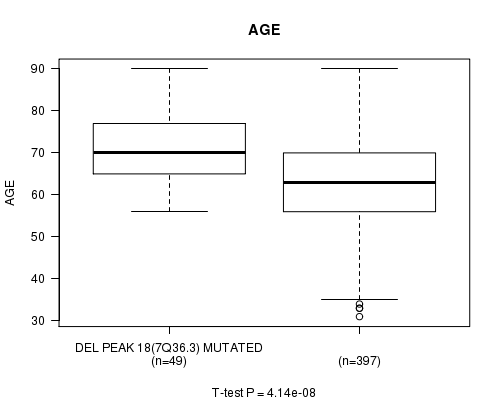
P value = 2.21e-16 (Fisher's exact test), Q value = 1e-13
Table S169. Clustering Approach #66: 'Del Peak 18(7q36.3) mutation analysis' versus Clinical Feature #3: 'HISTOLOGICAL.TYPE'
| nPatients | ENDOMETRIOID ENDOMETRIAL ADENOCARCINOMA | MIXED SEROUS AND ENDOMETRIOID | SEROUS ENDOMETRIAL ADENOCARCINOMA |
|---|---|---|---|
| ALL | 350 | 18 | 79 |
| DEL PEAK 18(7Q36.3) MUTATED | 13 | 5 | 31 |
| DEL PEAK 18(7Q36.3) WILD-TYPE | 337 | 13 | 48 |
Figure S103. Get High-res Image Clustering Approach #66: 'Del Peak 18(7q36.3) mutation analysis' versus Clinical Feature #3: 'HISTOLOGICAL.TYPE'

Table S170. Description of clustering approach #67: 'Del Peak 19(8p23.2) mutation analysis'
| Cluster Labels | DEL PEAK 19(8P23.2) MUTATED | DEL PEAK 19(8P23.2) WILD-TYPE |
|---|---|---|
| Number of samples | 81 | 366 |
P value = 1.08e-23 (Fisher's exact test), Q value = 5.3e-21
Table S171. Clustering Approach #67: 'Del Peak 19(8p23.2) mutation analysis' versus Clinical Feature #3: 'HISTOLOGICAL.TYPE'
| nPatients | ENDOMETRIOID ENDOMETRIAL ADENOCARCINOMA | MIXED SEROUS AND ENDOMETRIOID | SEROUS ENDOMETRIAL ADENOCARCINOMA |
|---|---|---|---|
| ALL | 350 | 18 | 79 |
| DEL PEAK 19(8P23.2) MUTATED | 28 | 4 | 49 |
| DEL PEAK 19(8P23.2) WILD-TYPE | 322 | 14 | 30 |
Figure S104. Get High-res Image Clustering Approach #67: 'Del Peak 19(8p23.2) mutation analysis' versus Clinical Feature #3: 'HISTOLOGICAL.TYPE'
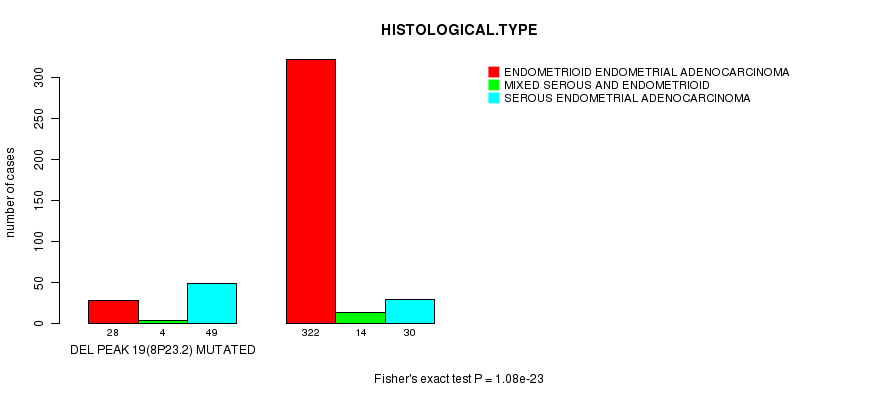
Table S172. Description of clustering approach #68: 'Del Peak 20(9p23) mutation analysis'
| Cluster Labels | DEL PEAK 20(9P23) MUTATED | DEL PEAK 20(9P23) WILD-TYPE |
|---|---|---|
| Number of samples | 51 | 396 |
P value = 9.61e-11 (Fisher's exact test), Q value = 4.1e-08
Table S173. Clustering Approach #68: 'Del Peak 20(9p23) mutation analysis' versus Clinical Feature #3: 'HISTOLOGICAL.TYPE'
| nPatients | ENDOMETRIOID ENDOMETRIAL ADENOCARCINOMA | MIXED SEROUS AND ENDOMETRIOID | SEROUS ENDOMETRIAL ADENOCARCINOMA |
|---|---|---|---|
| ALL | 350 | 18 | 79 |
| DEL PEAK 20(9P23) MUTATED | 20 | 3 | 28 |
| DEL PEAK 20(9P23) WILD-TYPE | 330 | 15 | 51 |
Figure S105. Get High-res Image Clustering Approach #68: 'Del Peak 20(9p23) mutation analysis' versus Clinical Feature #3: 'HISTOLOGICAL.TYPE'

Table S174. Description of clustering approach #69: 'Del Peak 21(9q34.11) mutation analysis'
| Cluster Labels | DEL PEAK 21(9Q34.11) MUTATED | DEL PEAK 21(9Q34.11) WILD-TYPE |
|---|---|---|
| Number of samples | 102 | 345 |
P value = 7.77e-10 (t-test), Q value = 3.3e-07
Table S175. Clustering Approach #69: 'Del Peak 21(9q34.11) mutation analysis' versus Clinical Feature #2: 'AGE'
| nPatients | Mean (Std.Dev) | |
|---|---|---|
| ALL | 446 | 63.6 (11.3) |
| DEL PEAK 21(9Q34.11) MUTATED | 102 | 68.9 (8.9) |
| DEL PEAK 21(9Q34.11) WILD-TYPE | 344 | 62.0 (11.4) |
Figure S106. Get High-res Image Clustering Approach #69: 'Del Peak 21(9q34.11) mutation analysis' versus Clinical Feature #2: 'AGE'

P value = 6.56e-18 (Fisher's exact test), Q value = 3.1e-15
Table S176. Clustering Approach #69: 'Del Peak 21(9q34.11) mutation analysis' versus Clinical Feature #3: 'HISTOLOGICAL.TYPE'
| nPatients | ENDOMETRIOID ENDOMETRIAL ADENOCARCINOMA | MIXED SEROUS AND ENDOMETRIOID | SEROUS ENDOMETRIAL ADENOCARCINOMA |
|---|---|---|---|
| ALL | 350 | 18 | 79 |
| DEL PEAK 21(9Q34.11) MUTATED | 46 | 8 | 48 |
| DEL PEAK 21(9Q34.11) WILD-TYPE | 304 | 10 | 31 |
Figure S107. Get High-res Image Clustering Approach #69: 'Del Peak 21(9q34.11) mutation analysis' versus Clinical Feature #3: 'HISTOLOGICAL.TYPE'

Table S177. Description of clustering approach #70: 'Del Peak 22(10q23.31) mutation analysis'
| Cluster Labels | DEL PEAK 22(10Q23.31) MUTATED | DEL PEAK 22(10Q23.31) WILD-TYPE |
|---|---|---|
| Number of samples | 53 | 394 |
P value = 1.9e-05 (Fisher's exact test), Q value = 0.0071
Table S178. Clustering Approach #70: 'Del Peak 22(10q23.31) mutation analysis' versus Clinical Feature #3: 'HISTOLOGICAL.TYPE'
| nPatients | ENDOMETRIOID ENDOMETRIAL ADENOCARCINOMA | MIXED SEROUS AND ENDOMETRIOID | SEROUS ENDOMETRIAL ADENOCARCINOMA |
|---|---|---|---|
| ALL | 350 | 18 | 79 |
| DEL PEAK 22(10Q23.31) MUTATED | 28 | 3 | 22 |
| DEL PEAK 22(10Q23.31) WILD-TYPE | 322 | 15 | 57 |
Figure S108. Get High-res Image Clustering Approach #70: 'Del Peak 22(10q23.31) mutation analysis' versus Clinical Feature #3: 'HISTOLOGICAL.TYPE'

Table S179. Description of clustering approach #71: 'Del Peak 23(11p15.5) mutation analysis'
| Cluster Labels | DEL PEAK 23(11P15.5) MUTATED | DEL PEAK 23(11P15.5) WILD-TYPE |
|---|---|---|
| Number of samples | 78 | 369 |
P value = 3.06e-08 (t-test), Q value = 1.3e-05
Table S180. Clustering Approach #71: 'Del Peak 23(11p15.5) mutation analysis' versus Clinical Feature #2: 'AGE'
| nPatients | Mean (Std.Dev) | |
|---|---|---|
| ALL | 446 | 63.6 (11.3) |
| DEL PEAK 23(11P15.5) MUTATED | 78 | 69.2 (8.9) |
| DEL PEAK 23(11P15.5) WILD-TYPE | 368 | 62.4 (11.3) |
Figure S109. Get High-res Image Clustering Approach #71: 'Del Peak 23(11p15.5) mutation analysis' versus Clinical Feature #2: 'AGE'
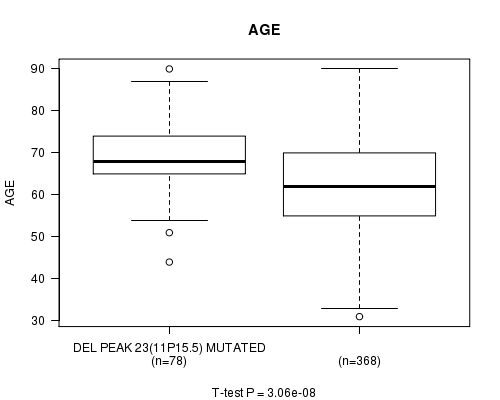
P value = 2.7e-21 (Fisher's exact test), Q value = 1.3e-18
Table S181. Clustering Approach #71: 'Del Peak 23(11p15.5) mutation analysis' versus Clinical Feature #3: 'HISTOLOGICAL.TYPE'
| nPatients | ENDOMETRIOID ENDOMETRIAL ADENOCARCINOMA | MIXED SEROUS AND ENDOMETRIOID | SEROUS ENDOMETRIAL ADENOCARCINOMA |
|---|---|---|---|
| ALL | 350 | 18 | 79 |
| DEL PEAK 23(11P15.5) MUTATED | 27 | 6 | 45 |
| DEL PEAK 23(11P15.5) WILD-TYPE | 323 | 12 | 34 |
Figure S110. Get High-res Image Clustering Approach #71: 'Del Peak 23(11p15.5) mutation analysis' versus Clinical Feature #3: 'HISTOLOGICAL.TYPE'

Table S182. Description of clustering approach #72: 'Del Peak 24(11q14.1) mutation analysis'
| Cluster Labels | DEL PEAK 24(11Q14.1) MUTATED | DEL PEAK 24(11Q14.1) WILD-TYPE |
|---|---|---|
| Number of samples | 51 | 396 |
P value = 2.66e-05 (t-test), Q value = 0.0098
Table S183. Clustering Approach #72: 'Del Peak 24(11q14.1) mutation analysis' versus Clinical Feature #2: 'AGE'
| nPatients | Mean (Std.Dev) | |
|---|---|---|
| ALL | 446 | 63.6 (11.3) |
| DEL PEAK 24(11Q14.1) MUTATED | 51 | 68.9 (8.6) |
| DEL PEAK 24(11Q14.1) WILD-TYPE | 395 | 62.9 (11.4) |
Figure S111. Get High-res Image Clustering Approach #72: 'Del Peak 24(11q14.1) mutation analysis' versus Clinical Feature #2: 'AGE'

P value = 3.72e-14 (Fisher's exact test), Q value = 1.7e-11
Table S184. Clustering Approach #72: 'Del Peak 24(11q14.1) mutation analysis' versus Clinical Feature #3: 'HISTOLOGICAL.TYPE'
| nPatients | ENDOMETRIOID ENDOMETRIAL ADENOCARCINOMA | MIXED SEROUS AND ENDOMETRIOID | SEROUS ENDOMETRIAL ADENOCARCINOMA |
|---|---|---|---|
| ALL | 350 | 18 | 79 |
| DEL PEAK 24(11Q14.1) MUTATED | 16 | 6 | 29 |
| DEL PEAK 24(11Q14.1) WILD-TYPE | 334 | 12 | 50 |
Figure S112. Get High-res Image Clustering Approach #72: 'Del Peak 24(11q14.1) mutation analysis' versus Clinical Feature #3: 'HISTOLOGICAL.TYPE'

Table S185. Description of clustering approach #73: 'Del Peak 25(11q25) mutation analysis'
| Cluster Labels | DEL PEAK 25(11Q25) MUTATED | DEL PEAK 25(11Q25) WILD-TYPE |
|---|---|---|
| Number of samples | 69 | 378 |
P value = 0.000158 (t-test), Q value = 0.056
Table S186. Clustering Approach #73: 'Del Peak 25(11q25) mutation analysis' versus Clinical Feature #2: 'AGE'
| nPatients | Mean (Std.Dev) | |
|---|---|---|
| ALL | 446 | 63.6 (11.3) |
| DEL PEAK 25(11Q25) MUTATED | 69 | 68.0 (9.9) |
| DEL PEAK 25(11Q25) WILD-TYPE | 377 | 62.8 (11.3) |
Figure S113. Get High-res Image Clustering Approach #73: 'Del Peak 25(11q25) mutation analysis' versus Clinical Feature #2: 'AGE'

P value = 6.29e-15 (Fisher's exact test), Q value = 2.8e-12
Table S187. Clustering Approach #73: 'Del Peak 25(11q25) mutation analysis' versus Clinical Feature #3: 'HISTOLOGICAL.TYPE'
| nPatients | ENDOMETRIOID ENDOMETRIAL ADENOCARCINOMA | MIXED SEROUS AND ENDOMETRIOID | SEROUS ENDOMETRIAL ADENOCARCINOMA |
|---|---|---|---|
| ALL | 350 | 18 | 79 |
| DEL PEAK 25(11Q25) MUTATED | 27 | 5 | 37 |
| DEL PEAK 25(11Q25) WILD-TYPE | 323 | 13 | 42 |
Figure S114. Get High-res Image Clustering Approach #73: 'Del Peak 25(11q25) mutation analysis' versus Clinical Feature #3: 'HISTOLOGICAL.TYPE'

Table S188. Description of clustering approach #74: 'Del Peak 26(12q23.1) mutation analysis'
| Cluster Labels | DEL PEAK 26(12Q23.1) MUTATED | DEL PEAK 26(12Q23.1) WILD-TYPE |
|---|---|---|
| Number of samples | 34 | 413 |
P value = 4.05e-11 (Fisher's exact test), Q value = 1.7e-08
Table S189. Clustering Approach #74: 'Del Peak 26(12q23.1) mutation analysis' versus Clinical Feature #3: 'HISTOLOGICAL.TYPE'
| nPatients | ENDOMETRIOID ENDOMETRIAL ADENOCARCINOMA | MIXED SEROUS AND ENDOMETRIOID | SEROUS ENDOMETRIAL ADENOCARCINOMA |
|---|---|---|---|
| ALL | 350 | 18 | 79 |
| DEL PEAK 26(12Q23.1) MUTATED | 10 | 1 | 23 |
| DEL PEAK 26(12Q23.1) WILD-TYPE | 340 | 17 | 56 |
Figure S115. Get High-res Image Clustering Approach #74: 'Del Peak 26(12q23.1) mutation analysis' versus Clinical Feature #3: 'HISTOLOGICAL.TYPE'

Table S190. Description of clustering approach #75: 'Del Peak 27(12q24.33) mutation analysis'
| Cluster Labels | DEL PEAK 27(12Q24.33) MUTATED | DEL PEAK 27(12Q24.33) WILD-TYPE |
|---|---|---|
| Number of samples | 45 | 402 |
P value = 0.000116 (t-test), Q value = 0.041
Table S191. Clustering Approach #75: 'Del Peak 27(12q24.33) mutation analysis' versus Clinical Feature #2: 'AGE'
| nPatients | Mean (Std.Dev) | |
|---|---|---|
| ALL | 446 | 63.6 (11.3) |
| DEL PEAK 27(12Q24.33) MUTATED | 45 | 69.0 (9.1) |
| DEL PEAK 27(12Q24.33) WILD-TYPE | 401 | 63.0 (11.3) |
Figure S116. Get High-res Image Clustering Approach #75: 'Del Peak 27(12q24.33) mutation analysis' versus Clinical Feature #2: 'AGE'

P value = 4.36e-13 (Fisher's exact test), Q value = 1.9e-10
Table S192. Clustering Approach #75: 'Del Peak 27(12q24.33) mutation analysis' versus Clinical Feature #3: 'HISTOLOGICAL.TYPE'
| nPatients | ENDOMETRIOID ENDOMETRIAL ADENOCARCINOMA | MIXED SEROUS AND ENDOMETRIOID | SEROUS ENDOMETRIAL ADENOCARCINOMA |
|---|---|---|---|
| ALL | 350 | 18 | 79 |
| DEL PEAK 27(12Q24.33) MUTATED | 15 | 1 | 29 |
| DEL PEAK 27(12Q24.33) WILD-TYPE | 335 | 17 | 50 |
Figure S117. Get High-res Image Clustering Approach #75: 'Del Peak 27(12q24.33) mutation analysis' versus Clinical Feature #3: 'HISTOLOGICAL.TYPE'
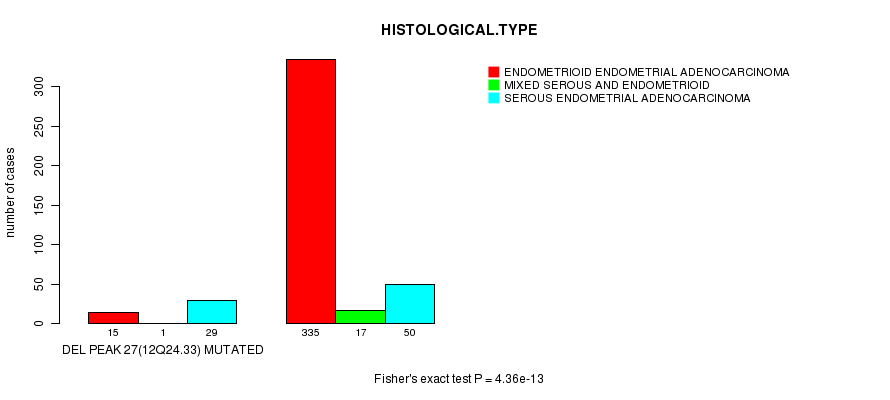
Table S193. Description of clustering approach #76: 'Del Peak 28(13q11) mutation analysis'
| Cluster Labels | DEL PEAK 28(13Q11) MUTATED | DEL PEAK 28(13Q11) WILD-TYPE |
|---|---|---|
| Number of samples | 67 | 380 |
P value = 7.87e-10 (Fisher's exact test), Q value = 3.3e-07
Table S194. Clustering Approach #76: 'Del Peak 28(13q11) mutation analysis' versus Clinical Feature #3: 'HISTOLOGICAL.TYPE'
| nPatients | ENDOMETRIOID ENDOMETRIAL ADENOCARCINOMA | MIXED SEROUS AND ENDOMETRIOID | SEROUS ENDOMETRIAL ADENOCARCINOMA |
|---|---|---|---|
| ALL | 350 | 18 | 79 |
| DEL PEAK 28(13Q11) MUTATED | 32 | 3 | 32 |
| DEL PEAK 28(13Q11) WILD-TYPE | 318 | 15 | 47 |
Figure S118. Get High-res Image Clustering Approach #76: 'Del Peak 28(13q11) mutation analysis' versus Clinical Feature #3: 'HISTOLOGICAL.TYPE'

Table S195. Description of clustering approach #77: 'Del Peak 29(13q14.2) mutation analysis'
| Cluster Labels | DEL PEAK 29(13Q14.2) MUTATED | DEL PEAK 29(13Q14.2) WILD-TYPE |
|---|---|---|
| Number of samples | 72 | 375 |
P value = 0.000327 (t-test), Q value = 0.11
Table S196. Clustering Approach #77: 'Del Peak 29(13q14.2) mutation analysis' versus Clinical Feature #2: 'AGE'
| nPatients | Mean (Std.Dev) | |
|---|---|---|
| ALL | 446 | 63.6 (11.3) |
| DEL PEAK 29(13Q14.2) MUTATED | 72 | 67.5 (9.6) |
| DEL PEAK 29(13Q14.2) WILD-TYPE | 374 | 62.8 (11.4) |
Figure S119. Get High-res Image Clustering Approach #77: 'Del Peak 29(13q14.2) mutation analysis' versus Clinical Feature #2: 'AGE'
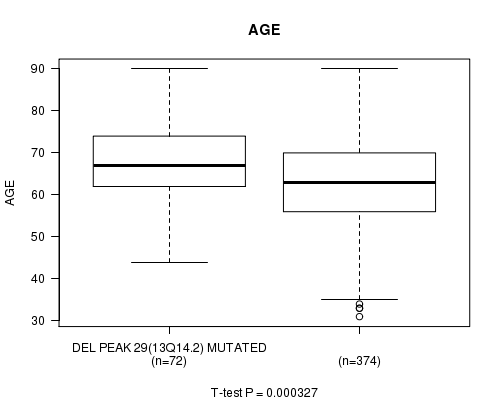
P value = 5.28e-05 (Fisher's exact test), Q value = 0.019
Table S197. Clustering Approach #77: 'Del Peak 29(13q14.2) mutation analysis' versus Clinical Feature #3: 'HISTOLOGICAL.TYPE'
| nPatients | ENDOMETRIOID ENDOMETRIAL ADENOCARCINOMA | MIXED SEROUS AND ENDOMETRIOID | SEROUS ENDOMETRIAL ADENOCARCINOMA |
|---|---|---|---|
| ALL | 350 | 18 | 79 |
| DEL PEAK 29(13Q14.2) MUTATED | 42 | 4 | 26 |
| DEL PEAK 29(13Q14.2) WILD-TYPE | 308 | 14 | 53 |
Figure S120. Get High-res Image Clustering Approach #77: 'Del Peak 29(13q14.2) mutation analysis' versus Clinical Feature #3: 'HISTOLOGICAL.TYPE'
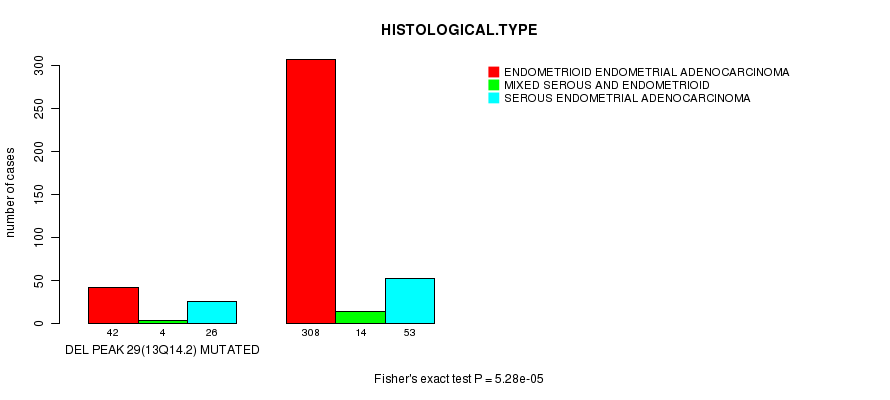
Table S198. Description of clustering approach #78: 'Del Peak 30(14q13.1) mutation analysis'
| Cluster Labels | DEL PEAK 30(14Q13.1) MUTATED | DEL PEAK 30(14Q13.1) WILD-TYPE |
|---|---|---|
| Number of samples | 55 | 392 |
P value = 0.000739 (t-test), Q value = 0.25
Table S199. Clustering Approach #78: 'Del Peak 30(14q13.1) mutation analysis' versus Clinical Feature #2: 'AGE'
| nPatients | Mean (Std.Dev) | |
|---|---|---|
| ALL | 446 | 63.6 (11.3) |
| DEL PEAK 30(14Q13.1) MUTATED | 55 | 68.1 (10.0) |
| DEL PEAK 30(14Q13.1) WILD-TYPE | 391 | 62.9 (11.3) |
Figure S121. Get High-res Image Clustering Approach #78: 'Del Peak 30(14q13.1) mutation analysis' versus Clinical Feature #2: 'AGE'
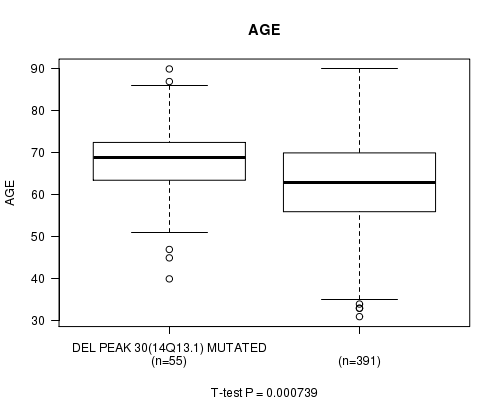
P value = 9.68e-12 (Fisher's exact test), Q value = 4.2e-09
Table S200. Clustering Approach #78: 'Del Peak 30(14q13.1) mutation analysis' versus Clinical Feature #3: 'HISTOLOGICAL.TYPE'
| nPatients | ENDOMETRIOID ENDOMETRIAL ADENOCARCINOMA | MIXED SEROUS AND ENDOMETRIOID | SEROUS ENDOMETRIAL ADENOCARCINOMA |
|---|---|---|---|
| ALL | 350 | 18 | 79 |
| DEL PEAK 30(14Q13.1) MUTATED | 21 | 5 | 29 |
| DEL PEAK 30(14Q13.1) WILD-TYPE | 329 | 13 | 50 |
Figure S122. Get High-res Image Clustering Approach #78: 'Del Peak 30(14q13.1) mutation analysis' versus Clinical Feature #3: 'HISTOLOGICAL.TYPE'

Table S201. Description of clustering approach #79: 'Del Peak 31(15q15.1) mutation analysis'
| Cluster Labels | DEL PEAK 31(15Q15.1) MUTATED | DEL PEAK 31(15Q15.1) WILD-TYPE |
|---|---|---|
| Number of samples | 104 | 343 |
P value = 1.44e-08 (t-test), Q value = 6e-06
Table S202. Clustering Approach #79: 'Del Peak 31(15q15.1) mutation analysis' versus Clinical Feature #2: 'AGE'
| nPatients | Mean (Std.Dev) | |
|---|---|---|
| ALL | 446 | 63.6 (11.3) |
| DEL PEAK 31(15Q15.1) MUTATED | 104 | 68.7 (9.6) |
| DEL PEAK 31(15Q15.1) WILD-TYPE | 342 | 62.0 (11.3) |
Figure S123. Get High-res Image Clustering Approach #79: 'Del Peak 31(15q15.1) mutation analysis' versus Clinical Feature #2: 'AGE'
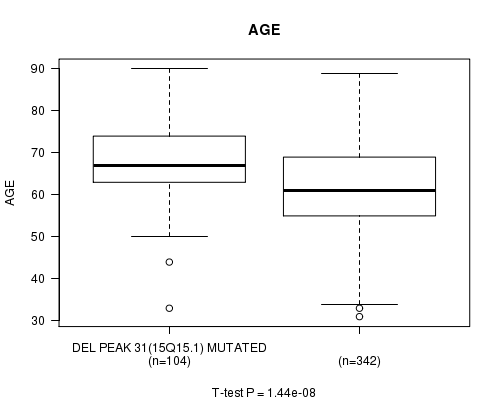
P value = 6.83e-21 (Fisher's exact test), Q value = 3.3e-18
Table S203. Clustering Approach #79: 'Del Peak 31(15q15.1) mutation analysis' versus Clinical Feature #3: 'HISTOLOGICAL.TYPE'
| nPatients | ENDOMETRIOID ENDOMETRIAL ADENOCARCINOMA | MIXED SEROUS AND ENDOMETRIOID | SEROUS ENDOMETRIAL ADENOCARCINOMA |
|---|---|---|---|
| ALL | 350 | 18 | 79 |
| DEL PEAK 31(15Q15.1) MUTATED | 45 | 7 | 52 |
| DEL PEAK 31(15Q15.1) WILD-TYPE | 305 | 11 | 27 |
Figure S124. Get High-res Image Clustering Approach #79: 'Del Peak 31(15q15.1) mutation analysis' versus Clinical Feature #3: 'HISTOLOGICAL.TYPE'

Table S204. Description of clustering approach #80: 'Del Peak 32(15q23) mutation analysis'
| Cluster Labels | DEL PEAK 32(15Q23) MUTATED | DEL PEAK 32(15Q23) WILD-TYPE |
|---|---|---|
| Number of samples | 83 | 364 |
P value = 1.79e-05 (t-test), Q value = 0.0067
Table S205. Clustering Approach #80: 'Del Peak 32(15q23) mutation analysis' versus Clinical Feature #2: 'AGE'
| nPatients | Mean (Std.Dev) | |
|---|---|---|
| ALL | 446 | 63.6 (11.3) |
| DEL PEAK 32(15Q23) MUTATED | 83 | 67.9 (9.5) |
| DEL PEAK 32(15Q23) WILD-TYPE | 363 | 62.6 (11.4) |
Figure S125. Get High-res Image Clustering Approach #80: 'Del Peak 32(15q23) mutation analysis' versus Clinical Feature #2: 'AGE'
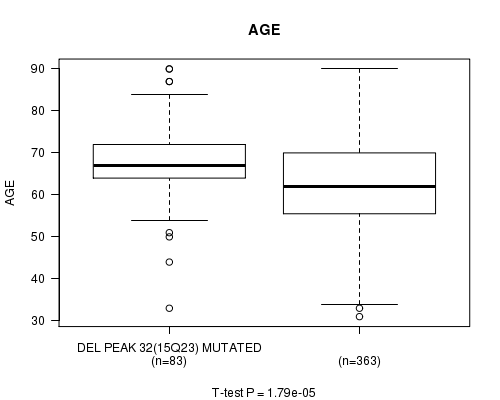
P value = 7.29e-20 (Fisher's exact test), Q value = 3.5e-17
Table S206. Clustering Approach #80: 'Del Peak 32(15q23) mutation analysis' versus Clinical Feature #3: 'HISTOLOGICAL.TYPE'
| nPatients | ENDOMETRIOID ENDOMETRIAL ADENOCARCINOMA | MIXED SEROUS AND ENDOMETRIOID | SEROUS ENDOMETRIAL ADENOCARCINOMA |
|---|---|---|---|
| ALL | 350 | 18 | 79 |
| DEL PEAK 32(15Q23) MUTATED | 32 | 5 | 46 |
| DEL PEAK 32(15Q23) WILD-TYPE | 318 | 13 | 33 |
Figure S126. Get High-res Image Clustering Approach #80: 'Del Peak 32(15q23) mutation analysis' versus Clinical Feature #3: 'HISTOLOGICAL.TYPE'
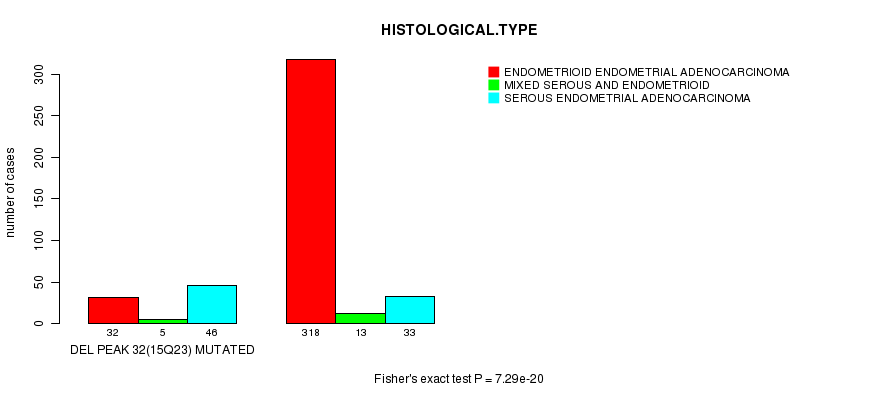
Table S207. Description of clustering approach #81: 'Del Peak 33(16p13.3) mutation analysis'
| Cluster Labels | DEL PEAK 33(16P13.3) MUTATED | DEL PEAK 33(16P13.3) WILD-TYPE |
|---|---|---|
| Number of samples | 62 | 385 |
P value = 9.74e-08 (t-test), Q value = 4e-05
Table S208. Clustering Approach #81: 'Del Peak 33(16p13.3) mutation analysis' versus Clinical Feature #2: 'AGE'
| nPatients | Mean (Std.Dev) | |
|---|---|---|
| ALL | 446 | 63.6 (11.3) |
| DEL PEAK 33(16P13.3) MUTATED | 62 | 69.3 (8.0) |
| DEL PEAK 33(16P13.3) WILD-TYPE | 384 | 62.6 (11.4) |
Figure S127. Get High-res Image Clustering Approach #81: 'Del Peak 33(16p13.3) mutation analysis' versus Clinical Feature #2: 'AGE'

P value = 1.02e-15 (Fisher's exact test), Q value = 4.7e-13
Table S209. Clustering Approach #81: 'Del Peak 33(16p13.3) mutation analysis' versus Clinical Feature #3: 'HISTOLOGICAL.TYPE'
| nPatients | ENDOMETRIOID ENDOMETRIAL ADENOCARCINOMA | MIXED SEROUS AND ENDOMETRIOID | SEROUS ENDOMETRIAL ADENOCARCINOMA |
|---|---|---|---|
| ALL | 350 | 18 | 79 |
| DEL PEAK 33(16P13.3) MUTATED | 22 | 4 | 36 |
| DEL PEAK 33(16P13.3) WILD-TYPE | 328 | 14 | 43 |
Figure S128. Get High-res Image Clustering Approach #81: 'Del Peak 33(16p13.3) mutation analysis' versus Clinical Feature #3: 'HISTOLOGICAL.TYPE'

Table S210. Description of clustering approach #82: 'Del Peak 34(16q21) mutation analysis'
| Cluster Labels | DEL PEAK 34(16Q21) MUTATED | DEL PEAK 34(16Q21) WILD-TYPE |
|---|---|---|
| Number of samples | 117 | 330 |
P value = 7.63e-09 (t-test), Q value = 3.2e-06
Table S211. Clustering Approach #82: 'Del Peak 34(16q21) mutation analysis' versus Clinical Feature #2: 'AGE'
| nPatients | Mean (Std.Dev) | |
|---|---|---|
| ALL | 446 | 63.6 (11.3) |
| DEL PEAK 34(16Q21) MUTATED | 117 | 68.2 (9.2) |
| DEL PEAK 34(16Q21) WILD-TYPE | 329 | 61.9 (11.5) |
Figure S129. Get High-res Image Clustering Approach #82: 'Del Peak 34(16q21) mutation analysis' versus Clinical Feature #2: 'AGE'

P value = 1.85e-21 (Fisher's exact test), Q value = 8.9e-19
Table S212. Clustering Approach #82: 'Del Peak 34(16q21) mutation analysis' versus Clinical Feature #3: 'HISTOLOGICAL.TYPE'
| nPatients | ENDOMETRIOID ENDOMETRIAL ADENOCARCINOMA | MIXED SEROUS AND ENDOMETRIOID | SEROUS ENDOMETRIAL ADENOCARCINOMA |
|---|---|---|---|
| ALL | 350 | 18 | 79 |
| DEL PEAK 34(16Q21) MUTATED | 54 | 7 | 56 |
| DEL PEAK 34(16Q21) WILD-TYPE | 296 | 11 | 23 |
Figure S130. Get High-res Image Clustering Approach #82: 'Del Peak 34(16q21) mutation analysis' versus Clinical Feature #3: 'HISTOLOGICAL.TYPE'

Table S213. Description of clustering approach #83: 'Del Peak 35(16q23.1) mutation analysis'
| Cluster Labels | DEL PEAK 35(16Q23.1) MUTATED | DEL PEAK 35(16Q23.1) WILD-TYPE |
|---|---|---|
| Number of samples | 127 | 320 |
P value = 5.24e-08 (t-test), Q value = 2.1e-05
Table S214. Clustering Approach #83: 'Del Peak 35(16q23.1) mutation analysis' versus Clinical Feature #2: 'AGE'
| nPatients | Mean (Std.Dev) | |
|---|---|---|
| ALL | 446 | 63.6 (11.3) |
| DEL PEAK 35(16Q23.1) MUTATED | 127 | 67.8 (9.4) |
| DEL PEAK 35(16Q23.1) WILD-TYPE | 319 | 61.9 (11.5) |
Figure S131. Get High-res Image Clustering Approach #83: 'Del Peak 35(16q23.1) mutation analysis' versus Clinical Feature #2: 'AGE'

P value = 3.42e-25 (Fisher's exact test), Q value = 1.7e-22
Table S215. Clustering Approach #83: 'Del Peak 35(16q23.1) mutation analysis' versus Clinical Feature #3: 'HISTOLOGICAL.TYPE'
| nPatients | ENDOMETRIOID ENDOMETRIAL ADENOCARCINOMA | MIXED SEROUS AND ENDOMETRIOID | SEROUS ENDOMETRIAL ADENOCARCINOMA |
|---|---|---|---|
| ALL | 350 | 18 | 79 |
| DEL PEAK 35(16Q23.1) MUTATED | 59 | 6 | 62 |
| DEL PEAK 35(16Q23.1) WILD-TYPE | 291 | 12 | 17 |
Figure S132. Get High-res Image Clustering Approach #83: 'Del Peak 35(16q23.1) mutation analysis' versus Clinical Feature #3: 'HISTOLOGICAL.TYPE'

Table S216. Description of clustering approach #84: 'Del Peak 36(17p13.3) mutation analysis'
| Cluster Labels | DEL PEAK 36(17P13.3) MUTATED | DEL PEAK 36(17P13.3) WILD-TYPE |
|---|---|---|
| Number of samples | 85 | 362 |
P value = 8.02e-05 (t-test), Q value = 0.029
Table S217. Clustering Approach #84: 'Del Peak 36(17p13.3) mutation analysis' versus Clinical Feature #2: 'AGE'
| nPatients | Mean (Std.Dev) | |
|---|---|---|
| ALL | 446 | 63.6 (11.3) |
| DEL PEAK 36(17P13.3) MUTATED | 85 | 67.4 (9.2) |
| DEL PEAK 36(17P13.3) WILD-TYPE | 361 | 62.7 (11.5) |
Figure S133. Get High-res Image Clustering Approach #84: 'Del Peak 36(17p13.3) mutation analysis' versus Clinical Feature #2: 'AGE'
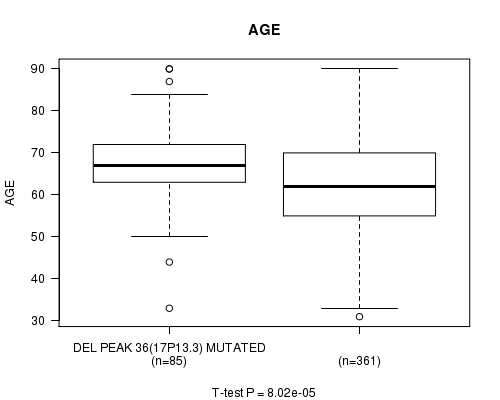
P value = 4.59e-17 (Fisher's exact test), Q value = 2.1e-14
Table S218. Clustering Approach #84: 'Del Peak 36(17p13.3) mutation analysis' versus Clinical Feature #3: 'HISTOLOGICAL.TYPE'
| nPatients | ENDOMETRIOID ENDOMETRIAL ADENOCARCINOMA | MIXED SEROUS AND ENDOMETRIOID | SEROUS ENDOMETRIAL ADENOCARCINOMA |
|---|---|---|---|
| ALL | 350 | 18 | 79 |
| DEL PEAK 36(17P13.3) MUTATED | 35 | 8 | 42 |
| DEL PEAK 36(17P13.3) WILD-TYPE | 315 | 10 | 37 |
Figure S134. Get High-res Image Clustering Approach #84: 'Del Peak 36(17p13.3) mutation analysis' versus Clinical Feature #3: 'HISTOLOGICAL.TYPE'

Table S219. Description of clustering approach #85: 'Del Peak 37(17p12) mutation analysis'
| Cluster Labels | DEL PEAK 37(17P12) MUTATED | DEL PEAK 37(17P12) WILD-TYPE |
|---|---|---|
| Number of samples | 97 | 350 |
P value = 1.56e-07 (t-test), Q value = 6.2e-05
Table S220. Clustering Approach #85: 'Del Peak 37(17p12) mutation analysis' versus Clinical Feature #2: 'AGE'
| nPatients | Mean (Std.Dev) | |
|---|---|---|
| ALL | 446 | 63.6 (11.3) |
| DEL PEAK 37(17P12) MUTATED | 97 | 68.3 (9.1) |
| DEL PEAK 37(17P12) WILD-TYPE | 349 | 62.3 (11.5) |
Figure S135. Get High-res Image Clustering Approach #85: 'Del Peak 37(17p12) mutation analysis' versus Clinical Feature #2: 'AGE'

P value = 4.91e-24 (Fisher's exact test), Q value = 2.4e-21
Table S221. Clustering Approach #85: 'Del Peak 37(17p12) mutation analysis' versus Clinical Feature #3: 'HISTOLOGICAL.TYPE'
| nPatients | ENDOMETRIOID ENDOMETRIAL ADENOCARCINOMA | MIXED SEROUS AND ENDOMETRIOID | SEROUS ENDOMETRIAL ADENOCARCINOMA |
|---|---|---|---|
| ALL | 350 | 18 | 79 |
| DEL PEAK 37(17P12) MUTATED | 37 | 8 | 52 |
| DEL PEAK 37(17P12) WILD-TYPE | 313 | 10 | 27 |
Figure S136. Get High-res Image Clustering Approach #85: 'Del Peak 37(17p12) mutation analysis' versus Clinical Feature #3: 'HISTOLOGICAL.TYPE'
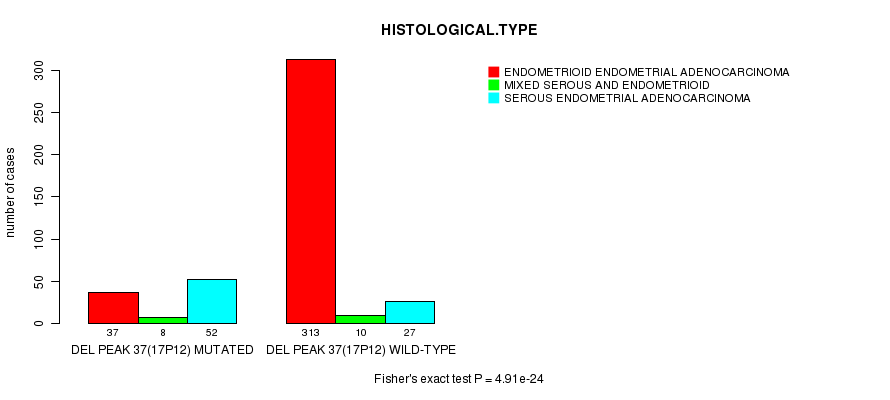
Table S222. Description of clustering approach #86: 'Del Peak 38(17p11.2) mutation analysis'
| Cluster Labels | DEL PEAK 38(17P11.2) MUTATED | DEL PEAK 38(17P11.2) WILD-TYPE |
|---|---|---|
| Number of samples | 88 | 359 |
P value = 1.86e-06 (t-test), Q value = 0.00072
Table S223. Clustering Approach #86: 'Del Peak 38(17p11.2) mutation analysis' versus Clinical Feature #2: 'AGE'
| nPatients | Mean (Std.Dev) | |
|---|---|---|
| ALL | 446 | 63.6 (11.3) |
| DEL PEAK 38(17P11.2) MUTATED | 88 | 68.2 (9.2) |
| DEL PEAK 38(17P11.2) WILD-TYPE | 358 | 62.4 (11.4) |
Figure S137. Get High-res Image Clustering Approach #86: 'Del Peak 38(17p11.2) mutation analysis' versus Clinical Feature #2: 'AGE'

P value = 2.42e-17 (Fisher's exact test), Q value = 1.1e-14
Table S224. Clustering Approach #86: 'Del Peak 38(17p11.2) mutation analysis' versus Clinical Feature #3: 'HISTOLOGICAL.TYPE'
| nPatients | ENDOMETRIOID ENDOMETRIAL ADENOCARCINOMA | MIXED SEROUS AND ENDOMETRIOID | SEROUS ENDOMETRIAL ADENOCARCINOMA |
|---|---|---|---|
| ALL | 350 | 18 | 79 |
| DEL PEAK 38(17P11.2) MUTATED | 37 | 7 | 44 |
| DEL PEAK 38(17P11.2) WILD-TYPE | 313 | 11 | 35 |
Figure S138. Get High-res Image Clustering Approach #86: 'Del Peak 38(17p11.2) mutation analysis' versus Clinical Feature #3: 'HISTOLOGICAL.TYPE'
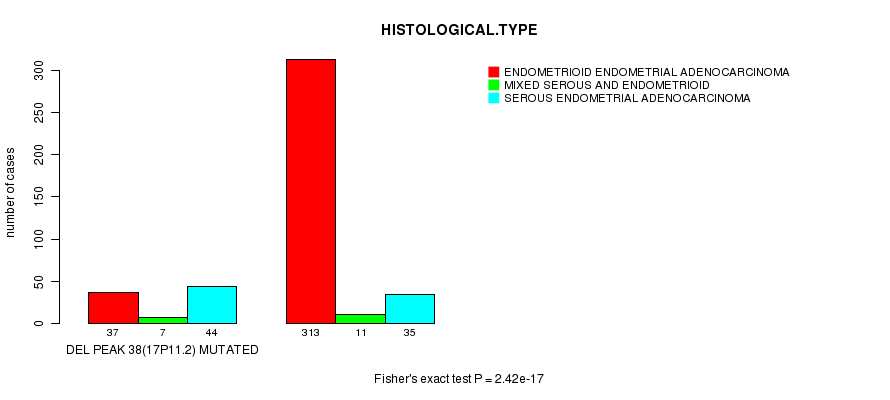
Table S225. Description of clustering approach #87: 'Del Peak 39(17q11.2) mutation analysis'
| Cluster Labels | DEL PEAK 39(17Q11.2) MUTATED | DEL PEAK 39(17Q11.2) WILD-TYPE |
|---|---|---|
| Number of samples | 78 | 369 |
P value = 8.22e-06 (t-test), Q value = 0.0031
Table S226. Clustering Approach #87: 'Del Peak 39(17q11.2) mutation analysis' versus Clinical Feature #2: 'AGE'
| nPatients | Mean (Std.Dev) | |
|---|---|---|
| ALL | 446 | 63.6 (11.3) |
| DEL PEAK 39(17Q11.2) MUTATED | 78 | 68.2 (9.3) |
| DEL PEAK 39(17Q11.2) WILD-TYPE | 368 | 62.6 (11.4) |
Figure S139. Get High-res Image Clustering Approach #87: 'Del Peak 39(17q11.2) mutation analysis' versus Clinical Feature #2: 'AGE'
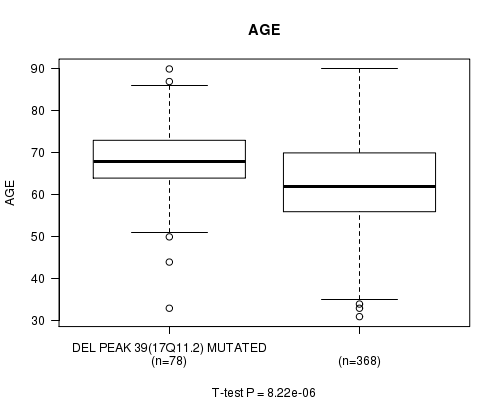
P value = 1.73e-10 (Fisher's exact test), Q value = 7.4e-08
Table S227. Clustering Approach #87: 'Del Peak 39(17q11.2) mutation analysis' versus Clinical Feature #3: 'HISTOLOGICAL.TYPE'
| nPatients | ENDOMETRIOID ENDOMETRIAL ADENOCARCINOMA | MIXED SEROUS AND ENDOMETRIOID | SEROUS ENDOMETRIAL ADENOCARCINOMA |
|---|---|---|---|
| ALL | 350 | 18 | 79 |
| DEL PEAK 39(17Q11.2) MUTATED | 38 | 5 | 35 |
| DEL PEAK 39(17Q11.2) WILD-TYPE | 312 | 13 | 44 |
Figure S140. Get High-res Image Clustering Approach #87: 'Del Peak 39(17q11.2) mutation analysis' versus Clinical Feature #3: 'HISTOLOGICAL.TYPE'
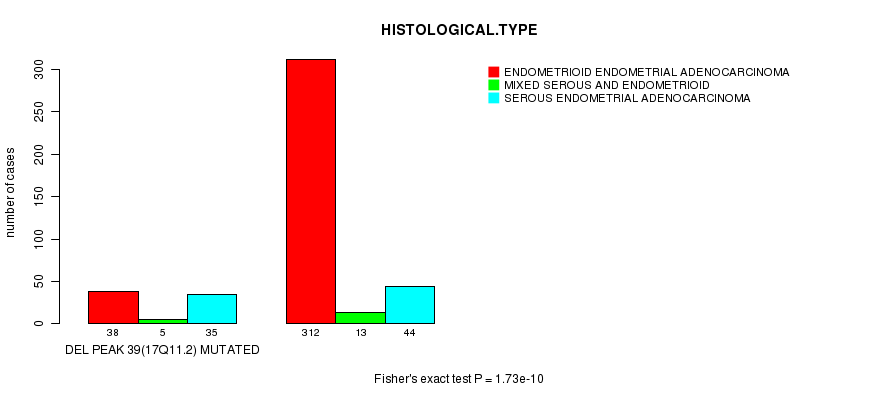
Table S228. Description of clustering approach #88: 'Del Peak 40(17q21.2) mutation analysis'
| Cluster Labels | DEL PEAK 40(17Q21.2) MUTATED | DEL PEAK 40(17Q21.2) WILD-TYPE |
|---|---|---|
| Number of samples | 83 | 364 |
P value = 1.11e-05 (t-test), Q value = 0.0042
Table S229. Clustering Approach #88: 'Del Peak 40(17q21.2) mutation analysis' versus Clinical Feature #2: 'AGE'
| nPatients | Mean (Std.Dev) | |
|---|---|---|
| ALL | 446 | 63.6 (11.3) |
| DEL PEAK 40(17Q21.2) MUTATED | 83 | 68.1 (9.6) |
| DEL PEAK 40(17Q21.2) WILD-TYPE | 363 | 62.5 (11.4) |
Figure S141. Get High-res Image Clustering Approach #88: 'Del Peak 40(17q21.2) mutation analysis' versus Clinical Feature #2: 'AGE'

P value = 4.62e-14 (Fisher's exact test), Q value = 2.1e-11
Table S230. Clustering Approach #88: 'Del Peak 40(17q21.2) mutation analysis' versus Clinical Feature #3: 'HISTOLOGICAL.TYPE'
| nPatients | ENDOMETRIOID ENDOMETRIAL ADENOCARCINOMA | MIXED SEROUS AND ENDOMETRIOID | SEROUS ENDOMETRIAL ADENOCARCINOMA |
|---|---|---|---|
| ALL | 350 | 18 | 79 |
| DEL PEAK 40(17Q21.2) MUTATED | 37 | 6 | 40 |
| DEL PEAK 40(17Q21.2) WILD-TYPE | 313 | 12 | 39 |
Figure S142. Get High-res Image Clustering Approach #88: 'Del Peak 40(17q21.2) mutation analysis' versus Clinical Feature #3: 'HISTOLOGICAL.TYPE'
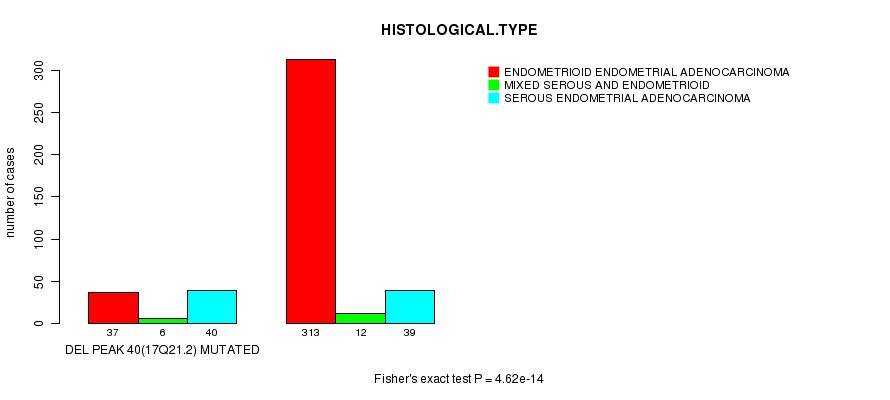
Table S231. Description of clustering approach #89: 'Del Peak 41(18q23) mutation analysis'
| Cluster Labels | DEL PEAK 41(18Q23) MUTATED | DEL PEAK 41(18Q23) WILD-TYPE |
|---|---|---|
| Number of samples | 73 | 374 |
P value = 1.3e-14 (Fisher's exact test), Q value = 5.9e-12
Table S232. Clustering Approach #89: 'Del Peak 41(18q23) mutation analysis' versus Clinical Feature #3: 'HISTOLOGICAL.TYPE'
| nPatients | ENDOMETRIOID ENDOMETRIAL ADENOCARCINOMA | MIXED SEROUS AND ENDOMETRIOID | SEROUS ENDOMETRIAL ADENOCARCINOMA |
|---|---|---|---|
| ALL | 350 | 18 | 79 |
| DEL PEAK 41(18Q23) MUTATED | 30 | 5 | 38 |
| DEL PEAK 41(18Q23) WILD-TYPE | 320 | 13 | 41 |
Figure S143. Get High-res Image Clustering Approach #89: 'Del Peak 41(18q23) mutation analysis' versus Clinical Feature #3: 'HISTOLOGICAL.TYPE'

Table S233. Description of clustering approach #90: 'Del Peak 42(19p13.3) mutation analysis'
| Cluster Labels | DEL PEAK 42(19P13.3) MUTATED | DEL PEAK 42(19P13.3) WILD-TYPE |
|---|---|---|
| Number of samples | 116 | 331 |
P value = 1.81e-11 (t-test), Q value = 7.8e-09
Table S234. Clustering Approach #90: 'Del Peak 42(19p13.3) mutation analysis' versus Clinical Feature #2: 'AGE'
| nPatients | Mean (Std.Dev) | |
|---|---|---|
| ALL | 446 | 63.6 (11.3) |
| DEL PEAK 42(19P13.3) MUTATED | 116 | 68.9 (8.7) |
| DEL PEAK 42(19P13.3) WILD-TYPE | 330 | 61.7 (11.5) |
Figure S144. Get High-res Image Clustering Approach #90: 'Del Peak 42(19p13.3) mutation analysis' versus Clinical Feature #2: 'AGE'

P value = 3.19e-46 (Fisher's exact test), Q value = 1.6e-43
Table S235. Clustering Approach #90: 'Del Peak 42(19p13.3) mutation analysis' versus Clinical Feature #3: 'HISTOLOGICAL.TYPE'
| nPatients | ENDOMETRIOID ENDOMETRIAL ADENOCARCINOMA | MIXED SEROUS AND ENDOMETRIOID | SEROUS ENDOMETRIAL ADENOCARCINOMA |
|---|---|---|---|
| ALL | 350 | 18 | 79 |
| DEL PEAK 42(19P13.3) MUTATED | 36 | 8 | 72 |
| DEL PEAK 42(19P13.3) WILD-TYPE | 314 | 10 | 7 |
Figure S145. Get High-res Image Clustering Approach #90: 'Del Peak 42(19p13.3) mutation analysis' versus Clinical Feature #3: 'HISTOLOGICAL.TYPE'
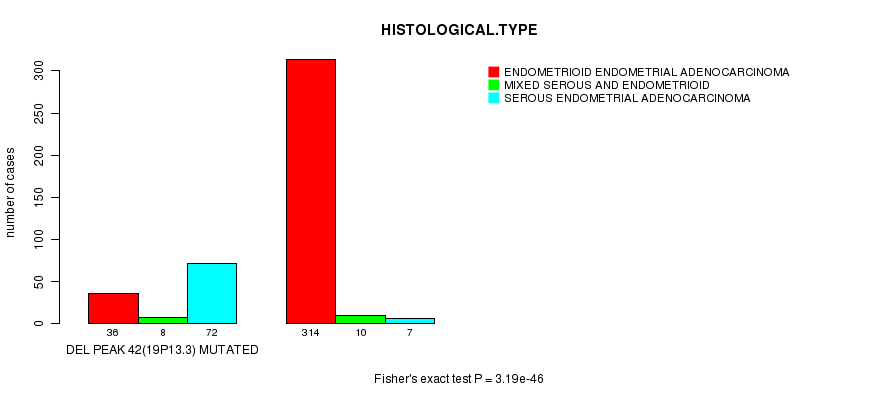
Table S236. Description of clustering approach #91: 'Del Peak 43(19p12) mutation analysis'
| Cluster Labels | DEL PEAK 43(19P12) MUTATED | DEL PEAK 43(19P12) WILD-TYPE |
|---|---|---|
| Number of samples | 38 | 409 |
P value = 1.35e-07 (Fisher's exact test), Q value = 5.5e-05
Table S237. Clustering Approach #91: 'Del Peak 43(19p12) mutation analysis' versus Clinical Feature #3: 'HISTOLOGICAL.TYPE'
| nPatients | ENDOMETRIOID ENDOMETRIAL ADENOCARCINOMA | MIXED SEROUS AND ENDOMETRIOID | SEROUS ENDOMETRIAL ADENOCARCINOMA |
|---|---|---|---|
| ALL | 350 | 18 | 79 |
| DEL PEAK 43(19P12) MUTATED | 15 | 4 | 19 |
| DEL PEAK 43(19P12) WILD-TYPE | 335 | 14 | 60 |
Figure S146. Get High-res Image Clustering Approach #91: 'Del Peak 43(19p12) mutation analysis' versus Clinical Feature #3: 'HISTOLOGICAL.TYPE'
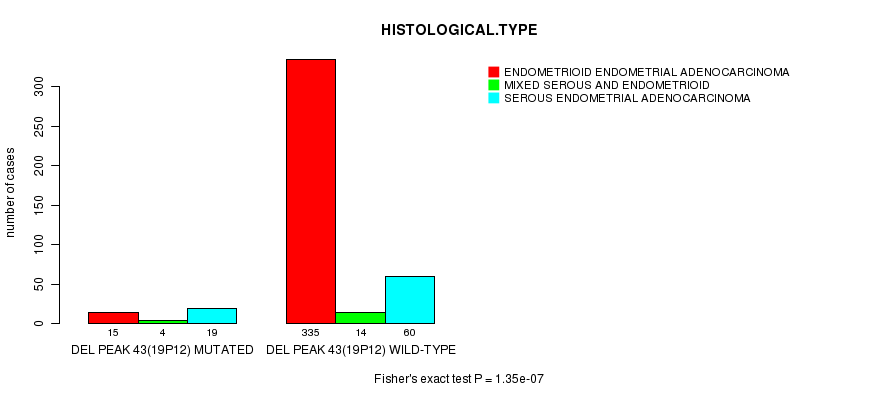
Table S238. Description of clustering approach #92: 'Del Peak 44(19q13.43) mutation analysis'
| Cluster Labels | DEL PEAK 44(19Q13.43) MUTATED | DEL PEAK 44(19Q13.43) WILD-TYPE |
|---|---|---|
| Number of samples | 48 | 399 |
P value = 1.08e-14 (Fisher's exact test), Q value = 4.9e-12
Table S239. Clustering Approach #92: 'Del Peak 44(19q13.43) mutation analysis' versus Clinical Feature #3: 'HISTOLOGICAL.TYPE'
| nPatients | ENDOMETRIOID ENDOMETRIAL ADENOCARCINOMA | MIXED SEROUS AND ENDOMETRIOID | SEROUS ENDOMETRIAL ADENOCARCINOMA |
|---|---|---|---|
| ALL | 350 | 18 | 79 |
| DEL PEAK 44(19Q13.43) MUTATED | 14 | 4 | 30 |
| DEL PEAK 44(19Q13.43) WILD-TYPE | 336 | 14 | 49 |
Figure S147. Get High-res Image Clustering Approach #92: 'Del Peak 44(19q13.43) mutation analysis' versus Clinical Feature #3: 'HISTOLOGICAL.TYPE'

Table S240. Description of clustering approach #93: 'Del Peak 45(20p12.1) mutation analysis'
| Cluster Labels | DEL PEAK 45(20P12.1) MUTATED | DEL PEAK 45(20P12.1) WILD-TYPE |
|---|---|---|
| Number of samples | 25 | 422 |
Table S241. Description of clustering approach #94: 'Del Peak 46(22q11.1) mutation analysis'
| Cluster Labels | DEL PEAK 46(22Q11.1) MUTATED | DEL PEAK 46(22Q11.1) WILD-TYPE |
|---|---|---|
| Number of samples | 66 | 381 |
P value = 9.75e-05 (t-test), Q value = 0.035
Table S242. Clustering Approach #94: 'Del Peak 46(22q11.1) mutation analysis' versus Clinical Feature #2: 'AGE'
| nPatients | Mean (Std.Dev) | |
|---|---|---|
| ALL | 446 | 63.6 (11.3) |
| DEL PEAK 46(22Q11.1) MUTATED | 66 | 67.8 (8.9) |
| DEL PEAK 46(22Q11.1) WILD-TYPE | 380 | 62.8 (11.5) |
Figure S148. Get High-res Image Clustering Approach #94: 'Del Peak 46(22q11.1) mutation analysis' versus Clinical Feature #2: 'AGE'

P value = 1.25e-05 (Fisher's exact test), Q value = 0.0047
Table S243. Clustering Approach #94: 'Del Peak 46(22q11.1) mutation analysis' versus Clinical Feature #3: 'HISTOLOGICAL.TYPE'
| nPatients | ENDOMETRIOID ENDOMETRIAL ADENOCARCINOMA | MIXED SEROUS AND ENDOMETRIOID | SEROUS ENDOMETRIAL ADENOCARCINOMA |
|---|---|---|---|
| ALL | 350 | 18 | 79 |
| DEL PEAK 46(22Q11.1) MUTATED | 37 | 3 | 26 |
| DEL PEAK 46(22Q11.1) WILD-TYPE | 313 | 15 | 53 |
Figure S149. Get High-res Image Clustering Approach #94: 'Del Peak 46(22q11.1) mutation analysis' versus Clinical Feature #3: 'HISTOLOGICAL.TYPE'

Table S244. Description of clustering approach #95: 'Del Peak 47(22q12.1) mutation analysis'
| Cluster Labels | DEL PEAK 47(22Q12.1) MUTATED | DEL PEAK 47(22Q12.1) WILD-TYPE |
|---|---|---|
| Number of samples | 70 | 377 |
P value = 2.09e-06 (Fisher's exact test), Q value = 0.00081
Table S245. Clustering Approach #95: 'Del Peak 47(22q12.1) mutation analysis' versus Clinical Feature #3: 'HISTOLOGICAL.TYPE'
| nPatients | ENDOMETRIOID ENDOMETRIAL ADENOCARCINOMA | MIXED SEROUS AND ENDOMETRIOID | SEROUS ENDOMETRIAL ADENOCARCINOMA |
|---|---|---|---|
| ALL | 350 | 18 | 79 |
| DEL PEAK 47(22Q12.1) MUTATED | 38 | 7 | 25 |
| DEL PEAK 47(22Q12.1) WILD-TYPE | 312 | 11 | 54 |
Figure S150. Get High-res Image Clustering Approach #95: 'Del Peak 47(22q12.1) mutation analysis' versus Clinical Feature #3: 'HISTOLOGICAL.TYPE'

Table S246. Description of clustering approach #96: 'Del Peak 48(22q13.31) mutation analysis'
| Cluster Labels | DEL PEAK 48(22Q13.31) MUTATED | DEL PEAK 48(22Q13.31) WILD-TYPE |
|---|---|---|
| Number of samples | 99 | 348 |
P value = 2.37e-08 (t-test), Q value = 9.8e-06
Table S247. Clustering Approach #96: 'Del Peak 48(22q13.31) mutation analysis' versus Clinical Feature #2: 'AGE'
| nPatients | Mean (Std.Dev) | |
|---|---|---|
| ALL | 446 | 63.6 (11.3) |
| DEL PEAK 48(22Q13.31) MUTATED | 99 | 68.7 (9.4) |
| DEL PEAK 48(22Q13.31) WILD-TYPE | 347 | 62.1 (11.3) |
Figure S151. Get High-res Image Clustering Approach #96: 'Del Peak 48(22q13.31) mutation analysis' versus Clinical Feature #2: 'AGE'

P value = 4.51e-17 (Fisher's exact test), Q value = 2.1e-14
Table S248. Clustering Approach #96: 'Del Peak 48(22q13.31) mutation analysis' versus Clinical Feature #3: 'HISTOLOGICAL.TYPE'
| nPatients | ENDOMETRIOID ENDOMETRIAL ADENOCARCINOMA | MIXED SEROUS AND ENDOMETRIOID | SEROUS ENDOMETRIAL ADENOCARCINOMA |
|---|---|---|---|
| ALL | 350 | 18 | 79 |
| DEL PEAK 48(22Q13.31) MUTATED | 45 | 7 | 47 |
| DEL PEAK 48(22Q13.31) WILD-TYPE | 305 | 11 | 32 |
Figure S152. Get High-res Image Clustering Approach #96: 'Del Peak 48(22q13.31) mutation analysis' versus Clinical Feature #3: 'HISTOLOGICAL.TYPE'

Table S249. Description of clustering approach #97: 'Del Peak 49(22q13.32) mutation analysis'
| Cluster Labels | DEL PEAK 49(22Q13.32) MUTATED | DEL PEAK 49(22Q13.32) WILD-TYPE |
|---|---|---|
| Number of samples | 105 | 342 |
P value = 5.33e-07 (t-test), Q value = 0.00021
Table S250. Clustering Approach #97: 'Del Peak 49(22q13.32) mutation analysis' versus Clinical Feature #2: 'AGE'
| nPatients | Mean (Std.Dev) | |
|---|---|---|
| ALL | 446 | 63.6 (11.3) |
| DEL PEAK 49(22Q13.32) MUTATED | 105 | 68.2 (10.1) |
| DEL PEAK 49(22Q13.32) WILD-TYPE | 341 | 62.2 (11.2) |
Figure S153. Get High-res Image Clustering Approach #97: 'Del Peak 49(22q13.32) mutation analysis' versus Clinical Feature #2: 'AGE'
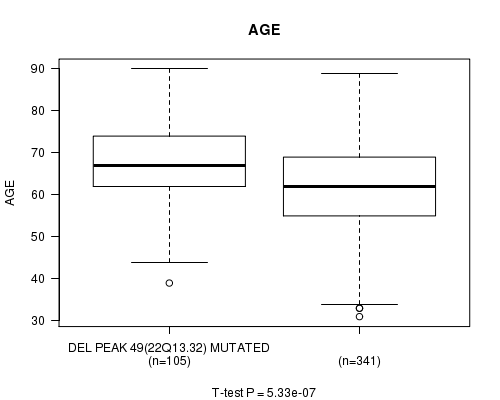
P value = 4.69e-18 (Fisher's exact test), Q value = 2.2e-15
Table S251. Clustering Approach #97: 'Del Peak 49(22q13.32) mutation analysis' versus Clinical Feature #3: 'HISTOLOGICAL.TYPE'
| nPatients | ENDOMETRIOID ENDOMETRIAL ADENOCARCINOMA | MIXED SEROUS AND ENDOMETRIOID | SEROUS ENDOMETRIAL ADENOCARCINOMA |
|---|---|---|---|
| ALL | 350 | 18 | 79 |
| DEL PEAK 49(22Q13.32) MUTATED | 48 | 8 | 49 |
| DEL PEAK 49(22Q13.32) WILD-TYPE | 302 | 10 | 30 |
Figure S154. Get High-res Image Clustering Approach #97: 'Del Peak 49(22q13.32) mutation analysis' versus Clinical Feature #3: 'HISTOLOGICAL.TYPE'
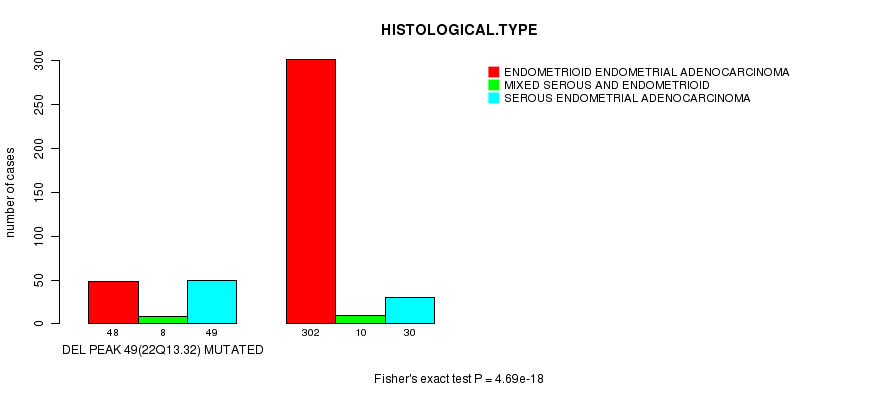
Table S252. Description of clustering approach #98: 'Del Peak 50(Xp21.1) mutation analysis'
| Cluster Labels | DEL PEAK 50(XP21.1) MUTATED | DEL PEAK 50(XP21.1) WILD-TYPE |
|---|---|---|
| Number of samples | 62 | 385 |
P value = 0.000158 (t-test), Q value = 0.056
Table S253. Clustering Approach #98: 'Del Peak 50(Xp21.1) mutation analysis' versus Clinical Feature #2: 'AGE'
| nPatients | Mean (Std.Dev) | |
|---|---|---|
| ALL | 446 | 63.6 (11.3) |
| DEL PEAK 50(XP21.1) MUTATED | 62 | 67.8 (8.8) |
| DEL PEAK 50(XP21.1) WILD-TYPE | 384 | 62.9 (11.5) |
Figure S155. Get High-res Image Clustering Approach #98: 'Del Peak 50(Xp21.1) mutation analysis' versus Clinical Feature #2: 'AGE'

P value = 1.32e-12 (Fisher's exact test), Q value = 5.8e-10
Table S254. Clustering Approach #98: 'Del Peak 50(Xp21.1) mutation analysis' versus Clinical Feature #3: 'HISTOLOGICAL.TYPE'
| nPatients | ENDOMETRIOID ENDOMETRIAL ADENOCARCINOMA | MIXED SEROUS AND ENDOMETRIOID | SEROUS ENDOMETRIAL ADENOCARCINOMA |
|---|---|---|---|
| ALL | 350 | 18 | 79 |
| DEL PEAK 50(XP21.1) MUTATED | 26 | 2 | 34 |
| DEL PEAK 50(XP21.1) WILD-TYPE | 324 | 16 | 45 |
Figure S156. Get High-res Image Clustering Approach #98: 'Del Peak 50(Xp21.1) mutation analysis' versus Clinical Feature #3: 'HISTOLOGICAL.TYPE'

-
Cluster data file = all_lesions.conf_99.cnv.cluster.txt
-
Clinical data file = UCEC-TP.clin.merged.picked.txt
-
Number of patients = 447
-
Number of clustering approaches = 98
-
Number of selected clinical features = 5
-
Exclude small clusters that include fewer than K patients, K = 3
For survival clinical features, the Kaplan-Meier survival curves of tumors with and without gene mutations were plotted and the statistical significance P values were estimated by logrank test (Bland and Altman 2004) using the 'survdiff' function in R
For continuous numerical clinical features, two-tailed Student's t test with unequal variance (Lehmann and Romano 2005) was applied to compare the clinical values between two tumor subtypes using 't.test' function in R
For binary clinical features, two-tailed Fisher's exact tests (Fisher 1922) were used to estimate the P values using the 'fisher.test' function in R
For multiple hypothesis correction, Q value is the False Discovery Rate (FDR) analogue of the P value (Benjamini and Hochberg 1995), defined as the minimum FDR at which the test may be called significant. We used the 'Benjamini and Hochberg' method of 'p.adjust' function in R to convert P values into Q values.
This is an experimental feature. The full results of the analysis summarized in this report can be downloaded from the TCGA Data Coordination Center.