(primary solid tumor cohort)
This pipeline computes the correlation between significant copy number variation (cnv focal) genes and selected clinical features.
Testing the association between copy number variation 64 arm-level results and 9 clinical features across 857 patients, 3 significant findings detected with Q value < 0.25.
-
Amp Peak 24(17q23.1) cnv correlated to 'GENDER'.
-
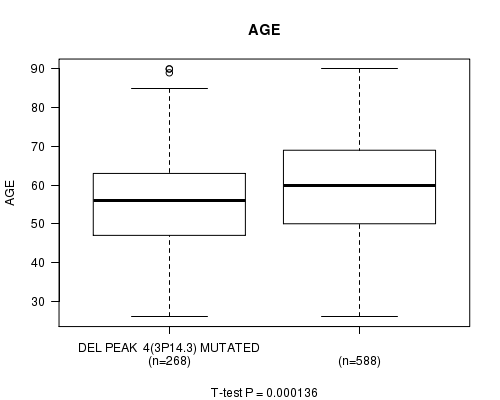
Del Peak 4(3p14.3) cnv correlated to 'AGE'.
-
Del Peak 11(6q27) cnv correlated to 'AGE'.
Table 1. Get Full Table Overview of the association between significant copy number variation of 64 arm-level results and 9 clinical features. Shown in the table are P values (Q values). Thresholded by Q value < 0.25, 3 significant findings detected.
|
Clinical Features |
Time to Death |
AGE | GENDER |
RADIATIONS RADIATION REGIMENINDICATION |
DISTANT METASTASIS |
LYMPH NODE METASTASIS |
NUMBER OF LYMPH NODES |
TUMOR STAGECODE |
NEOPLASM DISEASESTAGE |
||
| nCNV (%) | nWild-Type | logrank test | t-test | Fisher's exact test | Fisher's exact test | Fisher's exact test | Chi-square test | t-test | t-test | Chi-square test | |
| Amp Peak 24(17q23 1) | 357 (42%) | 500 |
0.069 (1.00) |
0.813 (1.00) |
0.000356 (0.182) |
0.422 (1.00) |
0.103 (1.00) |
0.477 (1.00) |
0.746 (1.00) |
0.0383 (1.00) |
|
| Del Peak 4(3p14 3) | 268 (31%) | 589 |
0.0193 (1.00) |
0.000136 (0.0696) |
1 (1.00) |
0.67 (1.00) |
0.423 (1.00) |
0.728 (1.00) |
0.986 (1.00) |
0.726 (1.00) |
|
| Del Peak 11(6q27) | 297 (35%) | 560 |
0.188 (1.00) |
0.000223 (0.114) |
0.174 (1.00) |
0.803 (1.00) |
0.231 (1.00) |
0.278 (1.00) |
0.389 (1.00) |
0.679 (1.00) |
|
| Amp Peak 1(1p22 3) | 188 (22%) | 669 |
0.987 (1.00) |
0.827 (1.00) |
1 (1.00) |
0.775 (1.00) |
0.58 (1.00) |
0.403 (1.00) |
0.103 (1.00) |
0.605 (1.00) |
|
| Amp Peak 2(1q21 3) | 615 (72%) | 242 |
0.81 (1.00) |
0.471 (1.00) |
0.28 (1.00) |
0.187 (1.00) |
0.469 (1.00) |
0.479 (1.00) |
0.691 (1.00) |
0.396 (1.00) |
|
| Amp Peak 3(1q44) | 613 (72%) | 244 |
0.0122 (1.00) |
0.884 (1.00) |
0.719 (1.00) |
0.381 (1.00) |
0.456 (1.00) |
0.239 (1.00) |
0.758 (1.00) |
0.504 (1.00) |
|
| Amp Peak 4(3p26 1) | 182 (21%) | 675 |
0.00505 (1.00) |
0.64 (1.00) |
0.217 (1.00) |
0.847 (1.00) |
0.0674 (1.00) |
0.129 (1.00) |
0.582 (1.00) |
0.114 (1.00) |
|
| Amp Peak 5(3q26 32) | 277 (32%) | 580 |
0.621 (1.00) |
0.338 (1.00) |
0.726 (1.00) |
0.127 (1.00) |
0.262 (1.00) |
0.87 (1.00) |
0.769 (1.00) |
0.553 (1.00) |
|
| Amp Peak 6(4q13 3) | 139 (16%) | 718 |
0.00214 (1.00) |
0.369 (1.00) |
1 (1.00) |
0.915 (1.00) |
0.816 (1.00) |
0.298 (1.00) |
0.329 (1.00) |
0.279 (1.00) |
|
| Amp Peak 7(6p23) | 227 (26%) | 630 |
0.63 (1.00) |
0.287 (1.00) |
0.458 (1.00) |
0.243 (1.00) |
0.929 (1.00) |
0.127 (1.00) |
0.273 (1.00) |
0.561 (1.00) |
|
| Amp Peak 8(6q21) | 159 (19%) | 698 |
0.0125 (1.00) |
0.562 (1.00) |
1 (1.00) |
0.611 (1.00) |
1 (1.00) |
0.818 (1.00) |
0.944 (1.00) |
0.362 (1.00) |
|
| Amp Peak 9(8p11 23) | 330 (39%) | 527 |
0.0287 (1.00) |
0.122 (1.00) |
0.165 (1.00) |
0.515 (1.00) |
0.077 (1.00) |
0.188 (1.00) |
0.0123 (1.00) |
0.0265 (1.00) |
|
| Amp Peak 10(8p11 21) | 333 (39%) | 524 |
0.836 (1.00) |
0.058 (1.00) |
0.165 (1.00) |
0.0285 (1.00) |
0.737 (1.00) |
0.532 (1.00) |
0.554 (1.00) |
0.415 (1.00) |
|
| Amp Peak 11(8q24 21) | 558 (65%) | 299 |
0.12 (1.00) |
0.128 (1.00) |
0.507 (1.00) |
0.561 (1.00) |
0.429 (1.00) |
0.0467 (1.00) |
0.19 (1.00) |
0.41 (1.00) |
|
| Amp Peak 12(10p15 1) | 246 (29%) | 611 |
0.201 (1.00) |
0.733 (1.00) |
0.0665 (1.00) |
0.294 (1.00) |
0.903 (1.00) |
0.828 (1.00) |
0.976 (1.00) |
0.527 (1.00) |
|
| Amp Peak 13(10q22 3) | 129 (15%) | 728 |
0.115 (1.00) |
0.774 (1.00) |
1 (1.00) |
0.507 (1.00) |
0.17 (1.00) |
0.669 (1.00) |
0.693 (1.00) |
0.328 (1.00) |
|
| Amp Peak 14(11p13) | 184 (21%) | 673 |
0.465 (1.00) |
0.695 (1.00) |
1 (1.00) |
0.501 (1.00) |
0.584 (1.00) |
0.522 (1.00) |
0.804 (1.00) |
0.347 (1.00) |
|
| Amp Peak 15(11q13 3) | 331 (39%) | 526 |
0.236 (1.00) |
0.267 (1.00) |
0.319 (1.00) |
0.745 (1.00) |
0.579 (1.00) |
0.683 (1.00) |
0.397 (1.00) |
0.273 (1.00) |
|
| Amp Peak 16(11q14 1) | 224 (26%) | 633 |
0.193 (1.00) |
0.241 (1.00) |
0.704 (1.00) |
0.719 (1.00) |
0.358 (1.00) |
0.726 (1.00) |
0.372 (1.00) |
0.267 (1.00) |
|
| Amp Peak 17(12p13 33) | 224 (26%) | 633 |
0.796 (1.00) |
0.552 (1.00) |
0.459 (1.00) |
0.0875 (1.00) |
0.734 (1.00) |
0.282 (1.00) |
0.782 (1.00) |
0.266 (1.00) |
|
| Amp Peak 18(12q15) | 227 (26%) | 630 |
0.0398 (1.00) |
0.329 (1.00) |
0.013 (1.00) |
0.721 (1.00) |
0.317 (1.00) |
0.056 (1.00) |
0.197 (1.00) |
0.131 (1.00) |
|
| Amp Peak 19(13q12 3) | 125 (15%) | 732 |
0.0381 (1.00) |
0.274 (1.00) |
0.627 (1.00) |
0.502 (1.00) |
0.213 (1.00) |
0.177 (1.00) |
0.617 (1.00) |
0.529 (1.00) |
|
| Amp Peak 20(13q34) | 149 (17%) | 708 |
0.988 (1.00) |
0.106 (1.00) |
0.372 (1.00) |
0.917 (1.00) |
0.457 (1.00) |
0.163 (1.00) |
0.819 (1.00) |
0.167 (1.00) |
|
| Amp Peak 21(14q21 1) | 177 (21%) | 680 |
0.424 (1.00) |
0.041 (1.00) |
0.694 (1.00) |
0.626 (1.00) |
0.593 (1.00) |
0.011 (1.00) |
0.048 (1.00) |
0.0372 (1.00) |
|
| Amp Peak 22(15q26 3) | 161 (19%) | 696 |
0.209 (1.00) |
0.0322 (1.00) |
0.0694 (1.00) |
0.613 (1.00) |
0.161 (1.00) |
0.708 (1.00) |
0.558 (1.00) |
0.717 (1.00) |
|
| Amp Peak 23(17q12) | 281 (33%) | 576 |
0.178 (1.00) |
0.639 (1.00) |
0.000802 (0.407) |
1 (1.00) |
0.608 (1.00) |
0.0378 (1.00) |
0.354 (1.00) |
0.197 (1.00) |
|
| Amp Peak 25(19q12) | 218 (25%) | 639 |
0.396 (1.00) |
0.518 (1.00) |
0.7 (1.00) |
0.103 (1.00) |
0.129 (1.00) |
0.0946 (1.00) |
0.483 (1.00) |
0.605 (1.00) |
|
| Amp Peak 26(19q13 42) | 228 (27%) | 629 |
0.64 (1.00) |
0.243 (1.00) |
0.257 (1.00) |
0.421 (1.00) |
0.125 (1.00) |
0.561 (1.00) |
0.817 (1.00) |
0.973 (1.00) |
|
| Amp Peak 27(20q13 2) | 447 (52%) | 410 |
0.693 (1.00) |
0.3 (1.00) |
0.181 (1.00) |
0.0571 (1.00) |
0.496 (1.00) |
0.245 (1.00) |
0.355 (1.00) |
0.304 (1.00) |
|
| Del Peak 1(1p36 13) | 363 (42%) | 494 |
0.205 (1.00) |
0.416 (1.00) |
0.179 (1.00) |
0.936 (1.00) |
0.366 (1.00) |
0.0637 (1.00) |
0.0317 (1.00) |
0.0274 (1.00) |
|
| Del Peak 2(1p22 1) | 294 (34%) | 563 |
0.00247 (1.00) |
0.189 (1.00) |
0.502 (1.00) |
0.157 (1.00) |
0.607 (1.00) |
0.00758 (1.00) |
0.0184 (1.00) |
0.0111 (1.00) |
|
| Del Peak 3(2q37 3) | 253 (30%) | 604 |
0.893 (1.00) |
0.931 (1.00) |
0.295 (1.00) |
0.488 (1.00) |
0.588 (1.00) |
0.452 (1.00) |
0.533 (1.00) |
0.617 (1.00) |
|
| Del Peak 5(4p16 3) | 268 (31%) | 589 |
0.824 (1.00) |
0.102 (1.00) |
0.728 (1.00) |
0.67 (1.00) |
0.907 (1.00) |
0.852 (1.00) |
0.791 (1.00) |
0.481 (1.00) |
|
| Del Peak 6(4q35 2) | 270 (32%) | 587 |
0.11 (1.00) |
0.793 (1.00) |
0.286 (1.00) |
1 (1.00) |
0.229 (1.00) |
0.485 (1.00) |
0.96 (1.00) |
0.906 (1.00) |
|
| Del Peak 7(5q11 2) | 222 (26%) | 635 |
0.228 (1.00) |
0.0105 (1.00) |
0.46 (1.00) |
0.527 (1.00) |
0.357 (1.00) |
0.605 (1.00) |
0.295 (1.00) |
0.619 (1.00) |
|
| Del Peak 8(5q21 3) | 213 (25%) | 644 |
0.343 (1.00) |
0.0208 (1.00) |
0.122 (1.00) |
1 (1.00) |
0.718 (1.00) |
0.278 (1.00) |
0.000851 (0.431) |
0.386 (1.00) |
|
| Del Peak 9(6p25 3) | 162 (19%) | 695 |
0.566 (1.00) |
0.0553 (1.00) |
0.681 (1.00) |
0.188 (1.00) |
0.765 (1.00) |
0.425 (1.00) |
0.0269 (1.00) |
0.688 (1.00) |
|
| Del Peak 10(6q15) | 289 (34%) | 568 |
0.415 (1.00) |
0.113 (1.00) |
0.726 (1.00) |
0.738 (1.00) |
0.554 (1.00) |
0.49 (1.00) |
0.141 (1.00) |
0.274 (1.00) |
|
| Del Peak 12(7p22 3) | 115 (13%) | 742 |
0.106 (1.00) |
0.271 (1.00) |
0.617 (1.00) |
0.728 (1.00) |
0.828 (1.00) |
0.832 (1.00) |
0.0365 (1.00) |
0.0952 (1.00) |
|
| Del Peak 13(7q36 1) | 173 (20%) | 684 |
0.0177 (1.00) |
0.871 (1.00) |
1 (1.00) |
0.279 (1.00) |
0.303 (1.00) |
0.883 (1.00) |
0.823 (1.00) |
0.907 (1.00) |
|
| Del Peak 14(8p23 2) | 456 (53%) | 401 |
0.277 (1.00) |
0.679 (1.00) |
0.514 (1.00) |
0.178 (1.00) |
0.654 (1.00) |
0.122 (1.00) |
0.725 (1.00) |
0.985 (1.00) |
|
| Del Peak 15(8p11 21) | 166 (19%) | 691 |
0.0148 (1.00) |
0.386 (1.00) |
0.219 (1.00) |
0.764 (1.00) |
0.493 (1.00) |
0.0385 (1.00) |
0.216 (1.00) |
0.595 (1.00) |
|
| Del Peak 16(9p21 3) | 296 (35%) | 561 |
0.0308 (1.00) |
0.686 (1.00) |
0.288 (1.00) |
0.183 (1.00) |
0.165 (1.00) |
0.000587 (0.299) |
0.115 (1.00) |
0.00243 (1.00) |
|
| Del Peak 17(9q21 11) | 237 (28%) | 620 |
0.508 (1.00) |
0.869 (1.00) |
0.271 (1.00) |
0.86 (1.00) |
0.323 (1.00) |
0.355 (1.00) |
0.62 (1.00) |
0.406 (1.00) |
|
| Del Peak 18(10q23 31) | 247 (29%) | 610 |
0.875 (1.00) |
0.611 (1.00) |
0.0662 (1.00) |
0.541 (1.00) |
0.823 (1.00) |
0.354 (1.00) |
0.841 (1.00) |
0.598 (1.00) |
|
| Del Peak 19(10q26 3) | 252 (29%) | 605 |
0.0442 (1.00) |
0.935 (1.00) |
0.296 (1.00) |
0.795 (1.00) |
0.586 (1.00) |
0.272 (1.00) |
0.565 (1.00) |
0.554 (1.00) |
|
| Del Peak 20(11p15 5) | 250 (29%) | 607 |
0.266 (1.00) |
0.849 (1.00) |
0.295 (1.00) |
0.931 (1.00) |
1 (1.00) |
0.643 (1.00) |
0.106 (1.00) |
0.462 (1.00) |
|
| Del Peak 21(11q13 1) | 183 (21%) | 674 |
0.36 (1.00) |
0.988 (1.00) |
0.411 (1.00) |
0.563 (1.00) |
0.698 (1.00) |
0.153 (1.00) |
0.592 (1.00) |
0.595 (1.00) |
|
| Del Peak 22(11q23 2) | 427 (50%) | 430 |
0.356 (1.00) |
0.373 (1.00) |
0.107 (1.00) |
0.937 (1.00) |
0.373 (1.00) |
0.105 (1.00) |
0.491 (1.00) |
0.21 (1.00) |
|
| Del Peak 23(11q25) | 400 (47%) | 457 |
0.202 (1.00) |
0.0201 (1.00) |
0.0906 (1.00) |
0.527 (1.00) |
0.556 (1.00) |
0.334 (1.00) |
0.532 (1.00) |
0.109 (1.00) |
|
| Del Peak 24(12p13 1) | 151 (18%) | 706 |
0.578 (1.00) |
0.648 (1.00) |
0.663 (1.00) |
0.407 (1.00) |
0.0509 (1.00) |
0.395 (1.00) |
0.574 (1.00) |
0.216 (1.00) |
|
| Del Peak 25(12q24 21) | 157 (18%) | 700 |
0.475 (1.00) |
0.227 (1.00) |
1 (1.00) |
0.759 (1.00) |
0.913 (1.00) |
0.192 (1.00) |
0.141 (1.00) |
0.622 (1.00) |
|
| Del Peak 26(13q14 2) | 396 (46%) | 461 |
0.066 (1.00) |
0.688 (1.00) |
0.74 (1.00) |
0.751 (1.00) |
0.986 (1.00) |
0.477 (1.00) |
0.169 (1.00) |
0.979 (1.00) |
|
| Del Peak 27(14q24 3) | 276 (32%) | 581 |
0.178 (1.00) |
0.838 (1.00) |
1 (1.00) |
0.446 (1.00) |
0.754 (1.00) |
0.0718 (1.00) |
0.763 (1.00) |
0.851 (1.00) |
|
| Del Peak 28(15q13 1) | 300 (35%) | 557 |
0.41 (1.00) |
0.252 (1.00) |
1 (1.00) |
0.678 (1.00) |
0.292 (1.00) |
0.16 (1.00) |
0.787 (1.00) |
0.47 (1.00) |
|
| Del Peak 29(16q24 3) | 553 (65%) | 304 |
0.116 (1.00) |
0.000958 (0.484) |
1 (1.00) |
0.563 (1.00) |
0.182 (1.00) |
0.348 (1.00) |
0.435 (1.00) |
0.253 (1.00) |
|
| Del Peak 30(17p12) | 519 (61%) | 338 |
0.149 (1.00) |
0.00333 (1.00) |
0.495 (1.00) |
0.627 (1.00) |
0.897 (1.00) |
0.0129 (1.00) |
0.231 (1.00) |
0.609 (1.00) |
|
| Del Peak 31(17q21 31) | 301 (35%) | 556 |
0.587 (1.00) |
0.000695 (0.353) |
0.172 (1.00) |
0.868 (1.00) |
0.249 (1.00) |
0.0566 (1.00) |
0.114 (1.00) |
0.264 (1.00) |
|
| Del Peak 32(18q23) | 279 (33%) | 578 |
0.022 (1.00) |
0.525 (1.00) |
1 (1.00) |
0.238 (1.00) |
0.501 (1.00) |
0.0394 (1.00) |
0.165 (1.00) |
0.202 (1.00) |
|
| Del Peak 33(19p13 3) | 296 (35%) | 561 |
0.41 (1.00) |
0.032 (1.00) |
0.726 (1.00) |
0.74 (1.00) |
0.89 (1.00) |
0.737 (1.00) |
0.2 (1.00) |
0.901 (1.00) |
|
| Del Peak 34(19q13 32) | 177 (21%) | 680 |
0.854 (1.00) |
0.703 (1.00) |
0.694 (1.00) |
0.696 (1.00) |
0.201 (1.00) |
0.216 (1.00) |
0.931 (1.00) |
0.352 (1.00) |
|
| Del Peak 35(20p13) | 128 (15%) | 729 |
0.0126 (1.00) |
0.409 (1.00) |
0.63 (1.00) |
0.581 (1.00) |
0.662 (1.00) |
0.969 (1.00) |
0.796 (1.00) |
0.426 (1.00) |
|
| Del Peak 36(21q11 2) | 176 (21%) | 681 |
0.333 (1.00) |
0.477 (1.00) |
0.217 (1.00) |
0.239 (1.00) |
0.49 (1.00) |
0.231 (1.00) |
0.693 (1.00) |
0.0106 (1.00) |
|
| Del Peak 37(22q13 32) | 386 (45%) | 471 |
0.495 (1.00) |
0.647 (1.00) |
0.739 (1.00) |
0.0679 (1.00) |
0.743 (1.00) |
0.115 (1.00) |
0.814 (1.00) |
0.874 (1.00) |
P value = 0.000356 (Fisher's exact test), Q value = 0.18
Table S1. Gene #24: 'Amp Peak 24(17q23.1) mutation analysis' versus Clinical Feature #3: 'GENDER'
| nPatients | FEMALE | MALE |
|---|---|---|
| ALL | 848 | 9 |
| AMP PEAK 24(17Q23.1) MUTATED | 348 | 9 |
| AMP PEAK 24(17Q23.1) WILD-TYPE | 500 | 0 |
Figure S1. Get High-res Image Gene #24: 'Amp Peak 24(17q23.1) mutation analysis' versus Clinical Feature #3: 'GENDER'

P value = 0.000136 (t-test), Q value = 0.07
Table S2. Gene #31: 'Del Peak 4(3p14.3) mutation analysis' versus Clinical Feature #2: 'AGE'
| nPatients | Mean (Std.Dev) | |
|---|---|---|
| ALL | 856 | 58.5 (13.2) |
| DEL PEAK 4(3P14.3) MUTATED | 268 | 55.9 (13.1) |
| DEL PEAK 4(3P14.3) WILD-TYPE | 588 | 59.6 (13.1) |
Figure S2. Get High-res Image Gene #31: 'Del Peak 4(3p14.3) mutation analysis' versus Clinical Feature #2: 'AGE'
P value = 0.000223 (t-test), Q value = 0.11
Table S3. Gene #38: 'Del Peak 11(6q27) mutation analysis' versus Clinical Feature #2: 'AGE'
| nPatients | Mean (Std.Dev) | |
|---|---|---|
| ALL | 856 | 58.5 (13.2) |
| DEL PEAK 11(6Q27) MUTATED | 297 | 56.2 (12.8) |
| DEL PEAK 11(6Q27) WILD-TYPE | 559 | 59.7 (13.3) |
Figure S3. Get High-res Image Gene #38: 'Del Peak 11(6q27) mutation analysis' versus Clinical Feature #2: 'AGE'

-
Mutation data file = all_lesions.conf_99.cnv.cluster.txt
-
Clinical data file = BRCA-TP.clin.merged.picked.txt
-
Number of patients = 857
-
Number of significantly arm-level cnvs = 64
-
Number of selected clinical features = 9
-
Exclude genes that fewer than K tumors have mutations, K = 3
For survival clinical features, the Kaplan-Meier survival curves of tumors with and without gene mutations were plotted and the statistical significance P values were estimated by logrank test (Bland and Altman 2004) using the 'survdiff' function in R
For continuous numerical clinical features, two-tailed Student's t test with unequal variance (Lehmann and Romano 2005) was applied to compare the clinical values between tumors with and without gene mutations using 't.test' function in R
For binary or multi-class clinical features (nominal or ordinal), two-tailed Fisher's exact tests (Fisher 1922) were used to estimate the P values using the 'fisher.test' function in R
For multi-class clinical features (nominal or ordinal), Chi-square tests (Greenwood and Nikulin 1996) were used to estimate the P values using the 'chisq.test' function in R
For multiple hypothesis correction, Q value is the False Discovery Rate (FDR) analogue of the P value (Benjamini and Hochberg 1995), defined as the minimum FDR at which the test may be called significant. We used the 'Benjamini and Hochberg' method of 'p.adjust' function in R to convert P values into Q values.
This is an experimental feature. The full results of the analysis summarized in this report can be downloaded from the TCGA Data Coordination Center.