(primary solid tumor cohort)
This pipeline computes the correlation between significant arm-level copy number variations (cnvs) and selected clinical features.
Testing the association between copy number variation 44 arm-level results and 10 clinical features across 34 patients, 2 significant findings detected with Q value < 0.25.
-
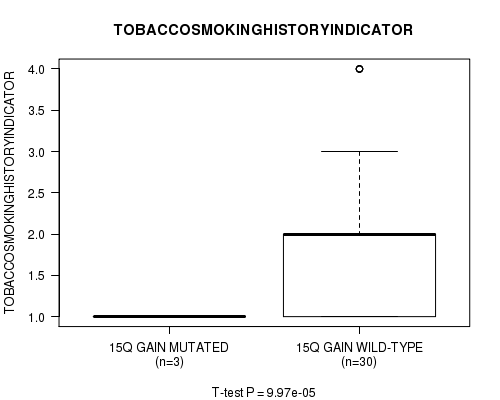
15q gain cnv correlated to 'TOBACCOSMOKINGHISTORYINDICATOR'.
-
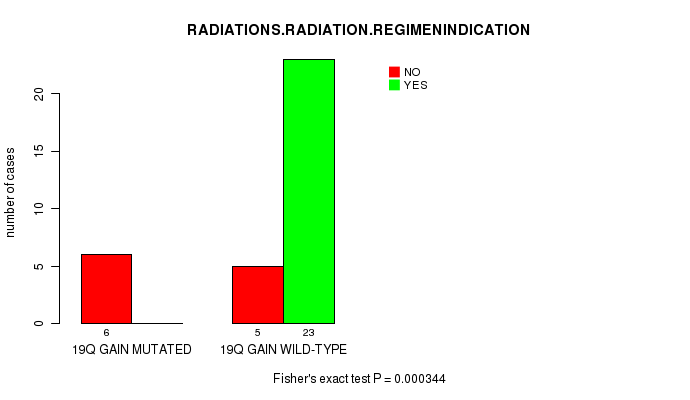
19q gain cnv correlated to 'RADIATIONS.RADIATION.REGIMENINDICATION'.
Table 1. Get Full Table Overview of the association between significant copy number variation of 44 arm-level results and 10 clinical features. Shown in the table are P values (Q values). Thresholded by Q value < 0.25, 2 significant findings detected.
|
Clinical Features |
Time to Death |
AGE |
HISTOLOGICAL TYPE |
RADIATIONS RADIATION REGIMENINDICATION |
NUMBERPACKYEARSSMOKED | TOBACCOSMOKINGHISTORYINDICATOR |
DISTANT METASTASIS |
LYMPH NODE METASTASIS |
NUMBER OF LYMPH NODES |
TUMOR STAGECODE |
||
| nCNV (%) | nWild-Type | logrank test | t-test | Fisher's exact test | Fisher's exact test | t-test | t-test | Fisher's exact test | Fisher's exact test | t-test | t-test | |
| 15q gain | 3 (9%) | 31 |
0.745 (1.00) |
0.771 (1.00) |
0.511 (1.00) |
0.535 (1.00) |
9.97e-05 (0.0363) |
1 (1.00) |
0.279 (1.00) |
0.00565 (1.00) |
||
| 19q gain | 6 (18%) | 28 |
0.104 (1.00) |
0.87 (1.00) |
1 (1.00) |
0.000344 (0.125) |
0.985 (1.00) |
0.439 (1.00) |
1 (1.00) |
0.611 (1.00) |
0.914 (1.00) |
|
| 1p gain | 7 (21%) | 27 |
0.814 (1.00) |
0.0637 (1.00) |
0.19 (1.00) |
1 (1.00) |
0.528 (1.00) |
0.339 (1.00) |
1 (1.00) |
0.917 (1.00) |
||
| 1q gain | 15 (44%) | 19 |
0.553 (1.00) |
0.129 (1.00) |
0.264 (1.00) |
0.151 (1.00) |
0.969 (1.00) |
0.862 (1.00) |
0.106 (1.00) |
1 (1.00) |
0.463 (1.00) |
|
| 2p gain | 3 (9%) | 31 |
0.0598 (1.00) |
0.717 (1.00) |
0.511 (1.00) |
0.239 (1.00) |
0.769 (1.00) |
0.532 (1.00) |
1 (1.00) |
|||
| 3p gain | 3 (9%) | 31 |
0.688 (1.00) |
0.791 (1.00) |
0.159 (1.00) |
1 (1.00) |
0.589 (1.00) |
0.22 (1.00) |
0.537 (1.00) |
0.414 (1.00) |
||
| 3q gain | 21 (62%) | 13 |
0.113 (1.00) |
0.132 (1.00) |
0.359 (1.00) |
0.709 (1.00) |
0.268 (1.00) |
0.404 (1.00) |
1 (1.00) |
0.696 (1.00) |
0.565 (1.00) |
|
| 5p gain | 8 (24%) | 26 |
0.667 (1.00) |
0.452 (1.00) |
0.707 (1.00) |
1 (1.00) |
0.888 (1.00) |
0.339 (1.00) |
0.641 (1.00) |
0.241 (1.00) |
||
| 6p gain | 6 (18%) | 28 |
0.221 (1.00) |
0.191 (1.00) |
0.64 (1.00) |
0.363 (1.00) |
0.235 (1.00) |
0.633 (1.00) |
1 (1.00) |
0.8 (1.00) |
||
| 7q gain | 4 (12%) | 30 |
0.268 (1.00) |
0.273 (1.00) |
0.243 (1.00) |
0.0889 (1.00) |
0.321 (1.00) |
0.568 (1.00) |
0.611 (1.00) |
0.556 (1.00) |
||
| 8p gain | 4 (12%) | 30 |
0.747 (1.00) |
0.294 (1.00) |
1 (1.00) |
1 (1.00) |
0.888 (1.00) |
0.28 (1.00) |
1 (1.00) |
0.443 (1.00) |
||
| 8q gain | 7 (21%) | 27 |
0.547 (1.00) |
0.357 (1.00) |
0.67 (1.00) |
1 (1.00) |
0.645 (1.00) |
1 (1.00) |
1 (1.00) |
0.704 (1.00) |
||
| 10p gain | 3 (9%) | 31 |
0.283 (1.00) |
0.459 (1.00) |
0.511 (1.00) |
0.535 (1.00) |
0.294 (1.00) |
1 (1.00) |
0.537 (1.00) |
0.414 (1.00) |
||
| 12p gain | 6 (18%) | 28 |
0.418 (1.00) |
0.366 (1.00) |
0.0422 (1.00) |
1 (1.00) |
0.218 (1.00) |
0.0559 (1.00) |
1 (1.00) |
0.917 (1.00) |
||
| 12q gain | 4 (12%) | 30 |
0.469 (1.00) |
0.575 (1.00) |
0.243 (1.00) |
0.58 (1.00) |
0.321 (1.00) |
0.076 (1.00) |
0.611 (1.00) |
0.556 (1.00) |
||
| 14q gain | 3 (9%) | 31 |
0.158 (1.00) |
0.82 (1.00) |
0.511 (1.00) |
1 (1.00) |
0.339 (1.00) |
1 (1.00) |
0.537 (1.00) |
0.593 (1.00) |
||
| 16p gain | 4 (12%) | 30 |
0.745 (1.00) |
0.818 (1.00) |
0.243 (1.00) |
1 (1.00) |
0.769 (1.00) |
1 (1.00) |
0.537 (1.00) |
0.414 (1.00) |
||
| 16q gain | 3 (9%) | 31 |
0.205 (1.00) |
0.159 (1.00) |
1 (1.00) |
1 (1.00) |
1 (1.00) |
|||||
| 18p gain | 3 (9%) | 31 |
0.355 (1.00) |
0.304 (1.00) |
0.159 (1.00) |
0.239 (1.00) |
0.401 (1.00) |
1 (1.00) |
0.537 (1.00) |
0.593 (1.00) |
||
| 20p gain | 11 (32%) | 23 |
0.119 (1.00) |
0.993 (1.00) |
0.207 (1.00) |
1 (1.00) |
0.0279 (1.00) |
0.72 (1.00) |
0.675 (1.00) |
0.425 (1.00) |
0.519 (1.00) |
|
| 20q gain | 12 (35%) | 22 |
0.00689 (1.00) |
0.332 (1.00) |
0.456 (1.00) |
1 (1.00) |
0.0279 (1.00) |
0.517 (1.00) |
0.675 (1.00) |
1 (1.00) |
0.872 (1.00) |
|
| 21q gain | 3 (9%) | 31 |
0.158 (1.00) |
0.0898 (1.00) |
0.511 (1.00) |
0.239 (1.00) |
0.589 (1.00) |
1 (1.00) |
0.537 (1.00) |
0.593 (1.00) |
||
| 22q gain | 5 (15%) | 29 |
0.355 (1.00) |
0.167 (1.00) |
0.331 (1.00) |
1 (1.00) |
0.671 (1.00) |
1 (1.00) |
0.611 (1.00) |
0.556 (1.00) |
||
| 3p loss | 9 (26%) | 25 |
0.403 (1.00) |
0.23 (1.00) |
1 (1.00) |
1 (1.00) |
0.193 (1.00) |
0.805 (1.00) |
1 (1.00) |
0.372 (1.00) |
0.247 (1.00) |
|
| 4p loss | 14 (41%) | 20 |
0.808 (1.00) |
0.317 (1.00) |
1 (1.00) |
1 (1.00) |
0.265 (1.00) |
0.883 (1.00) |
0.226 (1.00) |
1 (1.00) |
0.269 (1.00) |
|
| 4q loss | 5 (15%) | 29 |
0.221 (1.00) |
0.796 (1.00) |
1 (1.00) |
0.3 (1.00) |
0.937 (1.00) |
0.943 (1.00) |
0.568 (1.00) |
0.126 (1.00) |
0.181 (1.00) |
|
| 5q loss | 11 (32%) | 23 |
0.277 (1.00) |
0.113 (1.00) |
0.754 (1.00) |
0.271 (1.00) |
0.646 (1.00) |
0.744 (1.00) |
0.675 (1.00) |
1 (1.00) |
0.721 (1.00) |
|
| 7p loss | 4 (12%) | 30 |
0.838 (1.00) |
0.116 (1.00) |
1 (1.00) |
0.0889 (1.00) |
0.977 (1.00) |
0.502 (1.00) |
0.568 (1.00) |
0.611 (1.00) |
0.411 (1.00) |
|
| 7q loss | 4 (12%) | 30 |
0.00503 (1.00) |
0.391 (1.00) |
1 (1.00) |
0.0889 (1.00) |
0.907 (1.00) |
0.222 (1.00) |
0.532 (1.00) |
0.537 (1.00) |
0.383 (1.00) |
|
| 8p loss | 10 (29%) | 24 |
0.272 (1.00) |
0.708 (1.00) |
0.746 (1.00) |
0.692 (1.00) |
0.387 (1.00) |
1 (1.00) |
1 (1.00) |
0.704 (1.00) |
||
| 9p loss | 4 (12%) | 30 |
0.0398 (1.00) |
0.742 (1.00) |
1 (1.00) |
0.58 (1.00) |
0.345 (1.00) |
0.532 (1.00) |
1 (1.00) |
0.718 (1.00) |
||
| 9q loss | 3 (9%) | 31 |
0.0487 (1.00) |
0.353 (1.00) |
1 (1.00) |
1 (1.00) |
0.248 (1.00) |
0.532 (1.00) |
1 (1.00) |
0.718 (1.00) |
||
| 10p loss | 7 (21%) | 27 |
0.118 (1.00) |
0.553 (1.00) |
1 (1.00) |
0.178 (1.00) |
0.52 (1.00) |
0.167 (1.00) |
0.076 (1.00) |
0.0472 (1.00) |
0.175 (1.00) |
|
| 10q loss | 6 (18%) | 28 |
0.0684 (1.00) |
0.704 (1.00) |
1 (1.00) |
0.363 (1.00) |
0.77 (1.00) |
0.0717 (1.00) |
0.287 (1.00) |
0.0156 (1.00) |
0.111 (1.00) |
|
| 11p loss | 7 (21%) | 27 |
0.418 (1.00) |
0.535 (1.00) |
1 (1.00) |
0.656 (1.00) |
0.119 (1.00) |
0.158 (1.00) |
1 (1.00) |
0.277 (1.00) |
||
| 11q loss | 7 (21%) | 27 |
0.838 (1.00) |
0.767 (1.00) |
1 (1.00) |
0.178 (1.00) |
0.977 (1.00) |
0.666 (1.00) |
0.339 (1.00) |
0.641 (1.00) |
0.241 (1.00) |
|
| 12p loss | 6 (18%) | 28 |
0.439 (1.00) |
0.0155 (1.00) |
0.64 (1.00) |
0.638 (1.00) |
0.524 (1.00) |
1 (1.00) |
0.626 (1.00) |
0.261 (1.00) |
||
| 13q loss | 8 (24%) | 26 |
0.317 (1.00) |
0.911 (1.00) |
0.707 (1.00) |
1 (1.00) |
0.723 (1.00) |
0.642 (1.00) |
1 (1.00) |
0.277 (1.00) |
||
| 17p loss | 10 (29%) | 24 |
0.219 (1.00) |
0.249 (1.00) |
0.746 (1.00) |
0.692 (1.00) |
0.568 (1.00) |
0.662 (1.00) |
1 (1.00) |
1 (1.00) |
0.322 (1.00) |
|
| 17q loss | 3 (9%) | 31 |
0.825 (1.00) |
0.529 (1.00) |
1 (1.00) |
1 (1.00) |
0.861 (1.00) |
0.532 (1.00) |
1 (1.00) |
0.718 (1.00) |
||
| 18p loss | 6 (18%) | 28 |
0.74 (1.00) |
0.478 (1.00) |
0.146 (1.00) |
0.0703 (1.00) |
0.0279 (1.00) |
0.235 (1.00) |
1 (1.00) |
0.626 (1.00) |
0.261 (1.00) |
|
| 18q loss | 7 (21%) | 27 |
0.875 (1.00) |
0.653 (1.00) |
0.124 (1.00) |
0.178 (1.00) |
0.0279 (1.00) |
0.119 (1.00) |
0.633 (1.00) |
0.372 (1.00) |
0.154 (1.00) |
|
| 19p loss | 4 (12%) | 30 |
0.34 (1.00) |
0.457 (1.00) |
1 (1.00) |
0.0889 (1.00) |
0.693 (1.00) |
1 (1.00) |
1 (1.00) |
|||
| 21q loss | 6 (18%) | 28 |
0.376 (1.00) |
0.966 (1.00) |
1 (1.00) |
0.145 (1.00) |
0.0676 (1.00) |
1 (1.00) |
0.372 (1.00) |
0.672 (1.00) |
P value = 9.97e-05 (t-test), Q value = 0.036
Table S1. Gene #15: '15q gain mutation analysis' versus Clinical Feature #6: 'TOBACCOSMOKINGHISTORYINDICATOR'
| nPatients | Mean (Std.Dev) | |
|---|---|---|
| ALL | 33 | 1.8 (1.1) |
| 15Q GAIN MUTATED | 3 | 1.0 (0.0) |
| 15Q GAIN WILD-TYPE | 30 | 1.9 (1.1) |
Figure S1. Get High-res Image Gene #15: '15q gain mutation analysis' versus Clinical Feature #6: 'TOBACCOSMOKINGHISTORYINDICATOR'
P value = 0.000344 (Fisher's exact test), Q value = 0.12
Table S2. Gene #19: '19q gain mutation analysis' versus Clinical Feature #4: 'RADIATIONS.RADIATION.REGIMENINDICATION'
| nPatients | NO | YES |
|---|---|---|
| ALL | 11 | 23 |
| 19Q GAIN MUTATED | 6 | 0 |
| 19Q GAIN WILD-TYPE | 5 | 23 |
Figure S2. Get High-res Image Gene #19: '19q gain mutation analysis' versus Clinical Feature #4: 'RADIATIONS.RADIATION.REGIMENINDICATION'
-
Mutation data file = broad_values_by_arm.mutsig.cluster.txt
-
Clinical data file = CESC-TP.clin.merged.picked.txt
-
Number of patients = 34
-
Number of significantly arm-level cnvs = 44
-
Number of selected clinical features = 10
-
Exclude genes that fewer than K tumors have mutations, K = 3
For survival clinical features, the Kaplan-Meier survival curves of tumors with and without gene mutations were plotted and the statistical significance P values were estimated by logrank test (Bland and Altman 2004) using the 'survdiff' function in R
For continuous numerical clinical features, two-tailed Student's t test with unequal variance (Lehmann and Romano 2005) was applied to compare the clinical values between tumors with and without gene mutations using 't.test' function in R
For binary or multi-class clinical features (nominal or ordinal), two-tailed Fisher's exact tests (Fisher 1922) were used to estimate the P values using the 'fisher.test' function in R
For multiple hypothesis correction, Q value is the False Discovery Rate (FDR) analogue of the P value (Benjamini and Hochberg 1995), defined as the minimum FDR at which the test may be called significant. We used the 'Benjamini and Hochberg' method of 'p.adjust' function in R to convert P values into Q values.
This is an experimental feature. The full results of the analysis summarized in this report can be downloaded from the TCGA Data Coordination Center.