(primary solid tumor cohort)
This pipeline uses various statistical tests to identify mRNAs whose expression levels correlated to selected clinical features.
Testing the association between 18258 genes and 9 clinical features across 36 samples, statistically thresholded by Q value < 0.05, 1 clinical feature related to at least one genes.
-
17 genes correlated to 'HISTOLOGICAL.TYPE'.
-
MST4|51765 , MTERF|7978 , SGSM3|27352 , ZNF673|55634 , MUL1|79594 , ...
-
No genes correlated to 'Time to Death', 'AGE', 'RADIATIONS.RADIATION.REGIMENINDICATION', 'NUMBERPACKYEARSSMOKED', 'TOBACCOSMOKINGHISTORYINDICATOR', 'DISTANT.METASTASIS', 'LYMPH.NODE.METASTASIS', and 'NUMBER.OF.LYMPH.NODES'.
Complete statistical result table is provided in Supplement Table 1
Table 1. Get Full Table This table shows the clinical features, statistical methods used, and the number of genes that are significantly associated with each clinical feature at Q value < 0.05.
| Clinical feature | Statistical test | Significant genes | Associated with | Associated with | ||
|---|---|---|---|---|---|---|
| Time to Death | Cox regression test | N=0 | ||||
| AGE | Spearman correlation test | N=0 | ||||
| HISTOLOGICAL TYPE | ANOVA test | N=17 | ||||
| RADIATIONS RADIATION REGIMENINDICATION | t test | N=0 | ||||
| NUMBERPACKYEARSSMOKED | Spearman correlation test | N=0 | ||||
| TOBACCOSMOKINGHISTORYINDICATOR | Spearman correlation test | N=0 | ||||
| DISTANT METASTASIS | t test | N=0 | ||||
| LYMPH NODE METASTASIS | t test | N=0 | ||||
| NUMBER OF LYMPH NODES | Spearman correlation test | N=0 |
Table S1. Basic characteristics of clinical feature: 'Time to Death'
| Time to Death | Duration (Months) | 0.1-177 (median=6) |
| censored | N = 28 | |
| death | N = 7 | |
| Significant markers | N = 0 |
Table S2. Basic characteristics of clinical feature: 'AGE'
| AGE | Mean (SD) | 47.58 (12) |
| Significant markers | N = 0 |
Table S3. Basic characteristics of clinical feature: 'HISTOLOGICAL.TYPE'
| HISTOLOGICAL.TYPE | Labels | N |
| CERVICAL SQUAMOUS CELL CARCINOMA | 31 | |
| ENDOCERVICAL TYPE OF ADENOCARCINOMA | 1 | |
| SQUAMOUS CELL CARCINOMA | 4 | |
| Significant markers | N = 17 |
Table S4. Get Full Table List of top 10 genes differentially expressed by 'HISTOLOGICAL.TYPE'
| ANOVA_P | Q | |
|---|---|---|
| MST4|51765 | 1.062e-11 | 1.93e-07 |
| MTERF|7978 | 6.414e-11 | 1.17e-06 |
| SGSM3|27352 | 9.901e-10 | 1.8e-05 |
| ZNF673|55634 | 1.961e-09 | 3.57e-05 |
| MUL1|79594 | 2.092e-09 | 3.81e-05 |
| HOXA7|3204 | 6.264e-09 | 0.000114 |
| ANKS4B|257629 | 1.441e-08 | 0.000262 |
| TBX10|347853 | 1.772e-08 | 0.000322 |
| MYBBP1A|10514 | 2.802e-08 | 0.00051 |
| USP10|9100 | 1.179e-07 | 0.00214 |
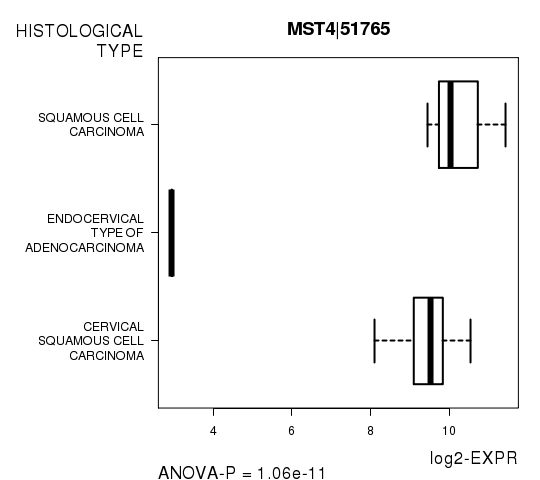
Figure S1. Get High-res Image As an example, this figure shows the association of MST4|51765 to 'HISTOLOGICAL.TYPE'. P value = 1.06e-11 with ANOVA analysis.
No gene related to 'RADIATIONS.RADIATION.REGIMENINDICATION'.
Table S5. Basic characteristics of clinical feature: 'RADIATIONS.RADIATION.REGIMENINDICATION'
| RADIATIONS.RADIATION.REGIMENINDICATION | Labels | N |
| NO | 13 | |
| YES | 23 | |
| Significant markers | N = 0 |
Table S6. Basic characteristics of clinical feature: 'NUMBERPACKYEARSSMOKED'
| NUMBERPACKYEARSSMOKED | Mean (SD) | 18.8 (11) |
| Significant markers | N = 0 |
No gene related to 'TOBACCOSMOKINGHISTORYINDICATOR'.
Table S7. Basic characteristics of clinical feature: 'TOBACCOSMOKINGHISTORYINDICATOR'
| TOBACCOSMOKINGHISTORYINDICATOR | Mean (SD) | 1.91 (1.1) |
| Value | N | |
| 1 | 16 | |
| 2 | 10 | |
| 3 | 1 | |
| 4 | 6 | |
| Significant markers | N = 0 |
Table S8. Basic characteristics of clinical feature: 'DISTANT.METASTASIS'
| DISTANT.METASTASIS | Labels | N |
| M0 | 23 | |
| MX | 8 | |
| Significant markers | N = 0 |
Table S9. Basic characteristics of clinical feature: 'LYMPH.NODE.METASTASIS'
| LYMPH.NODE.METASTASIS | Labels | N |
| N0 | 20 | |
| N1 | 12 | |
| Significant markers | N = 0 |
-
Expresson data file = CESC-TP.uncv2.mRNAseq_RSEM_normalized_log2.txt
-
Clinical data file = CESC-TP.clin.merged.picked.txt
-
Number of patients = 36
-
Number of genes = 18258
-
Number of clinical features = 9
For survival clinical features, Wald's test in univariate Cox regression analysis with proportional hazards model (Andersen and Gill 1982) was used to estimate the P values using the 'coxph' function in R. Kaplan-Meier survival curves were plot using the four quartile subgroups of patients based on expression levels
For continuous numerical clinical features, Spearman's rank correlation coefficients (Spearman 1904) and two-tailed P values were estimated using 'cor.test' function in R
For multi-class clinical features (ordinal or nominal), one-way analysis of variance (Howell 2002) was applied to compare the log2-expression levels between different clinical classes using 'anova' function in R
For two-class clinical features, two-tailed Student's t test with unequal variance (Lehmann and Romano 2005) was applied to compare the log2-expression levels between the two clinical classes using 't.test' function in R
For multiple hypothesis correction, Q value is the False Discovery Rate (FDR) analogue of the P value (Benjamini and Hochberg 1995), defined as the minimum FDR at which the test may be called significant. We used the 'Benjamini and Hochberg' method of 'p.adjust' function in R to convert P values into Q values.
This is an experimental feature. The full results of the analysis summarized in this report can be downloaded from the TCGA Data Coordination Center.