(primary solid tumor cohort)
This pipeline uses various statistical tests to identify miRs whose expression levels correlated to selected clinical features.
Testing the association between 564 genes and 9 clinical features across 40 samples, statistically thresholded by Q value < 0.05, 2 clinical features related to at least one genes.
-
5 genes correlated to 'HISTOLOGICAL.TYPE'.
-
HSA-MIR-205 , HSA-MIR-192 , HSA-MIR-194-1 , HSA-MIR-194-2 , HSA-MIR-215
-
1 gene correlated to 'TOBACCOSMOKINGHISTORYINDICATOR'.
-
HSA-MIR-3158-2
-
No genes correlated to 'Time to Death', 'AGE', 'RADIATIONS.RADIATION.REGIMENINDICATION', 'NUMBERPACKYEARSSMOKED', 'DISTANT.METASTASIS', 'LYMPH.NODE.METASTASIS', and 'NUMBER.OF.LYMPH.NODES'.
Complete statistical result table is provided in Supplement Table 1
Table 1. Get Full Table This table shows the clinical features, statistical methods used, and the number of genes that are significantly associated with each clinical feature at Q value < 0.05.
| Clinical feature | Statistical test | Significant genes | Associated with | Associated with | ||
|---|---|---|---|---|---|---|
| Time to Death | Cox regression test | N=0 | ||||
| AGE | Spearman correlation test | N=0 | ||||
| HISTOLOGICAL TYPE | ANOVA test | N=5 | ||||
| RADIATIONS RADIATION REGIMENINDICATION | t test | N=0 | ||||
| NUMBERPACKYEARSSMOKED | Spearman correlation test | N=0 | ||||
| TOBACCOSMOKINGHISTORYINDICATOR | Spearman correlation test | N=1 | higher tobaccosmokinghistoryindicator | N=0 | lower tobaccosmokinghistoryindicator | N=1 |
| DISTANT METASTASIS | t test | N=0 | ||||
| LYMPH NODE METASTASIS | t test | N=0 | ||||
| NUMBER OF LYMPH NODES | Spearman correlation test | N=0 |
Table S1. Basic characteristics of clinical feature: 'Time to Death'
| Time to Death | Duration (Months) | 0.1-177 (median=6.9) |
| censored | N = 30 | |
| death | N = 9 | |
| Significant markers | N = 0 |
Table S2. Basic characteristics of clinical feature: 'AGE'
| AGE | Mean (SD) | 49.02 (13) |
| Significant markers | N = 0 |
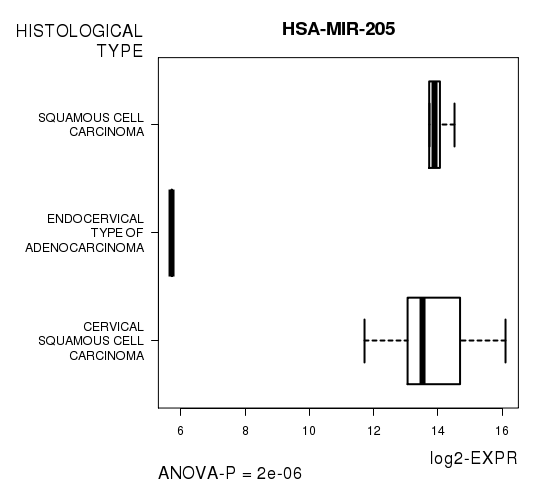
Table S3. Basic characteristics of clinical feature: 'HISTOLOGICAL.TYPE'
| HISTOLOGICAL.TYPE | Labels | N |
| CERVICAL SQUAMOUS CELL CARCINOMA | 33 | |
| ENDOCERVICAL TYPE OF ADENOCARCINOMA | 1 | |
| SQUAMOUS CELL CARCINOMA | 6 | |
| Significant markers | N = 5 |
Table S4. Get Full Table List of 5 genes differentially expressed by 'HISTOLOGICAL.TYPE'
| ANOVA_P | Q | |
|---|---|---|
| HSA-MIR-205 | 1.997e-06 | 0.00111 |
| HSA-MIR-192 | 2.677e-06 | 0.00148 |
| HSA-MIR-194-1 | 1.69e-05 | 0.00934 |
| HSA-MIR-194-2 | 1.724e-05 | 0.00952 |
| HSA-MIR-215 | 6.876e-05 | 0.0379 |
Figure S1. Get High-res Image As an example, this figure shows the association of HSA-MIR-205 to 'HISTOLOGICAL.TYPE'. P value = 2e-06 with ANOVA analysis.
No gene related to 'RADIATIONS.RADIATION.REGIMENINDICATION'.
Table S5. Basic characteristics of clinical feature: 'RADIATIONS.RADIATION.REGIMENINDICATION'
| RADIATIONS.RADIATION.REGIMENINDICATION | Labels | N |
| NO | 15 | |
| YES | 25 | |
| Significant markers | N = 0 |
Table S6. Basic characteristics of clinical feature: 'NUMBERPACKYEARSSMOKED'
| NUMBERPACKYEARSSMOKED | Mean (SD) | 18.8 (11) |
| Significant markers | N = 0 |
One gene related to 'TOBACCOSMOKINGHISTORYINDICATOR'.
Table S7. Basic characteristics of clinical feature: 'TOBACCOSMOKINGHISTORYINDICATOR'
| TOBACCOSMOKINGHISTORYINDICATOR | Mean (SD) | 1.92 (1.1) |
| Value | N | |
| 1 | 18 | |
| 2 | 11 | |
| 3 | 1 | |
| 4 | 7 | |
| Significant markers | N = 1 | |
| pos. correlated | 0 | |
| neg. correlated | 1 |
Table S8. Get Full Table List of one gene significantly correlated to 'TOBACCOSMOKINGHISTORYINDICATOR' by Spearman correlation test
| SpearmanCorr | corrP | Q | |
|---|---|---|---|
| HSA-MIR-3158-2 | -0.688 | 3.708e-05 | 0.0209 |
Figure S2. Get High-res Image As an example, this figure shows the association of HSA-MIR-3158-2 to 'TOBACCOSMOKINGHISTORYINDICATOR'. P value = 3.71e-05 with Spearman correlation analysis.
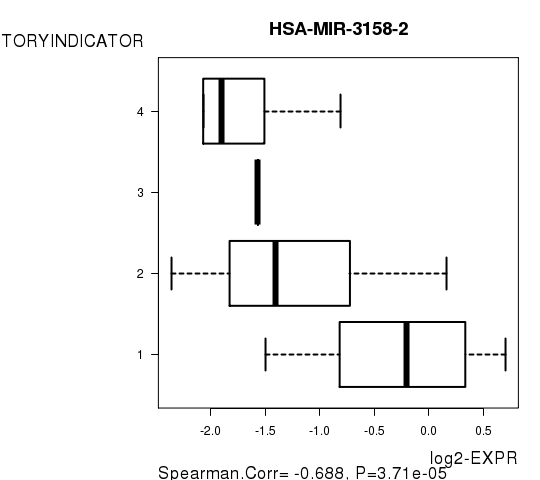
Table S9. Basic characteristics of clinical feature: 'DISTANT.METASTASIS'
| DISTANT.METASTASIS | Labels | N |
| M0 | 26 | |
| MX | 9 | |
| Significant markers | N = 0 |
Table S10. Basic characteristics of clinical feature: 'LYMPH.NODE.METASTASIS'
| LYMPH.NODE.METASTASIS | Labels | N |
| N0 | 22 | |
| N1 | 14 | |
| Significant markers | N = 0 |
-
Expresson data file = CESC-TP.miRseq_RPKM_log2.txt
-
Clinical data file = CESC-TP.clin.merged.picked.txt
-
Number of patients = 40
-
Number of genes = 564
-
Number of clinical features = 9
For survival clinical features, Wald's test in univariate Cox regression analysis with proportional hazards model (Andersen and Gill 1982) was used to estimate the P values using the 'coxph' function in R. Kaplan-Meier survival curves were plot using the four quartile subgroups of patients based on expression levels
For continuous numerical clinical features, Spearman's rank correlation coefficients (Spearman 1904) and two-tailed P values were estimated using 'cor.test' function in R
For multi-class clinical features (ordinal or nominal), one-way analysis of variance (Howell 2002) was applied to compare the log2-expression levels between different clinical classes using 'anova' function in R
For two-class clinical features, two-tailed Student's t test with unequal variance (Lehmann and Romano 2005) was applied to compare the log2-expression levels between the two clinical classes using 't.test' function in R
For multiple hypothesis correction, Q value is the False Discovery Rate (FDR) analogue of the P value (Benjamini and Hochberg 1995), defined as the minimum FDR at which the test may be called significant. We used the 'Benjamini and Hochberg' method of 'p.adjust' function in R to convert P values into Q values.
This is an experimental feature. The full results of the analysis summarized in this report can be downloaded from the TCGA Data Coordination Center.