(primary solid tumor cohort)
This pipeline uses various statistical tests to identify RPPAs whose expression levels correlated to selected clinical features.
Testing the association between 166 genes and 8 clinical features across 454 samples, statistically thresholded by Q value < 0.05, 7 clinical features related to at least one genes.
-
38 genes correlated to 'Time to Death'.
-
VASP|VASP-R-C , SRC|SRC_PY527-R-V , CDKN1A|P21-R-C , GAB2|GAB2-R-V , ACACA|ACC1-R-C , ...
-
1 gene correlated to 'AGE'.
-
IGFBP2|IGFBP2-R-V
-
4 genes correlated to 'GENDER'.
-
AR|AR-R-V , SRC|SRC-M-V , PTK2|FAK-R-C , CLDN7|CLAUDIN-7-R-V
-
36 genes correlated to 'PATHOLOGY.T'.
-
ERBB3|HER3_PY1298-R-C , CDH3|P-CADHERIN-R-C , SRC|SRC_PY527-R-V , EEF2|EEF2-R-V , ACACA|ACC1-R-C , ...
-
1 gene correlated to 'PATHOLOGY.N'.
-
EGFR|EGFR_PY1068-R-V
-
23 genes correlated to 'PATHOLOGICSPREAD(M)'.
-
ERBB3|HER3_PY1298-R-C , PECAM1|CD31-M-V , YBX1|YB-1-R-V , MAPK1 MAPK3|MAPK_PT202_Y204-R-V , TP53BP1|53BP1-R-C , ...
-
42 genes correlated to 'TUMOR.STAGE'.
-
ERBB3|HER3_PY1298-R-C , CDH3|P-CADHERIN-R-C , SRC|SRC_PY527-R-V , SHC1|SHC_PY317-R-NA , PECAM1|CD31-M-V , ...
-
No genes correlated to 'KARNOFSKY.PERFORMANCE.SCORE'
Complete statistical result table is provided in Supplement Table 1
Table 1. Get Full Table This table shows the clinical features, statistical methods used, and the number of genes that are significantly associated with each clinical feature at Q value < 0.05.
| Clinical feature | Statistical test | Significant genes | Associated with | Associated with | ||
|---|---|---|---|---|---|---|
| Time to Death | Cox regression test | N=38 | shorter survival | N=18 | longer survival | N=20 |
| AGE | Spearman correlation test | N=1 | older | N=1 | younger | N=0 |
| GENDER | t test | N=4 | male | N=2 | female | N=2 |
| KARNOFSKY PERFORMANCE SCORE | Spearman correlation test | N=0 | ||||
| PATHOLOGY T | Spearman correlation test | N=36 | higher pT | N=17 | lower pT | N=19 |
| PATHOLOGY N | t test | N=1 | n1 | N=0 | n0 | N=1 |
| PATHOLOGICSPREAD(M) | t test | N=23 | m1 | N=8 | m0 | N=15 |
| TUMOR STAGE | Spearman correlation test | N=42 | higher stage | N=19 | lower stage | N=23 |
Table S1. Basic characteristics of clinical feature: 'Time to Death'
| Time to Death | Duration (Months) | 0.1-111 (median=34.3) |
| censored | N = 301 | |
| death | N = 150 | |
| Significant markers | N = 38 | |
| associated with shorter survival | 18 | |
| associated with longer survival | 20 |
Table S2. Get Full Table List of top 10 genes significantly associated with 'Time to Death' by Cox regression test
| HazardRatio | Wald_P | Q | C_index | |
|---|---|---|---|---|
| VASP|VASP-R-C | 4.3 | 2.018e-11 | 3.3e-09 | 0.637 |
| SRC|SRC_PY527-R-V | 0.54 | 3.171e-11 | 5.2e-09 | 0.37 |
| CDKN1A|P21-R-C | 6.4 | 4.922e-11 | 8.1e-09 | 0.631 |
| GAB2|GAB2-R-V | 0.5 | 8.237e-10 | 1.3e-07 | 0.354 |
| ACACA|ACC1-R-C | 2.6 | 1.397e-09 | 2.3e-07 | 0.626 |
| CTNNA1|ALPHA-CATENIN-M-V | 0.2 | 1.707e-09 | 2.7e-07 | 0.352 |
| MAPK1 MAPK3|MAPK_PT202_Y204-R-V | 0.61 | 2.621e-09 | 4.2e-07 | 0.349 |
| RAD51|RAD51-M-C | 4.1 | 2.664e-09 | 4.2e-07 | 0.633 |
| AR|AR-R-V | 0.32 | 4.642e-09 | 7.3e-07 | 0.346 |
| PRKAA1|AMPK_PT172-R-V | 0.47 | 5.98e-09 | 9.4e-07 | 0.376 |
Figure S1. Get High-res Image As an example, this figure shows the association of VASP|VASP-R-C to 'Time to Death'. four curves present the cumulative survival rates of 4 quartile subsets of patients. P value = 2.02e-11 with univariate Cox regression analysis using continuous log-2 expression values.
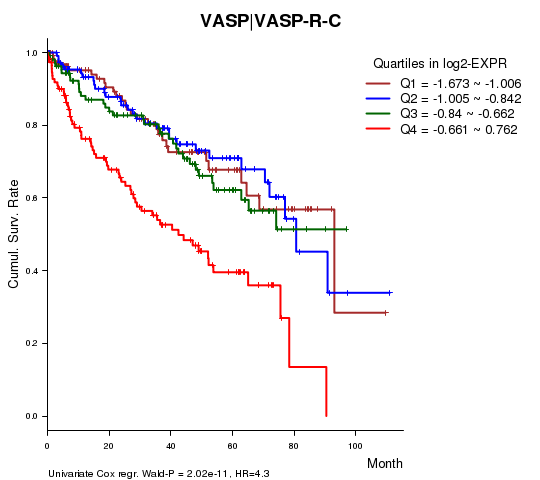
Table S3. Basic characteristics of clinical feature: 'AGE'
| AGE | Mean (SD) | 60.42 (12) |
| Significant markers | N = 1 | |
| pos. correlated | 1 | |
| neg. correlated | 0 |
Table S4. Get Full Table List of one gene significantly correlated to 'AGE' by Spearman correlation test
| SpearmanCorr | corrP | Q | |
|---|---|---|---|
| IGFBP2|IGFBP2-R-V | 0.2273 | 1.014e-06 | 0.000168 |
Figure S2. Get High-res Image As an example, this figure shows the association of IGFBP2|IGFBP2-R-V to 'AGE'. P value = 1.01e-06 with Spearman correlation analysis. The straight line presents the best linear regression.
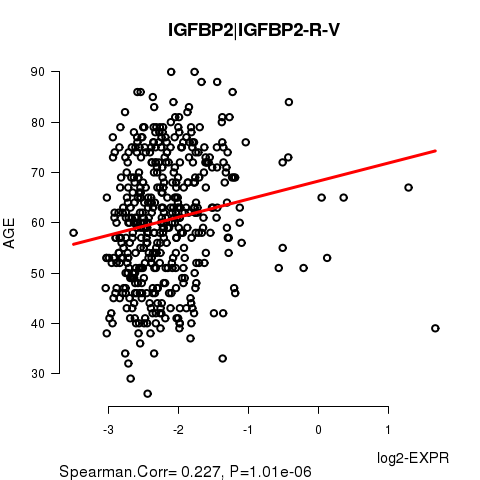
Table S5. Basic characteristics of clinical feature: 'GENDER'
| GENDER | Labels | N |
| FEMALE | 151 | |
| MALE | 303 | |
| Significant markers | N = 4 | |
| Higher in MALE | 2 | |
| Higher in FEMALE | 2 |
Table S6. Get Full Table List of 4 genes differentially expressed by 'GENDER'
| T(pos if higher in 'MALE') | ttestP | Q | AUC | |
|---|---|---|---|---|
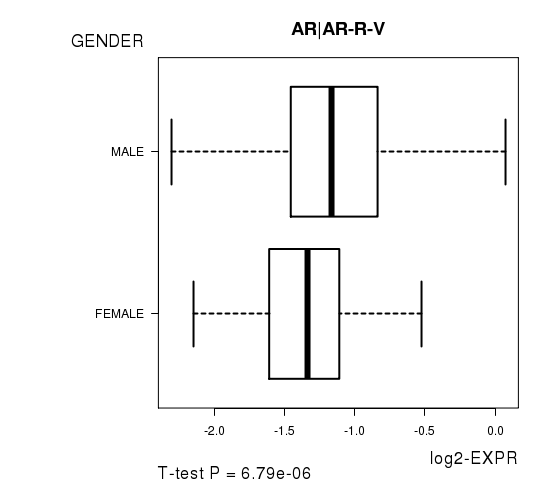
| AR|AR-R-V | 4.57 | 6.794e-06 | 0.00113 | 0.6251 |
| SRC|SRC-M-V | -3.84 | 0.0001525 | 0.0252 | 0.6096 |
| PTK2|FAK-R-C | -3.78 | 0.0001971 | 0.0323 | 0.6063 |
| CLDN7|CLAUDIN-7-R-V | 3.74 | 0.0002208 | 0.036 | 0.6239 |
Figure S3. Get High-res Image As an example, this figure shows the association of AR|AR-R-V to 'GENDER'. P value = 6.79e-06 with T-test analysis.
No gene related to 'KARNOFSKY.PERFORMANCE.SCORE'.
Table S7. Basic characteristics of clinical feature: 'KARNOFSKY.PERFORMANCE.SCORE'
| KARNOFSKY.PERFORMANCE.SCORE | Mean (SD) | 93.53 (7.7) |
| Score | N | |
| 70 | 1 | |
| 80 | 3 | |
| 90 | 13 | |
| 100 | 17 | |
| Significant markers | N = 0 |
Table S8. Basic characteristics of clinical feature: 'PATHOLOGY.T'
| PATHOLOGY.T | Mean (SD) | 1.92 (0.97) |
| N | ||
| T1 | 224 | |
| T2 | 54 | |
| T3 | 165 | |
| T4 | 11 | |
| Significant markers | N = 36 | |
| pos. correlated | 17 | |
| neg. correlated | 19 |
Table S9. Get Full Table List of top 10 genes significantly correlated to 'PATHOLOGY.T' by Spearman correlation test
| SpearmanCorr | corrP | Q | |
|---|---|---|---|
| ERBB3|HER3_PY1298-R-C | -0.3199 | 2.924e-12 | 4.85e-10 |
| CDH3|P-CADHERIN-R-C | 0.3122 | 1.007e-11 | 1.66e-09 |
| SRC|SRC_PY527-R-V | -0.29 | 3.005e-10 | 4.93e-08 |
| EEF2|EEF2-R-V | 0.2873 | 4.478e-10 | 7.3e-08 |
| ACACA|ACC1-R-C | 0.276 | 2.209e-09 | 3.58e-07 |
| SHC1|SHC_PY317-R-NA | -0.2717 | 4.011e-09 | 6.46e-07 |
| CTNNA1|ALPHA-CATENIN-M-V | -0.2703 | 4.814e-09 | 7.7e-07 |
| PECAM1|CD31-M-V | -0.2677 | 6.88e-09 | 1.09e-06 |
| ACACA ACACB|ACC_PS79-R-V | 0.2667 | 7.847e-09 | 1.24e-06 |
| YBX1|YB-1_PS102-R-V | 0.2618 | 1.497e-08 | 2.35e-06 |
Figure S4. Get High-res Image As an example, this figure shows the association of ERBB3|HER3_PY1298-R-C to 'PATHOLOGY.T'. P value = 2.92e-12 with Spearman correlation analysis.
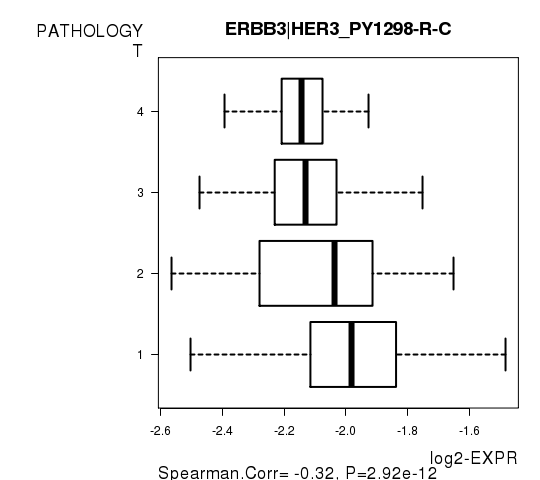
Table S10. Basic characteristics of clinical feature: 'PATHOLOGY.N'
| PATHOLOGY.N | Labels | N |
| N0 | 208 | |
| N1 | 16 | |
| Significant markers | N = 1 | |
| Higher in N1 | 0 | |
| Higher in N0 | 1 |
Table S11. Get Full Table List of one gene differentially expressed by 'PATHOLOGY.N'
| T(pos if higher in 'N1') | ttestP | Q | AUC | |
|---|---|---|---|---|
| EGFR|EGFR_PY1068-R-V | -5.09 | 5.522e-05 | 0.00917 | 0.7713 |
Figure S5. Get High-res Image As an example, this figure shows the association of EGFR|EGFR_PY1068-R-V to 'PATHOLOGY.N'. P value = 5.52e-05 with T-test analysis.
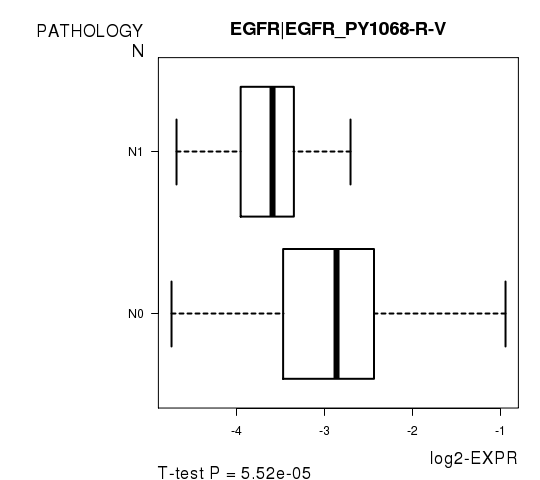
Table S12. Basic characteristics of clinical feature: 'PATHOLOGICSPREAD(M)'
| PATHOLOGICSPREAD(M) | Labels | N |
| M0 | 380 | |
| M1 | 74 | |
| Significant markers | N = 23 | |
| Higher in M1 | 8 | |
| Higher in M0 | 15 |
Table S13. Get Full Table List of top 10 genes differentially expressed by 'PATHOLOGICSPREAD(M)'
| T(pos if higher in 'M1') | ttestP | Q | AUC | |
|---|---|---|---|---|
| ERBB3|HER3_PY1298-R-C | -7.13 | 3.866e-11 | 6.42e-09 | 0.7025 |
| PECAM1|CD31-M-V | -5.32 | 4.663e-07 | 7.69e-05 | 0.6658 |
| YBX1|YB-1-R-V | 5.04 | 1.591e-06 | 0.000261 | 0.6618 |
| MAPK1 MAPK3|MAPK_PT202_Y204-R-V | -5.04 | 1.935e-06 | 0.000315 | 0.6656 |
| TP53BP1|53BP1-R-C | 4.73 | 6.443e-06 | 0.00104 | 0.6734 |
| PIK3R1|PI3K-P85-R-V | 4.72 | 7.989e-06 | 0.00129 | 0.6766 |
| ERRFI1|MIG-6-M-V | -4.62 | 9.093e-06 | 0.00145 | 0.6369 |
| PEA15|PEA-15-R-V | 4.63 | 1.046e-05 | 0.00166 | 0.6642 |
| AKT1 AKT2 AKT3|AKT_PS473-R-V | -4.39 | 2.42e-05 | 0.00382 | 0.6352 |
| EEF2|EEF2-R-V | 4.4 | 2.65e-05 | 0.00416 | 0.6615 |
Figure S6. Get High-res Image As an example, this figure shows the association of ERBB3|HER3_PY1298-R-C to 'PATHOLOGICSPREAD(M)'. P value = 3.87e-11 with T-test analysis.
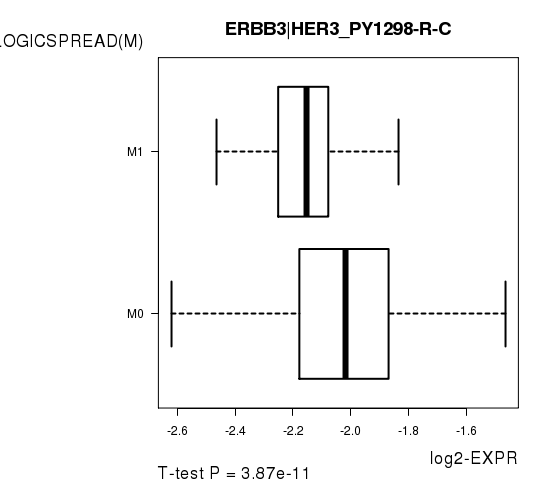
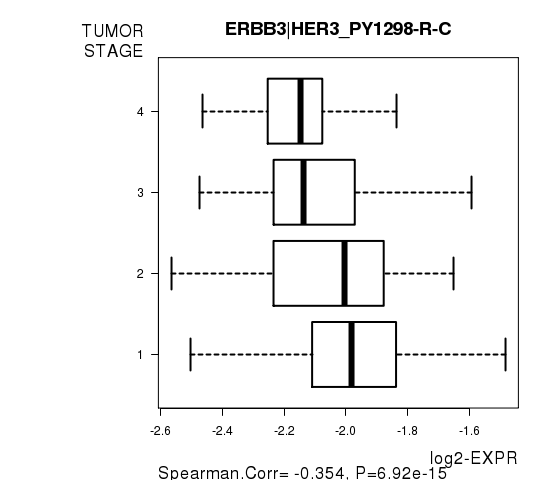
Table S14. Basic characteristics of clinical feature: 'TUMOR.STAGE'
| TUMOR.STAGE | Mean (SD) | 2.11 (1.2) |
| N | ||
| Stage 1 | 219 | |
| Stage 2 | 43 | |
| Stage 3 | 114 | |
| Stage 4 | 78 | |
| Significant markers | N = 42 | |
| pos. correlated | 19 | |
| neg. correlated | 23 |
Table S15. Get Full Table List of top 10 genes significantly correlated to 'TUMOR.STAGE' by Spearman correlation test
| SpearmanCorr | corrP | Q | |
|---|---|---|---|
| ERBB3|HER3_PY1298-R-C | -0.3545 | 6.916e-15 | 1.15e-12 |
| CDH3|P-CADHERIN-R-C | 0.3324 | 3.591e-13 | 5.92e-11 |
| SRC|SRC_PY527-R-V | -0.3104 | 1.343e-11 | 2.2e-09 |
| SHC1|SHC_PY317-R-NA | -0.3068 | 2.381e-11 | 3.88e-09 |
| PECAM1|CD31-M-V | -0.2965 | 1.149e-10 | 1.86e-08 |
| CTNNA1|ALPHA-CATENIN-M-V | -0.2914 | 2.467e-10 | 3.97e-08 |
| MAPK1 MAPK3|MAPK_PT202_Y204-R-V | -0.2831 | 8.191e-10 | 1.31e-07 |
| EEF2|EEF2-R-V | 0.2819 | 9.758e-10 | 1.55e-07 |
| RAF1|C-RAF_PS338-R-C | -0.274 | 2.922e-09 | 4.62e-07 |
| ACACA ACACB|ACC_PS79-R-V | 0.2715 | 4.12e-09 | 6.47e-07 |
Figure S7. Get High-res Image As an example, this figure shows the association of ERBB3|HER3_PY1298-R-C to 'TUMOR.STAGE'. P value = 6.92e-15 with Spearman correlation analysis.
-
Expresson data file = KIRC-TP.rppa.txt
-
Clinical data file = KIRC-TP.clin.merged.picked.txt
-
Number of patients = 454
-
Number of genes = 166
-
Number of clinical features = 8
For survival clinical features, Wald's test in univariate Cox regression analysis with proportional hazards model (Andersen and Gill 1982) was used to estimate the P values using the 'coxph' function in R. Kaplan-Meier survival curves were plot using the four quartile subgroups of patients based on expression levels
For continuous numerical clinical features, Spearman's rank correlation coefficients (Spearman 1904) and two-tailed P values were estimated using 'cor.test' function in R
For two-class clinical features, two-tailed Student's t test with unequal variance (Lehmann and Romano 2005) was applied to compare the log2-expression levels between the two clinical classes using 't.test' function in R
For multiple hypothesis correction, Q value is the False Discovery Rate (FDR) analogue of the P value (Benjamini and Hochberg 1995), defined as the minimum FDR at which the test may be called significant. We used the 'Benjamini and Hochberg' method of 'p.adjust' function in R to convert P values into Q values.
This is an experimental feature. The full results of the analysis summarized in this report can be downloaded from the TCGA Data Coordination Center.