(primary solid tumor cohort)
This pipeline uses various statistical tests to identify miRs whose expression levels correlated to selected clinical features.
Testing the association between 471 genes and 8 clinical features across 481 samples, statistically thresholded by Q value < 0.05, 6 clinical features related to at least one genes.
-
61 genes correlated to 'Time to Death'.
-
HSA-MIR-130B , HSA-MIR-223 , HSA-MIR-21 , HSA-MIR-34C , HSA-MIR-138-1 , ...
-
2 genes correlated to 'AGE'.
-
HSA-MIR-148A , HSA-MIR-590
-
11 genes correlated to 'GENDER'.
-
HSA-MIR-100 , HSA-MIR-455 , HSA-MIR-708 , HSA-MIR-599 , HSA-MIR-30A , ...
-
34 genes correlated to 'PATHOLOGY.T'.
-
HSA-MIR-139 , HSA-MIR-625 , HSA-MIR-21 , HSA-MIR-486 , HSA-MIR-130B , ...
-
17 genes correlated to 'PATHOLOGICSPREAD(M)'.
-
HSA-MIR-193A , HSA-MIR-625 , HSA-MIR-155 , HSA-MIR-130B , HSA-MIR-28 , ...
-
41 genes correlated to 'TUMOR.STAGE'.
-
HSA-MIR-139 , HSA-MIR-21 , HSA-MIR-155 , HSA-MIR-625 , HSA-MIR-144 , ...
-
No genes correlated to 'KARNOFSKY.PERFORMANCE.SCORE', and 'PATHOLOGY.N'.
Complete statistical result table is provided in Supplement Table 1
Table 1. Get Full Table This table shows the clinical features, statistical methods used, and the number of genes that are significantly associated with each clinical feature at Q value < 0.05.
| Clinical feature | Statistical test | Significant genes | Associated with | Associated with | ||
|---|---|---|---|---|---|---|
| Time to Death | Cox regression test | N=61 | shorter survival | N=55 | longer survival | N=6 |
| AGE | Spearman correlation test | N=2 | older | N=2 | younger | N=0 |
| GENDER | t test | N=11 | male | N=4 | female | N=7 |
| KARNOFSKY PERFORMANCE SCORE | Spearman correlation test | N=0 | ||||
| PATHOLOGY T | Spearman correlation test | N=34 | higher pT | N=26 | lower pT | N=8 |
| PATHOLOGY N | t test | N=0 | ||||
| PATHOLOGICSPREAD(M) | t test | N=17 | m1 | N=13 | m0 | N=4 |
| TUMOR STAGE | Spearman correlation test | N=41 | higher stage | N=32 | lower stage | N=9 |
Table S1. Basic characteristics of clinical feature: 'Time to Death'
| Time to Death | Duration (Months) | 0.1-111 (median=35.2) |
| censored | N = 323 | |
| death | N = 155 | |
| Significant markers | N = 61 | |
| associated with shorter survival | 55 | |
| associated with longer survival | 6 |
Table S2. Get Full Table List of top 10 genes significantly associated with 'Time to Death' by Cox regression test
| HazardRatio | Wald_P | Q | C_index | |
|---|---|---|---|---|
| HSA-MIR-130B | 2.1 | 3.075e-14 | 1.4e-11 | 0.669 |
| HSA-MIR-223 | 1.65 | 8.46e-14 | 4e-11 | 0.654 |
| HSA-MIR-21 | 2.1 | 4.472e-10 | 2.1e-07 | 0.66 |
| HSA-MIR-34C | 1.28 | 6.215e-10 | 2.9e-07 | 0.639 |
| HSA-MIR-138-1 | 1.4 | 6.303e-09 | 2.9e-06 | 0.651 |
| HSA-MIR-10B | 0.56 | 2.534e-08 | 1.2e-05 | 0.37 |
| HSA-MIR-18A | 1.54 | 6.379e-08 | 3e-05 | 0.619 |
| HSA-MIR-1248 | 1.39 | 6.748e-08 | 3.1e-05 | 0.614 |
| HSA-MIR-101-1 | 0.55 | 9.998e-08 | 4.6e-05 | 0.395 |
| HSA-MIR-365-2 | 1.62 | 1.371e-07 | 6.3e-05 | 0.621 |
Figure S1. Get High-res Image As an example, this figure shows the association of HSA-MIR-130B to 'Time to Death'. four curves present the cumulative survival rates of 4 quartile subsets of patients. P value = 3.08e-14 with univariate Cox regression analysis using continuous log-2 expression values.
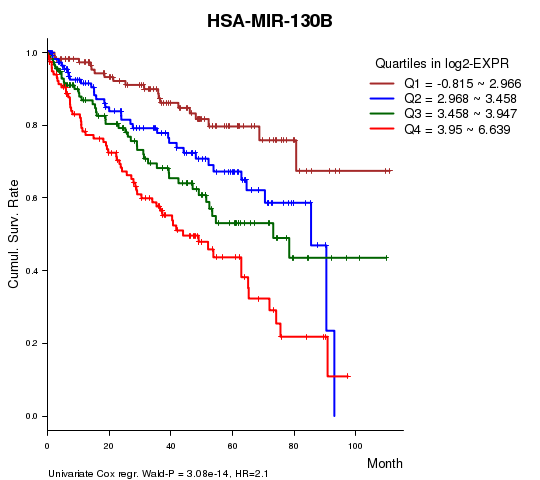
Table S3. Basic characteristics of clinical feature: 'AGE'
| AGE | Mean (SD) | 60.58 (12) |
| Significant markers | N = 2 | |
| pos. correlated | 2 | |
| neg. correlated | 0 |
Table S4. Get Full Table List of 2 genes significantly correlated to 'AGE' by Spearman correlation test
| SpearmanCorr | corrP | Q | |
|---|---|---|---|
| HSA-MIR-148A | 0.1836 | 5.117e-05 | 0.0241 |
| HSA-MIR-590 | 0.1811 | 6.484e-05 | 0.0305 |
Figure S2. Get High-res Image As an example, this figure shows the association of HSA-MIR-148A to 'AGE'. P value = 5.12e-05 with Spearman correlation analysis. The straight line presents the best linear regression.
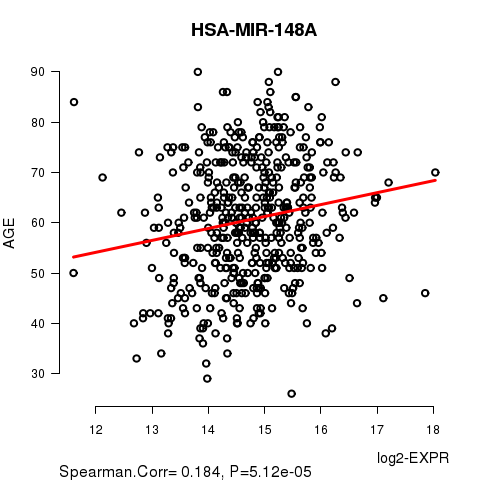
Table S5. Basic characteristics of clinical feature: 'GENDER'
| GENDER | Labels | N |
| FEMALE | 163 | |
| MALE | 318 | |
| Significant markers | N = 11 | |
| Higher in MALE | 4 | |
| Higher in FEMALE | 7 |
Table S6. Get Full Table List of top 10 genes differentially expressed by 'GENDER'
| T(pos if higher in 'MALE') | ttestP | Q | AUC | |
|---|---|---|---|---|
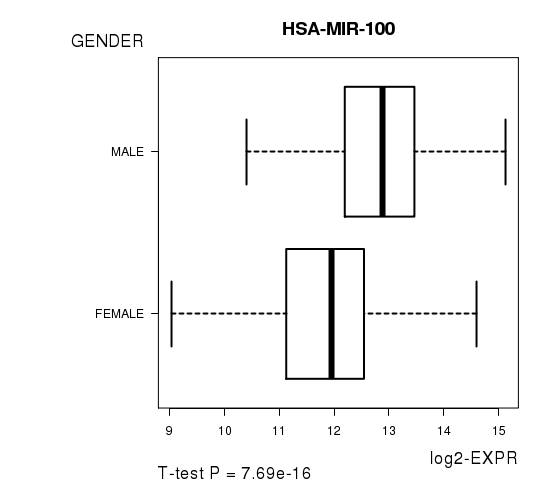
| HSA-MIR-100 | 8.52 | 7.686e-16 | 3.62e-13 | 0.7408 |
| HSA-MIR-455 | -5.21 | 3.138e-07 | 0.000147 | 0.6516 |
| HSA-MIR-708 | 5.23 | 3.139e-07 | 0.000147 | 0.6531 |
| HSA-MIR-599 | -5.09 | 6.767e-07 | 0.000317 | 0.6722 |
| HSA-MIR-30A | -4.35 | 1.742e-05 | 0.00813 | 0.6136 |
| HSA-MIR-30C-2 | -4.33 | 2.037e-05 | 0.00949 | 0.6143 |
| HSA-MIR-500B | -4.3 | 2.236e-05 | 0.0104 | 0.6197 |
| HSA-MIR-31 | 4.08 | 5.754e-05 | 0.0267 | 0.621 |
| HSA-MIR-3934 | 4.07 | 6.518e-05 | 0.0302 | 0.6302 |
| HSA-MIR-204 | -4.04 | 6.707e-05 | 0.031 | 0.6355 |
Figure S3. Get High-res Image As an example, this figure shows the association of HSA-MIR-100 to 'GENDER'. P value = 7.69e-16 with T-test analysis.
No gene related to 'KARNOFSKY.PERFORMANCE.SCORE'.
Table S7. Basic characteristics of clinical feature: 'KARNOFSKY.PERFORMANCE.SCORE'
| KARNOFSKY.PERFORMANCE.SCORE | Mean (SD) | 88.33 (23) |
| Score | N | |
| 0 | 2 | |
| 70 | 1 | |
| 80 | 3 | |
| 90 | 13 | |
| 100 | 17 | |
| Significant markers | N = 0 |
Table S8. Basic characteristics of clinical feature: 'PATHOLOGY.T'
| PATHOLOGY.T | Mean (SD) | 1.93 (0.97) |
| N | ||
| T1 | 233 | |
| T2 | 62 | |
| T3 | 175 | |
| T4 | 11 | |
| Significant markers | N = 34 | |
| pos. correlated | 26 | |
| neg. correlated | 8 |
Table S9. Get Full Table List of top 10 genes significantly correlated to 'PATHOLOGY.T' by Spearman correlation test
| SpearmanCorr | corrP | Q | |
|---|---|---|---|
| HSA-MIR-139 | -0.3349 | 4.563e-14 | 2.15e-11 |
| HSA-MIR-625 | 0.2826 | 2.768e-10 | 1.3e-07 |
| HSA-MIR-21 | 0.2786 | 5.071e-10 | 2.38e-07 |
| HSA-MIR-486 | -0.2608 | 6.415e-09 | 3e-06 |
| HSA-MIR-130B | 0.2606 | 6.563e-09 | 3.06e-06 |
| HSA-MIR-155 | 0.2551 | 1.398e-08 | 6.51e-06 |
| HSA-MIR-144 | -0.2488 | 3.23e-08 | 1.5e-05 |
| HSA-MIR-9-2 | 0.2312 | 2.959e-07 | 0.000137 |
| HSA-MIR-451 | -0.2277 | 4.478e-07 | 0.000207 |
| HSA-MIR-9-1 | 0.227 | 4.868e-07 | 0.000225 |
Figure S4. Get High-res Image As an example, this figure shows the association of HSA-MIR-139 to 'PATHOLOGY.T'. P value = 4.56e-14 with Spearman correlation analysis.
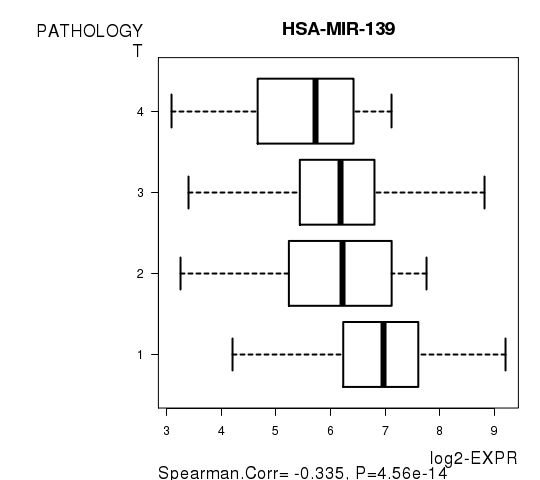
Table S10. Basic characteristics of clinical feature: 'PATHOLOGY.N'
| PATHOLOGY.N | Labels | N |
| N0 | 222 | |
| N1 | 18 | |
| Significant markers | N = 0 |
Table S11. Basic characteristics of clinical feature: 'PATHOLOGICSPREAD(M)'
| PATHOLOGICSPREAD(M) | Labels | N |
| M0 | 405 | |
| M1 | 76 | |
| Significant markers | N = 17 | |
| Higher in M1 | 13 | |
| Higher in M0 | 4 |
Table S12. Get Full Table List of top 10 genes differentially expressed by 'PATHOLOGICSPREAD(M)'
| T(pos if higher in 'M1') | ttestP | Q | AUC | |
|---|---|---|---|---|
| HSA-MIR-193A | 5.84 | 2.409e-08 | 1.13e-05 | 0.6498 |
| HSA-MIR-625 | 5.47 | 3.19e-07 | 0.00015 | 0.6889 |
| HSA-MIR-155 | 5.35 | 4.693e-07 | 0.00022 | 0.686 |
| HSA-MIR-130B | 5.29 | 5.697e-07 | 0.000267 | 0.6714 |
| HSA-MIR-28 | 5.17 | 1.011e-06 | 0.000472 | 0.6609 |
| HSA-MIR-27A | 5.06 | 1.363e-06 | 0.000635 | 0.6356 |
| HSA-MIR-144 | -5.13 | 1.365e-06 | 0.000635 | 0.6829 |
| HSA-MIR-106B | 4.98 | 1.792e-06 | 0.000831 | 0.6551 |
| HSA-MIR-139 | -4.73 | 7.165e-06 | 0.00332 | 0.668 |
| HSA-MIR-21 | 4.66 | 8.186e-06 | 0.00378 | 0.6443 |
Figure S5. Get High-res Image As an example, this figure shows the association of HSA-MIR-193A to 'PATHOLOGICSPREAD(M)'. P value = 2.41e-08 with T-test analysis.
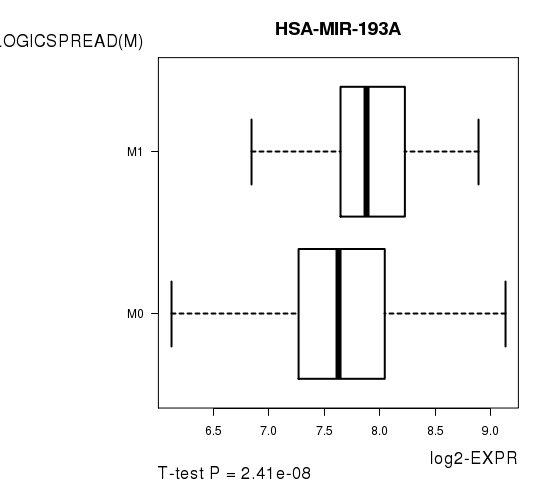
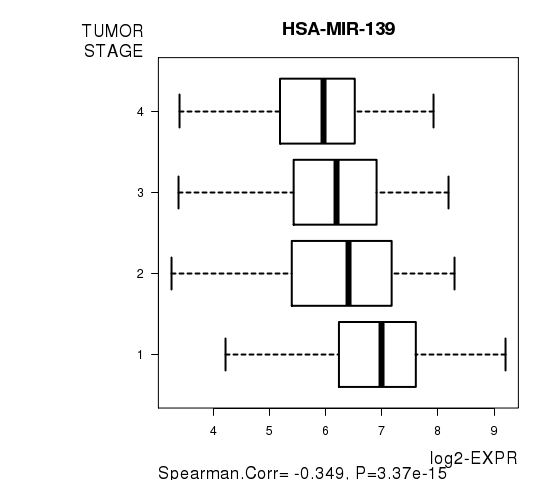
Table S13. Basic characteristics of clinical feature: 'TUMOR.STAGE'
| TUMOR.STAGE | Mean (SD) | 2.11 (1.2) |
| N | ||
| Stage 1 | 229 | |
| Stage 2 | 50 | |
| Stage 3 | 122 | |
| Stage 4 | 80 | |
| Significant markers | N = 41 | |
| pos. correlated | 32 | |
| neg. correlated | 9 |
Table S14. Get Full Table List of top 10 genes significantly correlated to 'TUMOR.STAGE' by Spearman correlation test
| SpearmanCorr | corrP | Q | |
|---|---|---|---|
| HSA-MIR-139 | -0.3487 | 3.374e-15 | 1.59e-12 |
| HSA-MIR-21 | 0.283 | 2.604e-10 | 1.22e-07 |
| HSA-MIR-155 | 0.2814 | 3.341e-10 | 1.57e-07 |
| HSA-MIR-625 | 0.2807 | 3.697e-10 | 1.73e-07 |
| HSA-MIR-144 | -0.2756 | 7.829e-10 | 3.66e-07 |
| HSA-MIR-486 | -0.275 | 8.559e-10 | 3.99e-07 |
| HSA-MIR-451 | -0.2538 | 1.652e-08 | 7.68e-06 |
| HSA-MIR-130B | 0.2496 | 2.872e-08 | 1.33e-05 |
| HSA-MIR-9-2 | 0.2379 | 1.299e-07 | 6.01e-05 |
| HSA-MIR-142 | 0.2345 | 1.977e-07 | 9.13e-05 |
Figure S6. Get High-res Image As an example, this figure shows the association of HSA-MIR-139 to 'TUMOR.STAGE'. P value = 3.37e-15 with Spearman correlation analysis.
-
Expresson data file = KIRC-TP.miRseq_RPKM_log2.txt
-
Clinical data file = KIRC-TP.clin.merged.picked.txt
-
Number of patients = 481
-
Number of genes = 471
-
Number of clinical features = 8
For survival clinical features, Wald's test in univariate Cox regression analysis with proportional hazards model (Andersen and Gill 1982) was used to estimate the P values using the 'coxph' function in R. Kaplan-Meier survival curves were plot using the four quartile subgroups of patients based on expression levels
For continuous numerical clinical features, Spearman's rank correlation coefficients (Spearman 1904) and two-tailed P values were estimated using 'cor.test' function in R
For two-class clinical features, two-tailed Student's t test with unequal variance (Lehmann and Romano 2005) was applied to compare the log2-expression levels between the two clinical classes using 't.test' function in R
For multiple hypothesis correction, Q value is the False Discovery Rate (FDR) analogue of the P value (Benjamini and Hochberg 1995), defined as the minimum FDR at which the test may be called significant. We used the 'Benjamini and Hochberg' method of 'p.adjust' function in R to convert P values into Q values.
This is an experimental feature. The full results of the analysis summarized in this report can be downloaded from the TCGA Data Coordination Center.