(primary blood tumor (peripheral) cohort)
This pipeline uses various statistical tests to identify genes whose promoter methylation levels correlated to selected clinical features.
Testing the association between 16403 genes and 3 clinical features across 169 samples, statistically thresholded by Q value < 0.05, 3 clinical features related to at least one genes.
-
2 genes correlated to 'Time to Death'.
-
AGRN , C10ORF128
-
51 genes correlated to 'AGE'.
-
JAKMIP1 , TMEM20 , KIAA1377 , DENND2C , TBC1D12 , ...
-
7 genes correlated to 'GENDER'.
-
FAM35A , AP2B1 , DKFZP434L187 , KIF4B , CROCC , ...
Complete statistical result table is provided in Supplement Table 1
Table 1. Get Full Table This table shows the clinical features, statistical methods used, and the number of genes that are significantly associated with each clinical feature at Q value < 0.05.
| Clinical feature | Statistical test | Significant genes | Associated with | Associated with | ||
|---|---|---|---|---|---|---|
| Time to Death | Cox regression test | N=2 | shorter survival | N=1 | longer survival | N=1 |
| AGE | Spearman correlation test | N=51 | older | N=7 | younger | N=44 |
| GENDER | t test | N=7 | male | N=3 | female | N=4 |
Table S1. Basic characteristics of clinical feature: 'Time to Death'
| Time to Death | Duration (Months) | 0.9-94.1 (median=12) |
| censored | N = 56 | |
| death | N = 89 | |
| Significant markers | N = 2 | |
| associated with shorter survival | 1 | |
| associated with longer survival | 1 |
Table S2. Get Full Table List of 2 genes significantly associated with 'Time to Death' by Cox regression test
| HazardRatio | Wald_P | Q | C_index | |
|---|---|---|---|---|
| AGRN | 49000001 | 5.388e-08 | 0.00088 | 0.542 |
| C10ORF128 | 0.13 | 1.953e-06 | 0.032 | 0.379 |
Figure S1. Get High-res Image As an example, this figure shows the association of AGRN to 'Time to Death'. four curves present the cumulative survival rates of 4 quartile subsets of patients. P value = 5.39e-08 with univariate Cox regression analysis using continuous log-2 expression values.
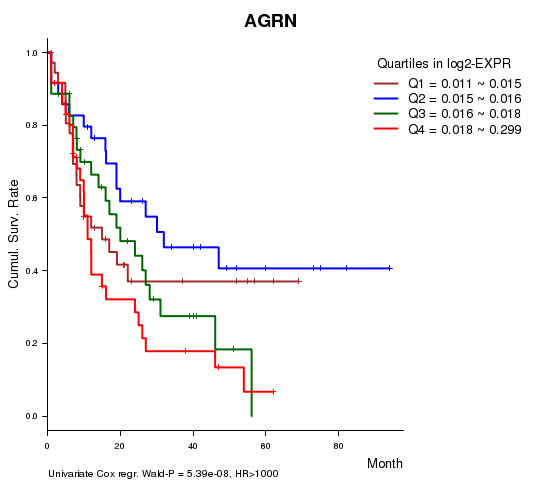
Table S3. Basic characteristics of clinical feature: 'AGE'
| AGE | Mean (SD) | 55.38 (16) |
| Significant markers | N = 51 | |
| pos. correlated | 7 | |
| neg. correlated | 44 |
Table S4. Get Full Table List of top 10 genes significantly correlated to 'AGE' by Spearman correlation test
| SpearmanCorr | corrP | Q | |
|---|---|---|---|
| JAKMIP1 | -0.4888 | 1.562e-11 | 2.56e-07 |
| TMEM20 | -0.4812 | 3.546e-11 | 5.82e-07 |
| KIAA1377 | -0.4477 | 1.042e-09 | 1.71e-05 |
| DENND2C | -0.4249 | 8.506e-09 | 0.000139 |
| TBC1D12 | -0.416 | 1.864e-08 | 0.000306 |
| CD96 | 0.4045 | 4.918e-08 | 0.000806 |
| CBLN3 | -0.3976 | 8.63e-08 | 0.00141 |
| KHNYN | -0.3976 | 8.63e-08 | 0.00141 |
| SCN3B | -0.395 | 1.072e-07 | 0.00176 |
| AASS | -0.3933 | 1.227e-07 | 0.00201 |
Figure S2. Get High-res Image As an example, this figure shows the association of JAKMIP1 to 'AGE'. P value = 1.56e-11 with Spearman correlation analysis. The straight line presents the best linear regression.
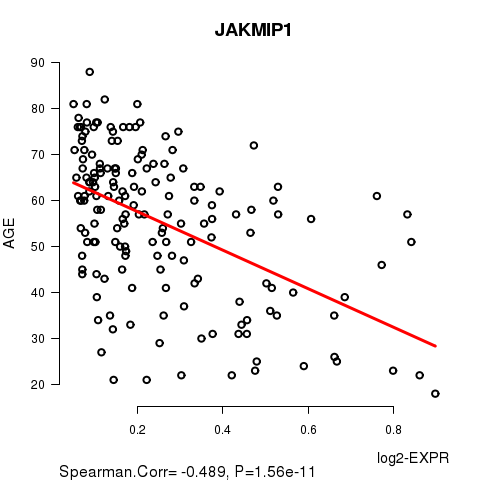
Table S5. Basic characteristics of clinical feature: 'GENDER'
| GENDER | Labels | N |
| FEMALE | 79 | |
| MALE | 90 | |
| Significant markers | N = 7 | |
| Higher in MALE | 3 | |
| Higher in FEMALE | 4 |
Table S6. Get Full Table List of 7 genes differentially expressed by 'GENDER'
| T(pos if higher in 'MALE') | ttestP | Q | AUC | |
|---|---|---|---|---|
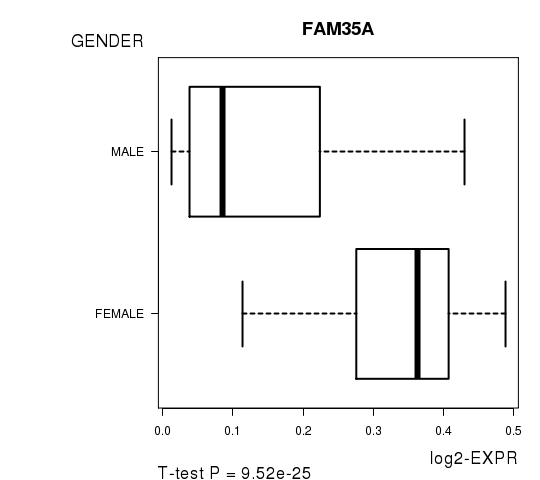
| FAM35A | -12.21 | 9.524e-25 | 1.56e-20 | 0.8895 |
| AP2B1 | -11.45 | 2.264e-22 | 3.71e-18 | 0.8904 |
| DKFZP434L187 | 11.05 | 2.352e-21 | 3.86e-17 | 0.9304 |
| KIF4B | -10.96 | 1.176e-20 | 1.93e-16 | 0.8591 |
| CROCC | -9.83 | 3.226e-18 | 5.29e-14 | 0.8857 |
| LOC389791 | 5.32 | 3.266e-07 | 0.00536 | 0.7158 |
| ATP5J | 4.91 | 2.338e-06 | 0.0383 | 0.7331 |
Figure S3. Get High-res Image As an example, this figure shows the association of FAM35A to 'GENDER'. P value = 9.52e-25 with T-test analysis.
-
Expresson data file = LAML-TB.meth.for_correlation.filtered_data.txt
-
Clinical data file = LAML-TB.clin.merged.picked.txt
-
Number of patients = 169
-
Number of genes = 16403
-
Number of clinical features = 3
For survival clinical features, Wald's test in univariate Cox regression analysis with proportional hazards model (Andersen and Gill 1982) was used to estimate the P values using the 'coxph' function in R. Kaplan-Meier survival curves were plot using the four quartile subgroups of patients based on expression levels
For continuous numerical clinical features, Spearman's rank correlation coefficients (Spearman 1904) and two-tailed P values were estimated using 'cor.test' function in R
For two-class clinical features, two-tailed Student's t test with unequal variance (Lehmann and Romano 2005) was applied to compare the log2-expression levels between the two clinical classes using 't.test' function in R
For multiple hypothesis correction, Q value is the False Discovery Rate (FDR) analogue of the P value (Benjamini and Hochberg 1995), defined as the minimum FDR at which the test may be called significant. We used the 'Benjamini and Hochberg' method of 'p.adjust' function in R to convert P values into Q values.
This is an experimental feature. The full results of the analysis summarized in this report can be downloaded from the TCGA Data Coordination Center.