(primary blood tumor (peripheral) cohort)
This pipeline computes the correlation between significantly recurrent gene mutations and selected clinical features.
Testing the association between mutation status of 24 genes and 3 clinical features across 197 patients, 5 significant findings detected with Q value < 0.25.
-
DNMT3A mutation correlated to 'Time to Death'.
-
IDH2 mutation correlated to 'AGE'.
-
U2AF1 mutation correlated to 'AGE'.
-
TP53 mutation correlated to 'Time to Death' and 'AGE'.
Table 1. Get Full Table Overview of the association between mutation status of 24 genes and 3 clinical features. Shown in the table are P values (Q values). Thresholded by Q value < 0.25, 5 significant findings detected.
|
Clinical Features |
Time to Death |
AGE | GENDER | ||
| nMutated (%) | nWild-Type | logrank test | t-test | Fisher's exact test | |
| TP53 | 15 (8%) | 182 |
1.22e-05 (0.000844) |
0.000379 (0.0257) |
0.177 (1.00) |
| DNMT3A | 51 (26%) | 146 |
0.00051 (0.0342) |
0.061 (1.00) |
0.328 (1.00) |
| IDH2 | 20 (10%) | 177 |
0.463 (1.00) |
1.02e-05 (0.000713) |
0.814 (1.00) |
| U2AF1 | 8 (4%) | 189 |
0.63 (1.00) |
0.00134 (0.0885) |
0.0711 (1.00) |
| NRAS | 15 (8%) | 182 |
0.834 (1.00) |
0.282 (1.00) |
1 (1.00) |
| WT1 | 12 (6%) | 185 |
0.713 (1.00) |
0.181 (1.00) |
0.776 (1.00) |
| RUNX1 | 18 (9%) | 179 |
0.0531 (1.00) |
0.0378 (1.00) |
0.623 (1.00) |
| FLT3 | 56 (28%) | 141 |
0.095 (1.00) |
0.582 (1.00) |
0.753 (1.00) |
| IDH1 | 19 (10%) | 178 |
0.794 (1.00) |
0.312 (1.00) |
0.632 (1.00) |
| NPM1 | 54 (27%) | 143 |
0.124 (1.00) |
0.99 (1.00) |
0.204 (1.00) |
| KRAS | 8 (4%) | 189 |
0.429 (1.00) |
0.0741 (1.00) |
0.147 (1.00) |
| PTPN11 | 9 (5%) | 188 |
0.406 (1.00) |
0.42 (1.00) |
1 (1.00) |
| TET2 | 17 (9%) | 180 |
0.704 (1.00) |
0.106 (1.00) |
0.316 (1.00) |
| KIT | 8 (4%) | 189 |
0.593 (1.00) |
0.541 (1.00) |
0.475 (1.00) |
| PHF6 | 6 (3%) | 191 |
0.857 (1.00) |
0.232 (1.00) |
0.0316 (1.00) |
| SMC1A | 7 (4%) | 190 |
0.119 (1.00) |
0.0645 (1.00) |
0.126 (1.00) |
| SMC3 | 7 (4%) | 190 |
0.0624 (1.00) |
0.658 (1.00) |
0.706 (1.00) |
| RAD21 | 5 (3%) | 192 |
0.988 (1.00) |
0.288 (1.00) |
1 (1.00) |
| STAG2 | 6 (3%) | 191 |
0.415 (1.00) |
0.1 (1.00) |
0.418 (1.00) |
| FAM5C | 5 (3%) | 192 |
0.114 (1.00) |
0.0454 (1.00) |
0.376 (1.00) |
| EZH2 | 3 (2%) | 194 |
0.116 (1.00) |
1 (1.00) |
|
| ASXL1 | 5 (3%) | 192 |
0.186 (1.00) |
0.0643 (1.00) |
0.664 (1.00) |
| PHACTR1 | 3 (2%) | 194 |
0.359 (1.00) |
0.887 (1.00) |
0.596 (1.00) |
| DIS3 | 3 (2%) | 194 |
0.726 (1.00) |
0.596 (1.00) |
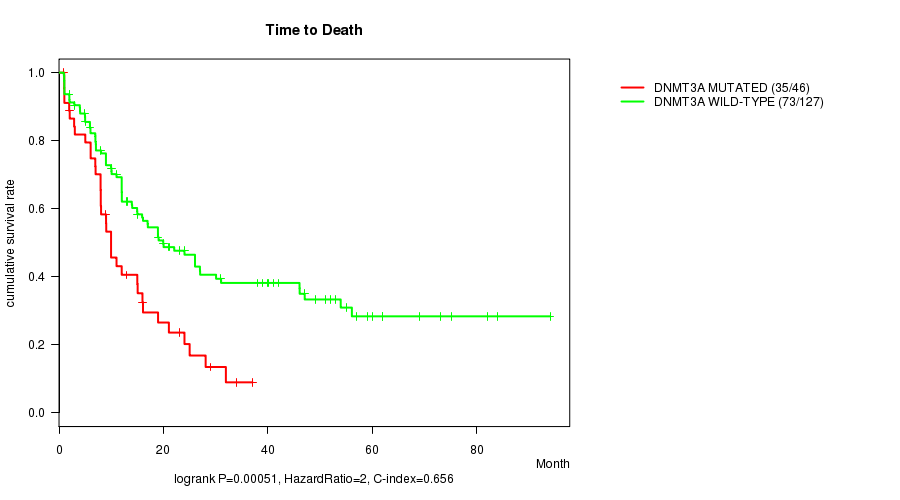
P value = 0.00051 (logrank test), Q value = 0.034
Table S1. Gene #4: 'DNMT3A MUTATION STATUS' versus Clinical Feature #1: 'Time to Death'
| nPatients | nDeath | Duration Range (Median), Month | |
|---|---|---|---|
| ALL | 173 | 108 | 0.9 - 94.1 (12.0) |
| DNMT3A MUTATED | 46 | 35 | 0.9 - 37.0 (9.0) |
| DNMT3A WILD-TYPE | 127 | 73 | 0.9 - 94.1 (15.0) |
Figure S1. Get High-res Image Gene #4: 'DNMT3A MUTATION STATUS' versus Clinical Feature #1: 'Time to Death'
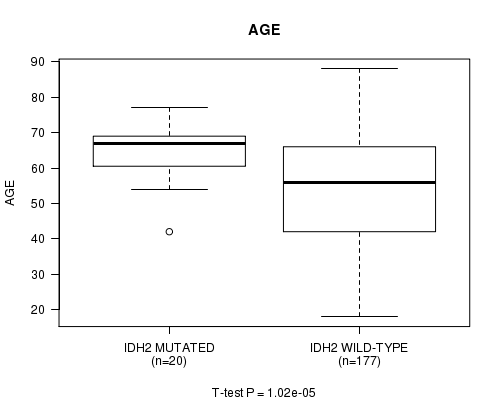
P value = 1.02e-05 (t-test), Q value = 0.00071
Table S2. Gene #7: 'IDH2 MUTATION STATUS' versus Clinical Feature #2: 'AGE'
| nPatients | Mean (Std.Dev) | |
|---|---|---|
| ALL | 197 | 55.0 (16.2) |
| IDH2 MUTATED | 20 | 64.8 (8.0) |
| IDH2 WILD-TYPE | 177 | 53.9 (16.5) |
Figure S2. Get High-res Image Gene #7: 'IDH2 MUTATION STATUS' versus Clinical Feature #2: 'AGE'
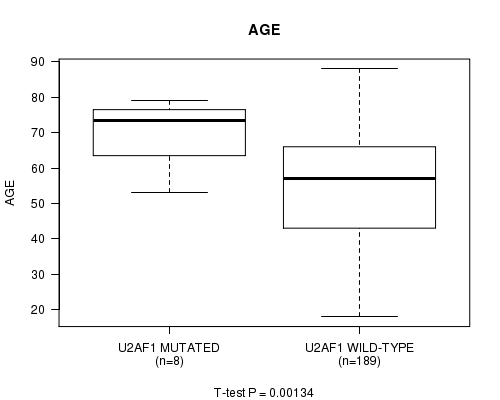
P value = 0.00134 (t-test), Q value = 0.088
Table S3. Gene #9: 'U2AF1 MUTATION STATUS' versus Clinical Feature #2: 'AGE'
| nPatients | Mean (Std.Dev) | |
|---|---|---|
| ALL | 197 | 55.0 (16.2) |
| U2AF1 MUTATED | 8 | 69.9 (9.0) |
| U2AF1 WILD-TYPE | 189 | 54.4 (16.1) |
Figure S3. Get High-res Image Gene #9: 'U2AF1 MUTATION STATUS' versus Clinical Feature #2: 'AGE'
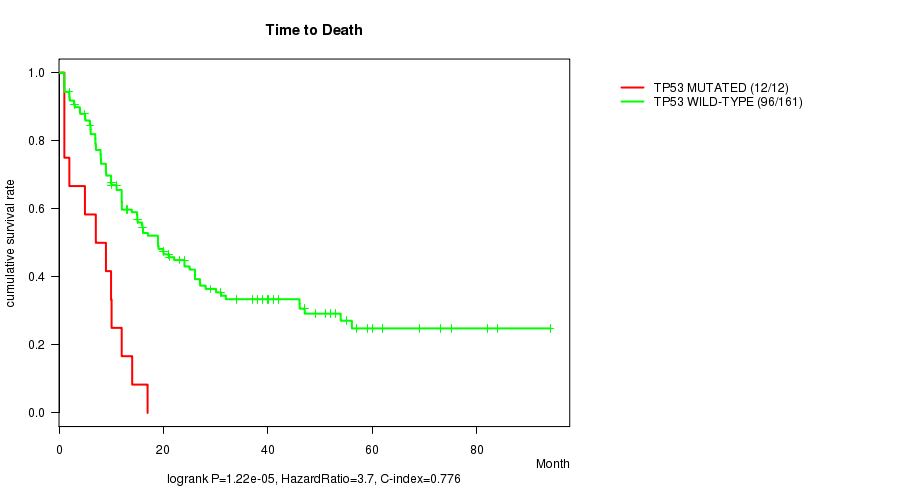
P value = 1.22e-05 (logrank test), Q value = 0.00084
Table S4. Gene #10: 'TP53 MUTATION STATUS' versus Clinical Feature #1: 'Time to Death'
| nPatients | nDeath | Duration Range (Median), Month | |
|---|---|---|---|
| ALL | 173 | 108 | 0.9 - 94.1 (12.0) |
| TP53 MUTATED | 12 | 12 | 1.0 - 17.0 (8.0) |
| TP53 WILD-TYPE | 161 | 96 | 0.9 - 94.1 (13.0) |
Figure S4. Get High-res Image Gene #10: 'TP53 MUTATION STATUS' versus Clinical Feature #1: 'Time to Death'
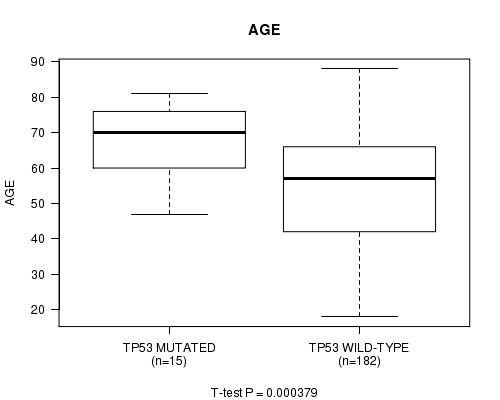
P value = 0.000379 (t-test), Q value = 0.026
Table S5. Gene #10: 'TP53 MUTATION STATUS' versus Clinical Feature #2: 'AGE'
| nPatients | Mean (Std.Dev) | |
|---|---|---|
| ALL | 197 | 55.0 (16.2) |
| TP53 MUTATED | 15 | 66.9 (10.7) |
| TP53 WILD-TYPE | 182 | 54.1 (16.2) |
Figure S5. Get High-res Image Gene #10: 'TP53 MUTATION STATUS' versus Clinical Feature #2: 'AGE'
-
Mutation data file = LAML-TB.mutsig.cluster.txt
-
Clinical data file = LAML-TB.clin.merged.picked.txt
-
Number of patients = 197
-
Number of significantly mutated genes = 24
-
Number of selected clinical features = 3
-
Exclude genes that fewer than K tumors have mutations, K = 3
For survival clinical features, the Kaplan-Meier survival curves of tumors with and without gene mutations were plotted and the statistical significance P values were estimated by logrank test (Bland and Altman 2004) using the 'survdiff' function in R
For continuous numerical clinical features, two-tailed Student's t test with unequal variance (Lehmann and Romano 2005) was applied to compare the clinical values between tumors with and without gene mutations using 't.test' function in R
For binary or multi-class clinical features (nominal or ordinal), two-tailed Fisher's exact tests (Fisher 1922) were used to estimate the P values using the 'fisher.test' function in R
For multiple hypothesis correction, Q value is the False Discovery Rate (FDR) analogue of the P value (Benjamini and Hochberg 1995), defined as the minimum FDR at which the test may be called significant. We used the 'Benjamini and Hochberg' method of 'p.adjust' function in R to convert P values into Q values.
This is an experimental feature. The full results of the analysis summarized in this report can be downloaded from the TCGA Data Coordination Center.