(primary blood tumor (peripheral) cohort)
This pipeline computes the correlation between significant arm-level copy number variations (cnvs) and subtypes.
Testing the association between copy number variation 22 arm-level results and 6 molecular subtypes across 191 patients, 20 significant findings detected with Q value < 0.25.
-
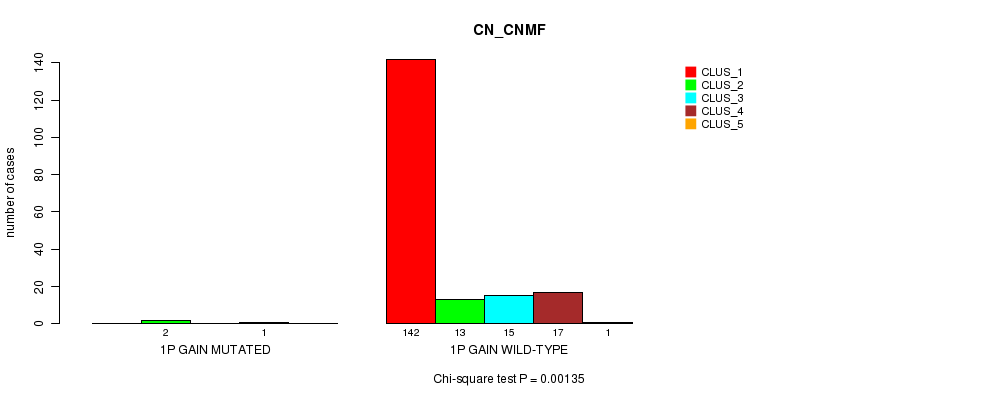
1p gain cnv correlated to 'CN_CNMF'.
-
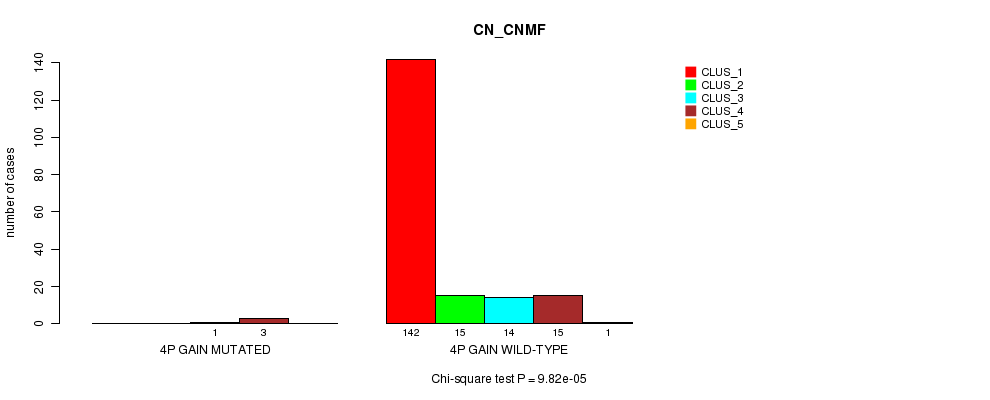
4p gain cnv correlated to 'CN_CNMF'.
-
4q gain cnv correlated to 'CN_CNMF'.
-
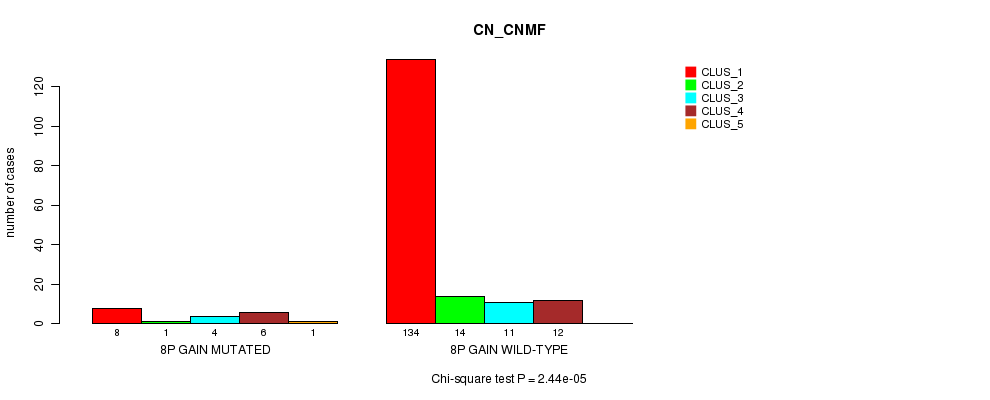
8p gain cnv correlated to 'CN_CNMF'.
-
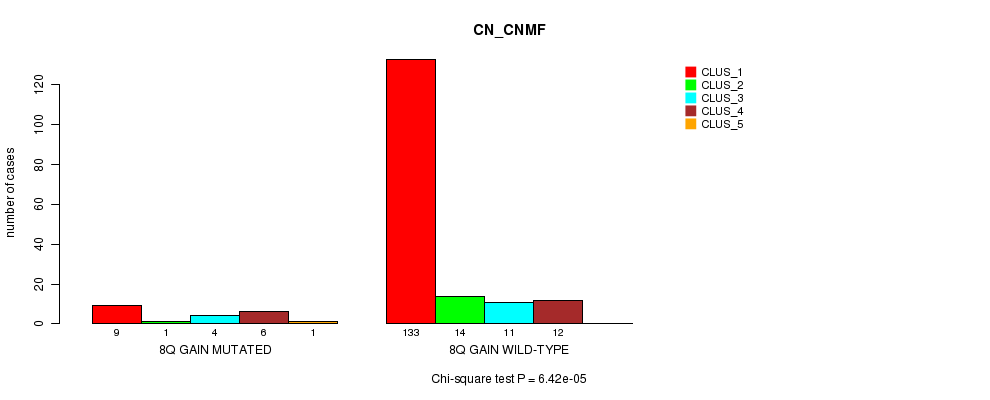
8q gain cnv correlated to 'CN_CNMF'.
-
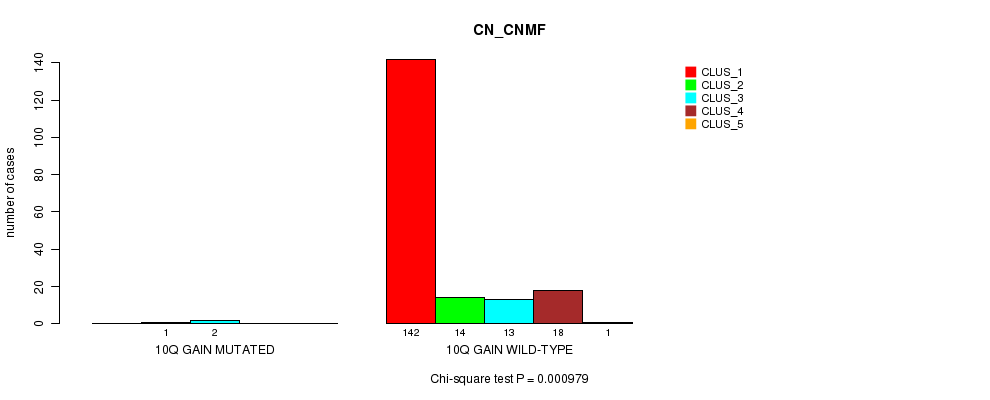
10q gain cnv correlated to 'CN_CNMF'.
-
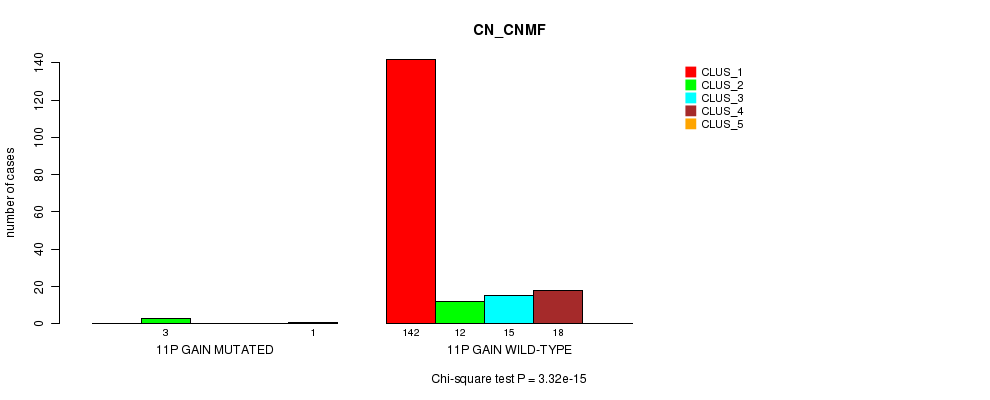
11p gain cnv correlated to 'CN_CNMF'.
-
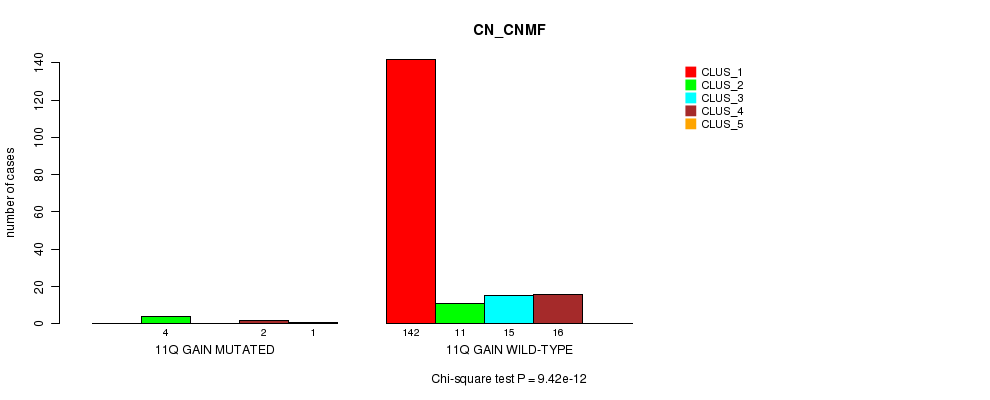
11q gain cnv correlated to 'CN_CNMF'.
-
17q gain cnv correlated to 'CN_CNMF'.
-
21q gain cnv correlated to 'CN_CNMF'.
-
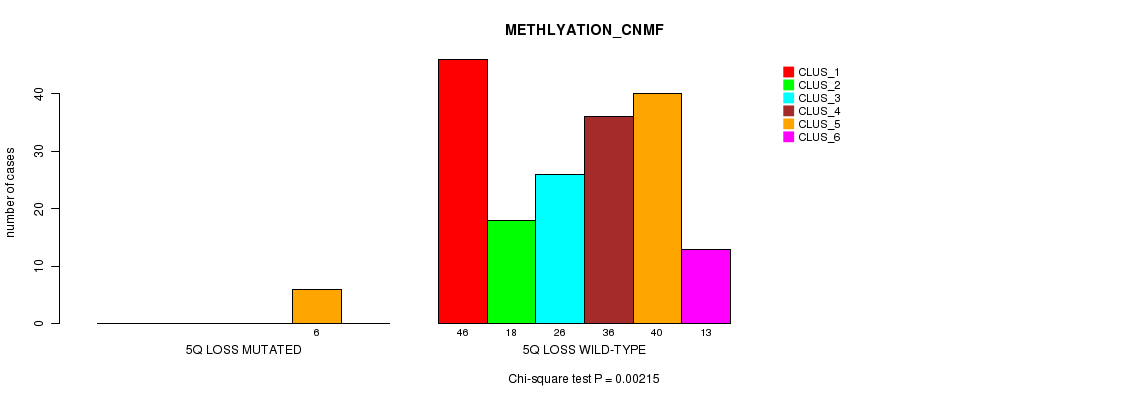
5q loss cnv correlated to 'CN_CNMF' and 'METHLYATION_CNMF'.
-
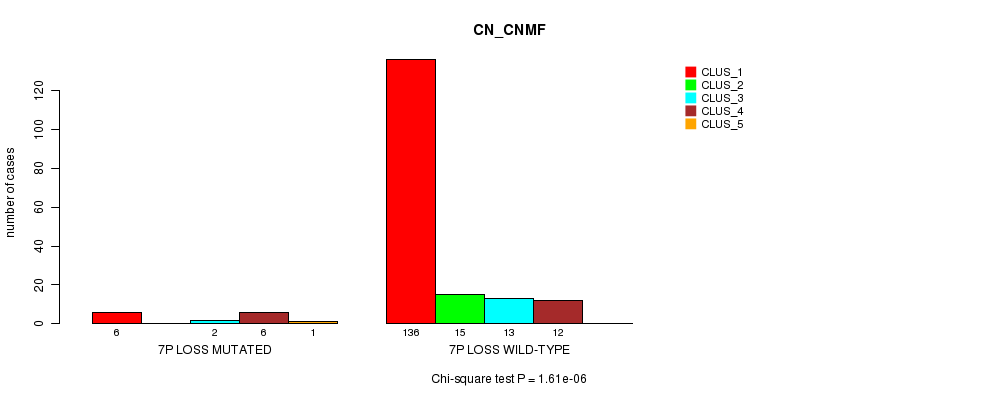
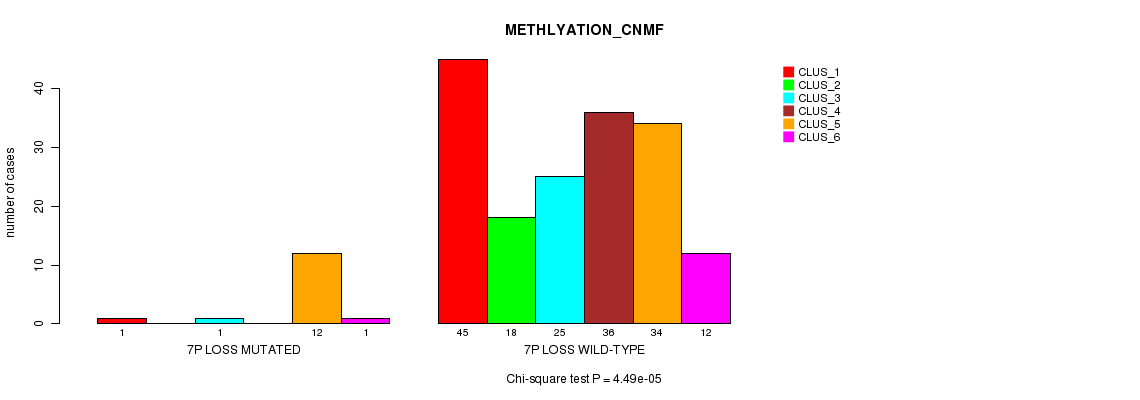
7p loss cnv correlated to 'CN_CNMF' and 'METHLYATION_CNMF'.
-
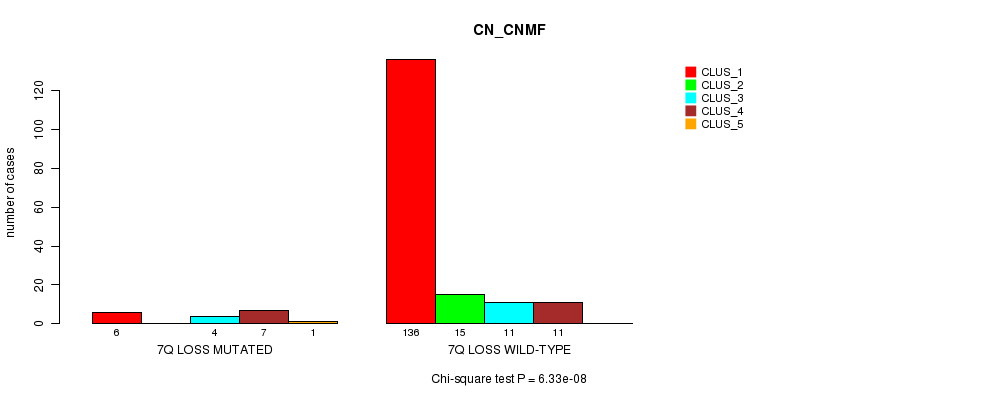
7q loss cnv correlated to 'CN_CNMF' and 'METHLYATION_CNMF'.
-
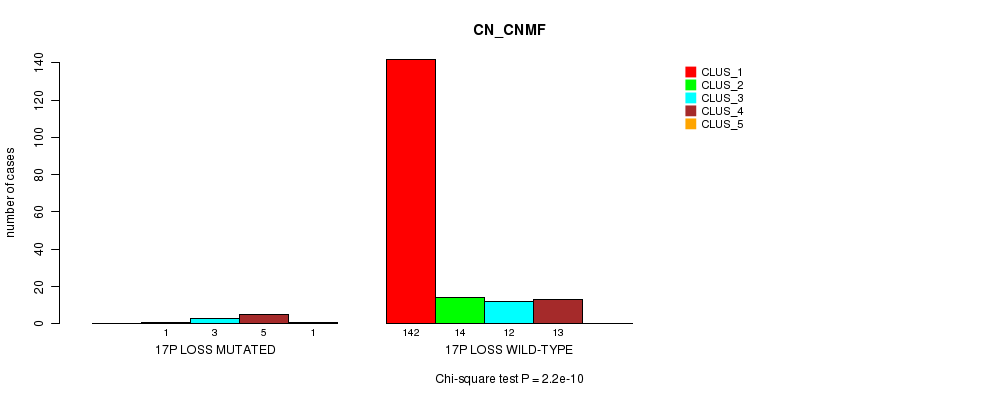
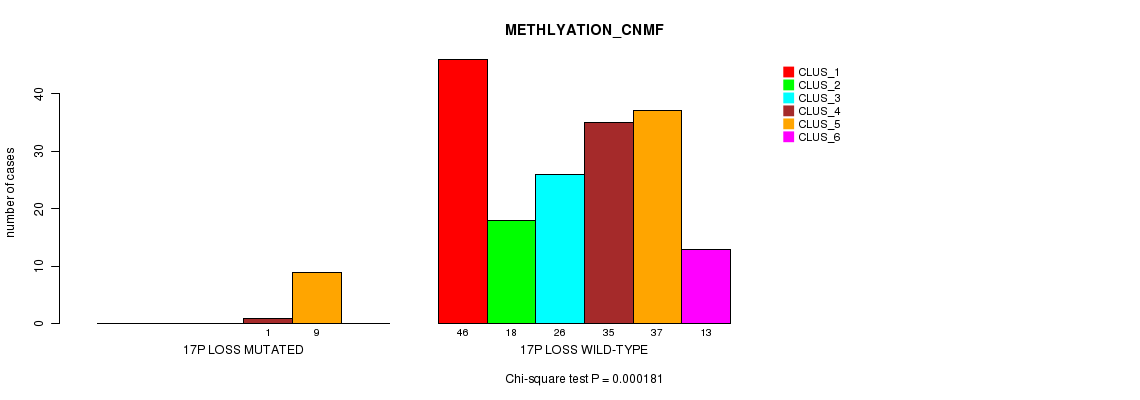
17p loss cnv correlated to 'CN_CNMF' and 'METHLYATION_CNMF'.
-
17q loss cnv correlated to 'CN_CNMF'.
-
18p loss cnv correlated to 'CN_CNMF'.
Table 1. Get Full Table Overview of the association between significant copy number variation of 22 arm-level results and 6 molecular subtypes. Shown in the table are P values (Q values). Thresholded by Q value < 0.25, 20 significant findings detected.
|
Molecular subtypes |
CN CNMF |
METHLYATION CNMF |
MRNASEQ CNMF |
MRNASEQ CHIERARCHICAL |
MIRSEQ CNMF |
MIRSEQ CHIERARCHICAL |
||
| nCNV (%) | nWild-Type | Chi-square test | Chi-square test | Fisher's exact test | Fisher's exact test | Fisher's exact test | Fisher's exact test | |
| 5q loss | 6 (3%) | 185 |
6.1e-11 (7.75e-09) |
0.00215 (0.239) |
0.224 (1.00) |
0.664 (1.00) |
0.0202 (1.00) |
0.022 (1.00) |
| 7p loss | 15 (8%) | 176 |
1.61e-06 (0.000197) |
4.49e-05 (0.00535) |
0.00277 (0.305) |
0.00279 (0.305) |
0.00845 (0.816) |
0.00711 (0.704) |
| 7q loss | 18 (9%) | 173 |
6.33e-08 (7.86e-06) |
5.19e-07 (6.38e-05) |
0.0272 (1.00) |
0.0211 (1.00) |
0.00337 (0.358) |
0.00338 (0.358) |
| 17p loss | 10 (5%) | 181 |
2.2e-10 (2.77e-08) |
0.000181 (0.0206) |
0.0752 (1.00) |
0.167 (1.00) |
0.0144 (1.00) |
0.00495 (0.5) |
| 1p gain | 3 (2%) | 188 |
0.00135 (0.152) |
0.101 (1.00) |
0.186 (1.00) |
0.552 (1.00) |
0.147 (1.00) |
0.094 (1.00) |
| 4p gain | 4 (2%) | 187 |
9.82e-05 (0.0114) |
0.383 (1.00) |
0.55 (1.00) |
0.142 (1.00) |
0.825 (1.00) |
|
| 4q gain | 4 (2%) | 187 |
9.82e-05 (0.0114) |
0.383 (1.00) |
0.55 (1.00) |
0.142 (1.00) |
0.825 (1.00) |
|
| 8p gain | 20 (10%) | 171 |
2.44e-05 (0.00293) |
0.0504 (1.00) |
0.0674 (1.00) |
0.0126 (1.00) |
0.0611 (1.00) |
0.0617 (1.00) |
| 8q gain | 21 (11%) | 170 |
6.42e-05 (0.00751) |
0.0999 (1.00) |
0.0434 (1.00) |
0.0125 (1.00) |
0.115 (1.00) |
0.0937 (1.00) |
| 10q gain | 3 (2%) | 188 |
0.000979 (0.111) |
0.439 (1.00) |
0.186 (1.00) |
0.552 (1.00) |
0.79 (1.00) |
0.227 (1.00) |
| 11p gain | 4 (2%) | 187 |
3.32e-15 (4.29e-13) |
0.263 (1.00) |
0.467 (1.00) |
1 (1.00) |
0.343 (1.00) |
0.0737 (1.00) |
| 11q gain | 7 (4%) | 184 |
9.42e-12 (1.21e-09) |
0.0104 (0.991) |
0.0668 (1.00) |
0.425 (1.00) |
0.278 (1.00) |
0.371 (1.00) |
| 17q gain | 3 (2%) | 188 |
6.81e-06 (0.000825) |
0.529 (1.00) |
1 (1.00) |
0.552 (1.00) |
0.452 (1.00) |
0.227 (1.00) |
| 21q gain | 8 (4%) | 183 |
2.62e-15 (3.41e-13) |
0.454 (1.00) |
0.124 (1.00) |
1 (1.00) |
0.197 (1.00) |
0.2 (1.00) |
| 17q loss | 5 (3%) | 186 |
4.94e-10 (6.18e-08) |
0.00833 (0.816) |
0.224 (1.00) |
0.664 (1.00) |
0.00632 (0.632) |
0.00322 (0.345) |
| 18p loss | 5 (3%) | 186 |
5.17e-05 (0.00611) |
0.00833 (0.816) |
1 (1.00) |
1 (1.00) |
0.343 (1.00) |
0.423 (1.00) |
| 13q gain | 3 (2%) | 188 |
0.00355 (0.369) |
0.101 (1.00) |
0.186 (1.00) |
0.552 (1.00) |
0.452 (1.00) |
0.227 (1.00) |
| 19p gain | 5 (3%) | 186 |
0.0342 (1.00) |
0.772 (1.00) |
1 (1.00) |
1 (1.00) |
0.511 (1.00) |
0.521 (1.00) |
| 19q gain | 5 (3%) | 186 |
0.0342 (1.00) |
0.772 (1.00) |
1 (1.00) |
1 (1.00) |
0.511 (1.00) |
0.521 (1.00) |
| 22q gain | 8 (4%) | 183 |
0.00406 (0.414) |
0.00288 (0.311) |
0.0349 (1.00) |
0.269 (1.00) |
0.167 (1.00) |
0.0822 (1.00) |
| 12p loss | 3 (2%) | 188 |
0.0191 (1.00) |
0.431 (1.00) |
0.618 (1.00) |
0.552 (1.00) |
0.79 (1.00) |
0.227 (1.00) |
| 18q loss | 3 (2%) | 188 |
0.00355 (0.369) |
0.101 (1.00) |
0.786 (1.00) |
1 (1.00) |
0.0841 (1.00) |
0.094 (1.00) |
P value = 0.00135 (Chi-square test), Q value = 0.15
Table S1. Gene #1: '1p gain mutation analysis' versus Clinical Feature #1: 'CN_CNMF'
| nPatients | CLUS_1 | CLUS_2 | CLUS_3 | CLUS_4 | CLUS_5 |
|---|---|---|---|---|---|
| ALL | 142 | 15 | 15 | 18 | 1 |
| 1P GAIN MUTATED | 0 | 2 | 0 | 1 | 0 |
| 1P GAIN WILD-TYPE | 142 | 13 | 15 | 17 | 1 |
Figure S1. Get High-res Image Gene #1: '1p gain mutation analysis' versus Clinical Feature #1: 'CN_CNMF'
P value = 9.82e-05 (Chi-square test), Q value = 0.011
Table S2. Gene #2: '4p gain mutation analysis' versus Clinical Feature #1: 'CN_CNMF'
| nPatients | CLUS_1 | CLUS_2 | CLUS_3 | CLUS_4 | CLUS_5 |
|---|---|---|---|---|---|
| ALL | 142 | 15 | 15 | 18 | 1 |
| 4P GAIN MUTATED | 0 | 0 | 1 | 3 | 0 |
| 4P GAIN WILD-TYPE | 142 | 15 | 14 | 15 | 1 |
Figure S2. Get High-res Image Gene #2: '4p gain mutation analysis' versus Clinical Feature #1: 'CN_CNMF'
P value = 9.82e-05 (Chi-square test), Q value = 0.011
Table S3. Gene #3: '4q gain mutation analysis' versus Clinical Feature #1: 'CN_CNMF'
| nPatients | CLUS_1 | CLUS_2 | CLUS_3 | CLUS_4 | CLUS_5 |
|---|---|---|---|---|---|
| ALL | 142 | 15 | 15 | 18 | 1 |
| 4Q GAIN MUTATED | 0 | 0 | 1 | 3 | 0 |
| 4Q GAIN WILD-TYPE | 142 | 15 | 14 | 15 | 1 |
Figure S3. Get High-res Image Gene #3: '4q gain mutation analysis' versus Clinical Feature #1: 'CN_CNMF'

P value = 2.44e-05 (Chi-square test), Q value = 0.0029
Table S4. Gene #4: '8p gain mutation analysis' versus Clinical Feature #1: 'CN_CNMF'
| nPatients | CLUS_1 | CLUS_2 | CLUS_3 | CLUS_4 | CLUS_5 |
|---|---|---|---|---|---|
| ALL | 142 | 15 | 15 | 18 | 1 |
| 8P GAIN MUTATED | 8 | 1 | 4 | 6 | 1 |
| 8P GAIN WILD-TYPE | 134 | 14 | 11 | 12 | 0 |
Figure S4. Get High-res Image Gene #4: '8p gain mutation analysis' versus Clinical Feature #1: 'CN_CNMF'
P value = 6.42e-05 (Chi-square test), Q value = 0.0075
Table S5. Gene #5: '8q gain mutation analysis' versus Clinical Feature #1: 'CN_CNMF'
| nPatients | CLUS_1 | CLUS_2 | CLUS_3 | CLUS_4 | CLUS_5 |
|---|---|---|---|---|---|
| ALL | 142 | 15 | 15 | 18 | 1 |
| 8Q GAIN MUTATED | 9 | 1 | 4 | 6 | 1 |
| 8Q GAIN WILD-TYPE | 133 | 14 | 11 | 12 | 0 |
Figure S5. Get High-res Image Gene #5: '8q gain mutation analysis' versus Clinical Feature #1: 'CN_CNMF'
P value = 0.000979 (Chi-square test), Q value = 0.11
Table S6. Gene #6: '10q gain mutation analysis' versus Clinical Feature #1: 'CN_CNMF'
| nPatients | CLUS_1 | CLUS_2 | CLUS_3 | CLUS_4 | CLUS_5 |
|---|---|---|---|---|---|
| ALL | 142 | 15 | 15 | 18 | 1 |
| 10Q GAIN MUTATED | 0 | 1 | 2 | 0 | 0 |
| 10Q GAIN WILD-TYPE | 142 | 14 | 13 | 18 | 1 |
Figure S6. Get High-res Image Gene #6: '10q gain mutation analysis' versus Clinical Feature #1: 'CN_CNMF'
P value = 3.32e-15 (Chi-square test), Q value = 4.3e-13
Table S7. Gene #7: '11p gain mutation analysis' versus Clinical Feature #1: 'CN_CNMF'
| nPatients | CLUS_1 | CLUS_2 | CLUS_3 | CLUS_4 | CLUS_5 |
|---|---|---|---|---|---|
| ALL | 142 | 15 | 15 | 18 | 1 |
| 11P GAIN MUTATED | 0 | 3 | 0 | 0 | 1 |
| 11P GAIN WILD-TYPE | 142 | 12 | 15 | 18 | 0 |
Figure S7. Get High-res Image Gene #7: '11p gain mutation analysis' versus Clinical Feature #1: 'CN_CNMF'
P value = 9.42e-12 (Chi-square test), Q value = 1.2e-09
Table S8. Gene #8: '11q gain mutation analysis' versus Clinical Feature #1: 'CN_CNMF'
| nPatients | CLUS_1 | CLUS_2 | CLUS_3 | CLUS_4 | CLUS_5 |
|---|---|---|---|---|---|
| ALL | 142 | 15 | 15 | 18 | 1 |
| 11Q GAIN MUTATED | 0 | 4 | 0 | 2 | 1 |
| 11Q GAIN WILD-TYPE | 142 | 11 | 15 | 16 | 0 |
Figure S8. Get High-res Image Gene #8: '11q gain mutation analysis' versus Clinical Feature #1: 'CN_CNMF'
P value = 6.81e-06 (Chi-square test), Q value = 0.00082
Table S9. Gene #10: '17q gain mutation analysis' versus Clinical Feature #1: 'CN_CNMF'
| nPatients | CLUS_1 | CLUS_2 | CLUS_3 | CLUS_4 | CLUS_5 |
|---|---|---|---|---|---|
| ALL | 142 | 15 | 15 | 18 | 1 |
| 17Q GAIN MUTATED | 0 | 0 | 0 | 3 | 0 |
| 17Q GAIN WILD-TYPE | 142 | 15 | 15 | 15 | 1 |
Figure S9. Get High-res Image Gene #10: '17q gain mutation analysis' versus Clinical Feature #1: 'CN_CNMF'

P value = 2.62e-15 (Chi-square test), Q value = 3.4e-13
Table S10. Gene #13: '21q gain mutation analysis' versus Clinical Feature #1: 'CN_CNMF'
| nPatients | CLUS_1 | CLUS_2 | CLUS_3 | CLUS_4 | CLUS_5 |
|---|---|---|---|---|---|
| ALL | 142 | 15 | 15 | 18 | 1 |
| 21Q GAIN MUTATED | 0 | 0 | 7 | 1 | 0 |
| 21Q GAIN WILD-TYPE | 142 | 15 | 8 | 17 | 1 |
Figure S10. Get High-res Image Gene #13: '21q gain mutation analysis' versus Clinical Feature #1: 'CN_CNMF'

P value = 6.1e-11 (Chi-square test), Q value = 7.7e-09
Table S11. Gene #15: '5q loss mutation analysis' versus Clinical Feature #1: 'CN_CNMF'
| nPatients | CLUS_1 | CLUS_2 | CLUS_3 | CLUS_4 | CLUS_5 |
|---|---|---|---|---|---|
| ALL | 142 | 15 | 15 | 18 | 1 |
| 5Q LOSS MUTATED | 0 | 0 | 3 | 2 | 1 |
| 5Q LOSS WILD-TYPE | 142 | 15 | 12 | 16 | 0 |
Figure S11. Get High-res Image Gene #15: '5q loss mutation analysis' versus Clinical Feature #1: 'CN_CNMF'

P value = 0.00215 (Chi-square test), Q value = 0.24
Table S12. Gene #15: '5q loss mutation analysis' versus Clinical Feature #2: 'METHLYATION_CNMF'
| nPatients | CLUS_1 | CLUS_2 | CLUS_3 | CLUS_4 | CLUS_5 | CLUS_6 |
|---|---|---|---|---|---|---|
| ALL | 46 | 18 | 26 | 36 | 46 | 13 |
| 5Q LOSS MUTATED | 0 | 0 | 0 | 0 | 6 | 0 |
| 5Q LOSS WILD-TYPE | 46 | 18 | 26 | 36 | 40 | 13 |
Figure S12. Get High-res Image Gene #15: '5q loss mutation analysis' versus Clinical Feature #2: 'METHLYATION_CNMF'
P value = 1.61e-06 (Chi-square test), Q value = 2e-04
Table S13. Gene #16: '7p loss mutation analysis' versus Clinical Feature #1: 'CN_CNMF'
| nPatients | CLUS_1 | CLUS_2 | CLUS_3 | CLUS_4 | CLUS_5 |
|---|---|---|---|---|---|
| ALL | 142 | 15 | 15 | 18 | 1 |
| 7P LOSS MUTATED | 6 | 0 | 2 | 6 | 1 |
| 7P LOSS WILD-TYPE | 136 | 15 | 13 | 12 | 0 |
Figure S13. Get High-res Image Gene #16: '7p loss mutation analysis' versus Clinical Feature #1: 'CN_CNMF'
P value = 4.49e-05 (Chi-square test), Q value = 0.0053
Table S14. Gene #16: '7p loss mutation analysis' versus Clinical Feature #2: 'METHLYATION_CNMF'
| nPatients | CLUS_1 | CLUS_2 | CLUS_3 | CLUS_4 | CLUS_5 | CLUS_6 |
|---|---|---|---|---|---|---|
| ALL | 46 | 18 | 26 | 36 | 46 | 13 |
| 7P LOSS MUTATED | 1 | 0 | 1 | 0 | 12 | 1 |
| 7P LOSS WILD-TYPE | 45 | 18 | 25 | 36 | 34 | 12 |
Figure S14. Get High-res Image Gene #16: '7p loss mutation analysis' versus Clinical Feature #2: 'METHLYATION_CNMF'
P value = 6.33e-08 (Chi-square test), Q value = 7.9e-06
Table S15. Gene #17: '7q loss mutation analysis' versus Clinical Feature #1: 'CN_CNMF'
| nPatients | CLUS_1 | CLUS_2 | CLUS_3 | CLUS_4 | CLUS_5 |
|---|---|---|---|---|---|
| ALL | 142 | 15 | 15 | 18 | 1 |
| 7Q LOSS MUTATED | 6 | 0 | 4 | 7 | 1 |
| 7Q LOSS WILD-TYPE | 136 | 15 | 11 | 11 | 0 |
Figure S15. Get High-res Image Gene #17: '7q loss mutation analysis' versus Clinical Feature #1: 'CN_CNMF'
P value = 5.19e-07 (Chi-square test), Q value = 6.4e-05
Table S16. Gene #17: '7q loss mutation analysis' versus Clinical Feature #2: 'METHLYATION_CNMF'
| nPatients | CLUS_1 | CLUS_2 | CLUS_3 | CLUS_4 | CLUS_5 | CLUS_6 |
|---|---|---|---|---|---|---|
| ALL | 46 | 18 | 26 | 36 | 46 | 13 |
| 7Q LOSS MUTATED | 1 | 0 | 1 | 0 | 15 | 1 |
| 7Q LOSS WILD-TYPE | 45 | 18 | 25 | 36 | 31 | 12 |
Figure S16. Get High-res Image Gene #17: '7q loss mutation analysis' versus Clinical Feature #2: 'METHLYATION_CNMF'

P value = 2.2e-10 (Chi-square test), Q value = 2.8e-08
Table S17. Gene #19: '17p loss mutation analysis' versus Clinical Feature #1: 'CN_CNMF'
| nPatients | CLUS_1 | CLUS_2 | CLUS_3 | CLUS_4 | CLUS_5 |
|---|---|---|---|---|---|
| ALL | 142 | 15 | 15 | 18 | 1 |
| 17P LOSS MUTATED | 0 | 1 | 3 | 5 | 1 |
| 17P LOSS WILD-TYPE | 142 | 14 | 12 | 13 | 0 |
Figure S17. Get High-res Image Gene #19: '17p loss mutation analysis' versus Clinical Feature #1: 'CN_CNMF'
P value = 0.000181 (Chi-square test), Q value = 0.021
Table S18. Gene #19: '17p loss mutation analysis' versus Clinical Feature #2: 'METHLYATION_CNMF'
| nPatients | CLUS_1 | CLUS_2 | CLUS_3 | CLUS_4 | CLUS_5 | CLUS_6 |
|---|---|---|---|---|---|---|
| ALL | 46 | 18 | 26 | 36 | 46 | 13 |
| 17P LOSS MUTATED | 0 | 0 | 0 | 1 | 9 | 0 |
| 17P LOSS WILD-TYPE | 46 | 18 | 26 | 35 | 37 | 13 |
Figure S18. Get High-res Image Gene #19: '17p loss mutation analysis' versus Clinical Feature #2: 'METHLYATION_CNMF'
P value = 4.94e-10 (Chi-square test), Q value = 6.2e-08
Table S19. Gene #20: '17q loss mutation analysis' versus Clinical Feature #1: 'CN_CNMF'
| nPatients | CLUS_1 | CLUS_2 | CLUS_3 | CLUS_4 | CLUS_5 |
|---|---|---|---|---|---|
| ALL | 142 | 15 | 15 | 18 | 1 |
| 17Q LOSS MUTATED | 0 | 1 | 2 | 1 | 1 |
| 17Q LOSS WILD-TYPE | 142 | 14 | 13 | 17 | 0 |
Figure S19. Get High-res Image Gene #20: '17q loss mutation analysis' versus Clinical Feature #1: 'CN_CNMF'

P value = 5.17e-05 (Chi-square test), Q value = 0.0061
Table S20. Gene #21: '18p loss mutation analysis' versus Clinical Feature #1: 'CN_CNMF'
| nPatients | CLUS_1 | CLUS_2 | CLUS_3 | CLUS_4 | CLUS_5 |
|---|---|---|---|---|---|
| ALL | 142 | 15 | 15 | 18 | 1 |
| 18P LOSS MUTATED | 0 | 0 | 2 | 3 | 0 |
| 18P LOSS WILD-TYPE | 142 | 15 | 13 | 15 | 1 |
Figure S20. Get High-res Image Gene #21: '18p loss mutation analysis' versus Clinical Feature #1: 'CN_CNMF'

-
Mutation data file = broad_values_by_arm.mutsig.cluster.txt
-
Molecular subtypes file = LAML-TB.transferedmergedcluster.txt
-
Number of patients = 191
-
Number of significantly arm-level cnvs = 22
-
Number of molecular subtypes = 6
-
Exclude genes that fewer than K tumors have mutations, K = 3
For multi-class clinical features (nominal or ordinal), Chi-square tests (Greenwood and Nikulin 1996) were used to estimate the P values using the 'chisq.test' function in R
For binary or multi-class clinical features (nominal or ordinal), two-tailed Fisher's exact tests (Fisher 1922) were used to estimate the P values using the 'fisher.test' function in R
For multiple hypothesis correction, Q value is the False Discovery Rate (FDR) analogue of the P value (Benjamini and Hochberg 1995), defined as the minimum FDR at which the test may be called significant. We used the 'Benjamini and Hochberg' method of 'p.adjust' function in R to convert P values into Q values.
This is an experimental feature. The full results of the analysis summarized in this report can be downloaded from the TCGA Data Coordination Center.