(primary solid tumor cohort)
This pipeline computes the correlation between significant copy number variation (cnv focal) genes and selected clinical features.
Testing the association between copy number variation 43 arm-level results and 7 clinical features across 207 patients, 14 significant findings detected with Q value < 0.25.
-
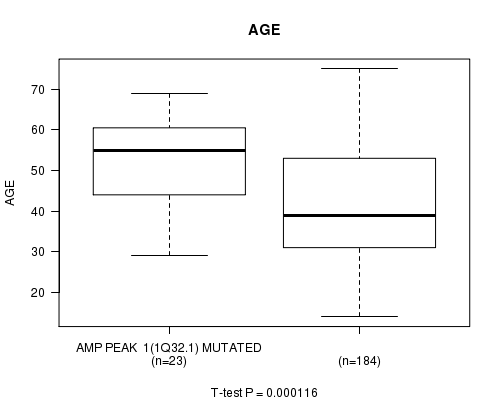
Amp Peak 1(1q32.1) cnv correlated to 'AGE'.
-
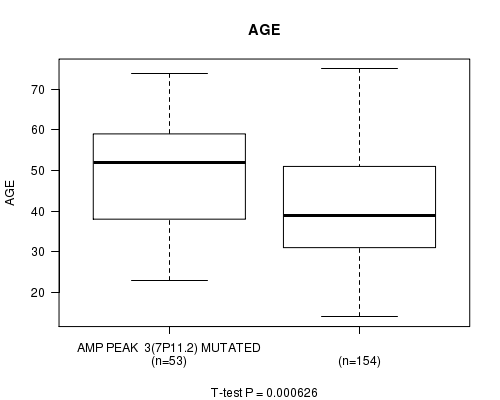
Amp Peak 3(7p11.2) cnv correlated to 'AGE'.
-
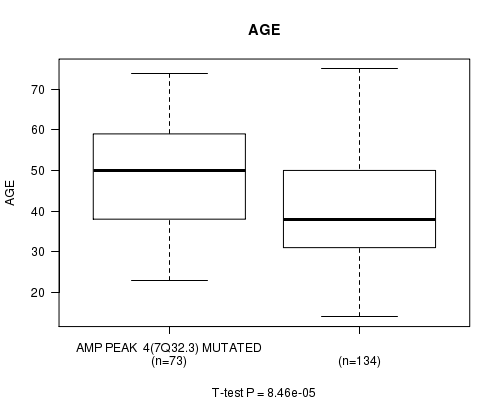
Amp Peak 4(7q32.3) cnv correlated to 'AGE'.
-
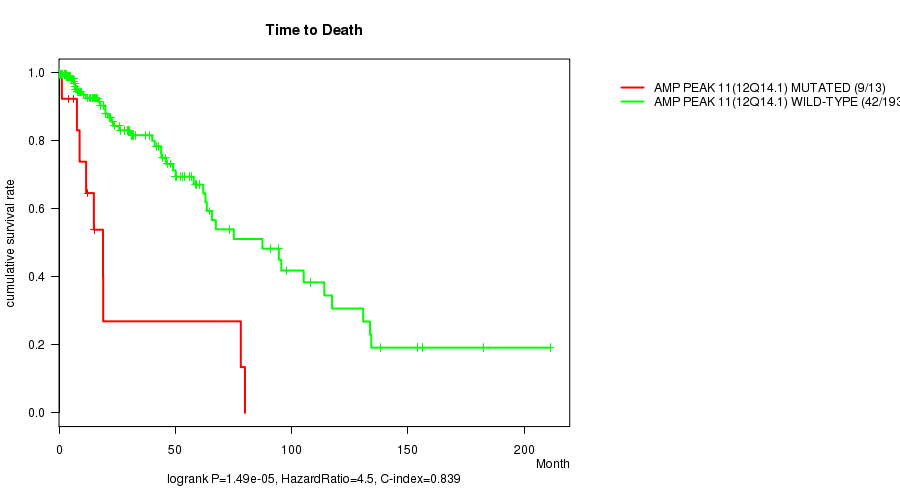
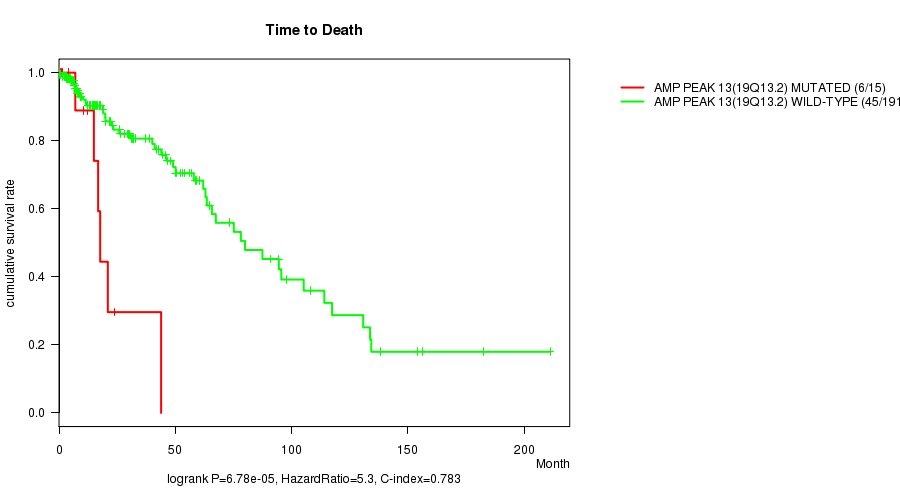
Amp Peak 11(12q14.1) cnv correlated to 'Time to Death'.
-
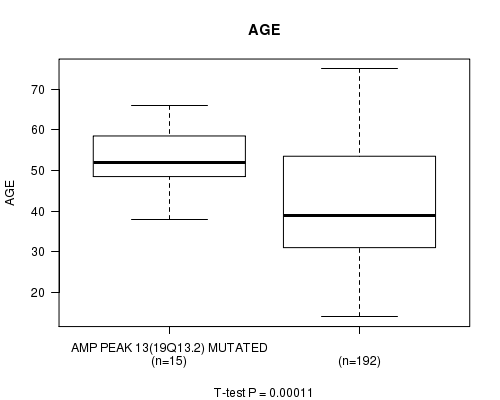
Amp Peak 13(19q13.2) cnv correlated to 'Time to Death' and 'AGE'.
-
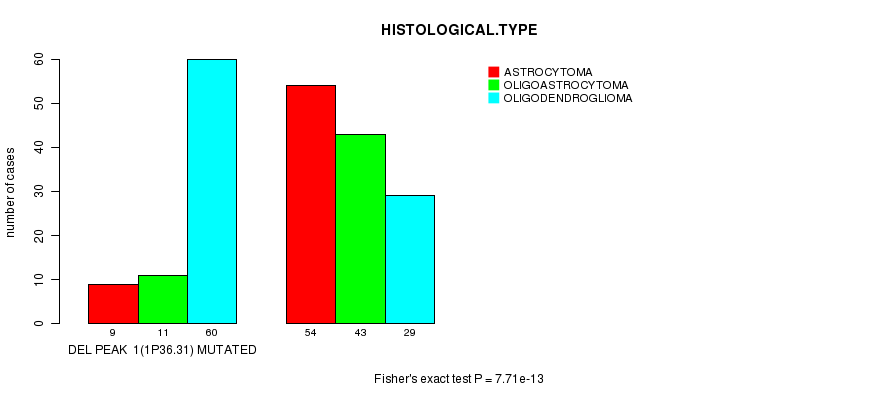
Del Peak 1(1p36.31) cnv correlated to 'HISTOLOGICAL.TYPE'.
-
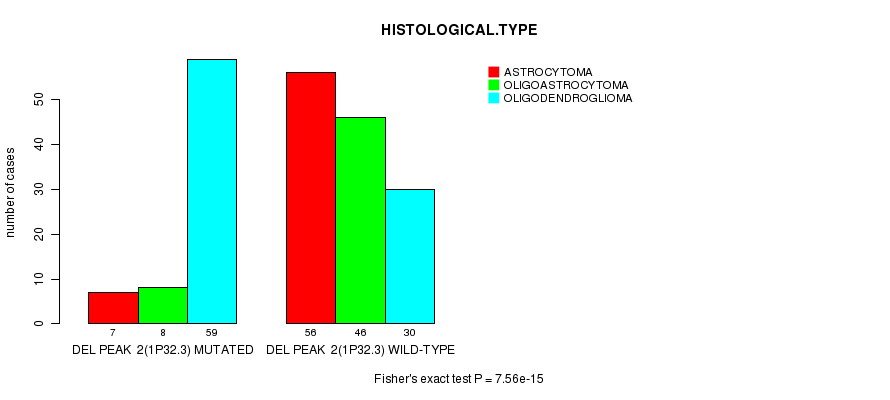
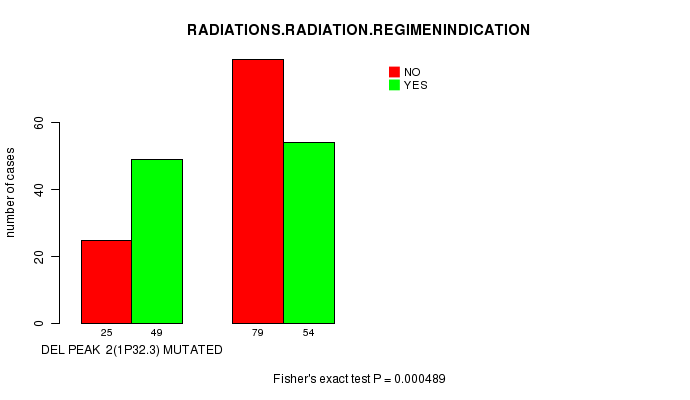
Del Peak 2(1p32.3) cnv correlated to 'HISTOLOGICAL.TYPE' and 'RADIATIONS.RADIATION.REGIMENINDICATION'.
-
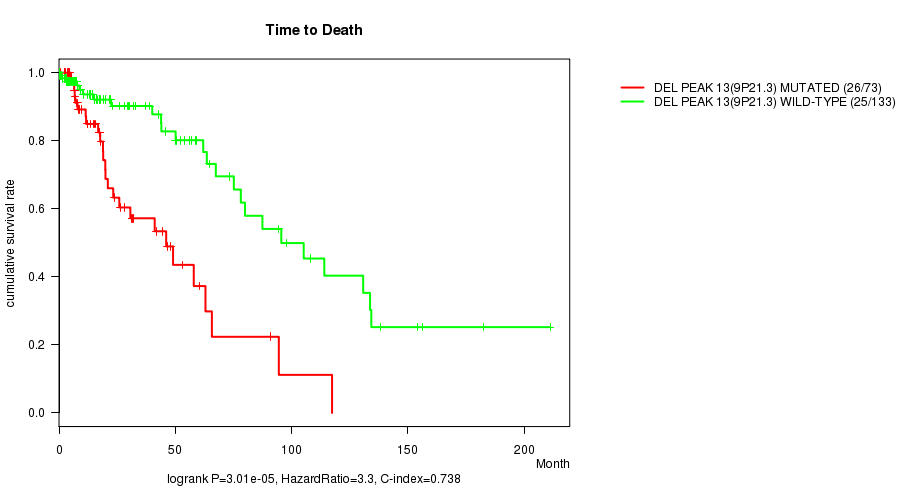
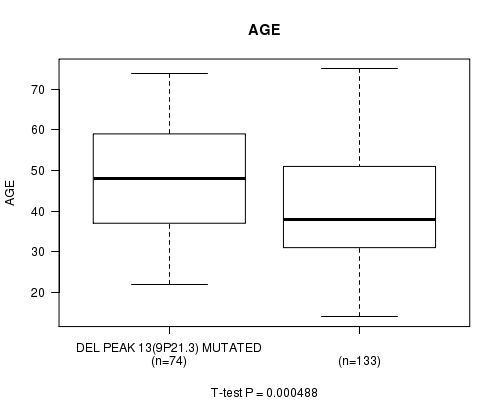
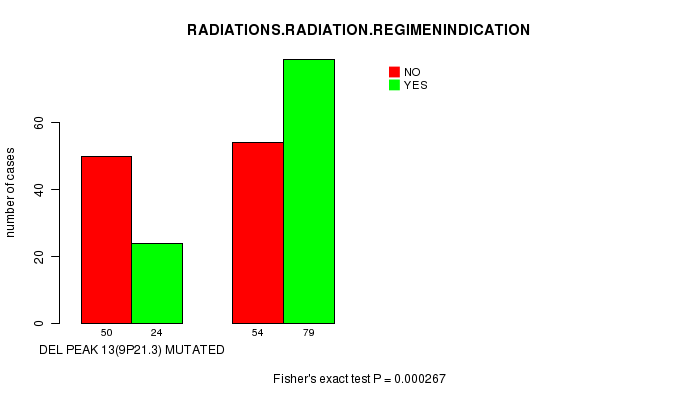
Del Peak 13(9p21.3) cnv correlated to 'Time to Death', 'AGE', and 'RADIATIONS.RADIATION.REGIMENINDICATION'.
-
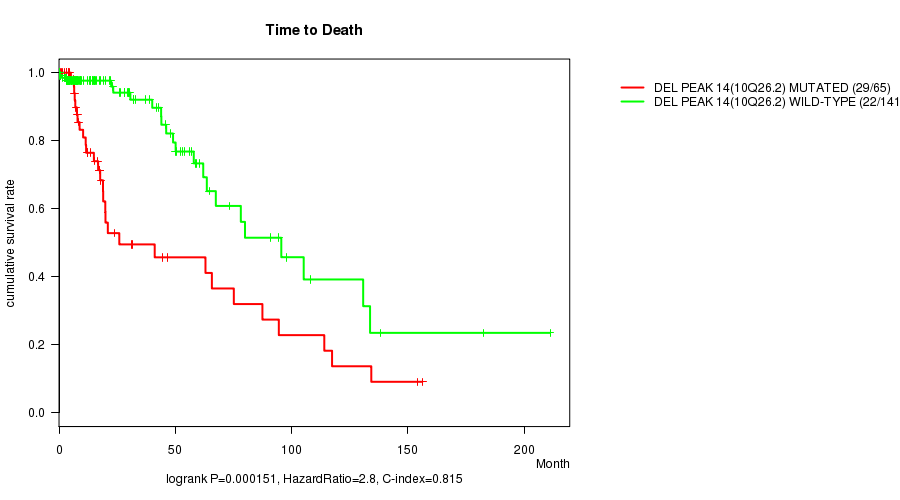
Del Peak 14(10q26.2) cnv correlated to 'Time to Death'.
-
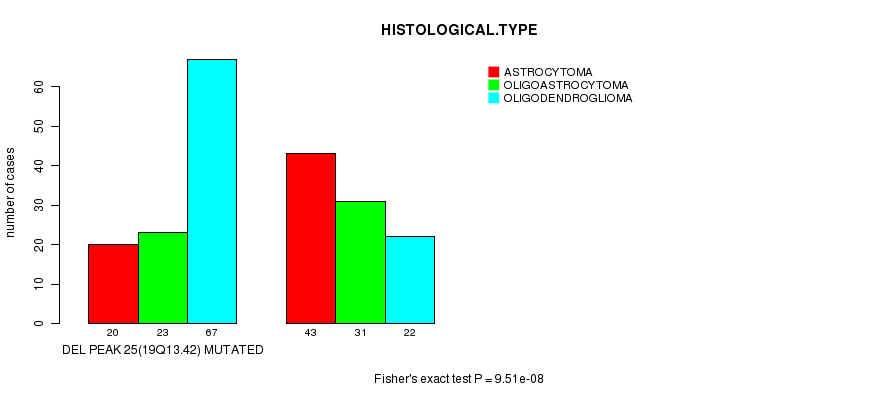
Del Peak 25(19q13.42) cnv correlated to 'HISTOLOGICAL.TYPE'.
Table 1. Get Full Table Overview of the association between significant copy number variation of 43 arm-level results and 7 clinical features. Shown in the table are P values (Q values). Thresholded by Q value < 0.25, 14 significant findings detected.
|
Clinical Features |
Time to Death |
AGE | GENDER |
KARNOFSKY PERFORMANCE SCORE |
HISTOLOGICAL TYPE |
HISTOLOGICCLASSIFICATION |
RADIATIONS RADIATION REGIMENINDICATION |
||
| nCNV (%) | nWild-Type | logrank test | t-test | Fisher's exact test | t-test | Fisher's exact test | Fisher's exact test | Fisher's exact test | |
| Del Peak 13(9p21 3) | 74 (36%) | 133 |
3.01e-05 (0.0089) |
0.000488 (0.141) |
1 (1.00) |
0.367 (1.00) |
0.0451 (1.00) |
0.00123 (0.35) |
0.000267 (0.0774) |
| Amp Peak 13(19q13 2) | 15 (7%) | 192 |
6.78e-05 (0.02) |
0.00011 (0.0322) |
0.792 (1.00) |
0.508 (1.00) |
0.396 (1.00) |
0.423 (1.00) |
0.593 (1.00) |
| Del Peak 2(1p32 3) | 74 (36%) | 133 |
0.139 (1.00) |
0.0029 (0.807) |
0.771 (1.00) |
0.952 (1.00) |
7.56e-15 (2.27e-12) |
0.146 (1.00) |
0.000489 (0.141) |
| Amp Peak 1(1q32 1) | 23 (11%) | 184 |
0.0615 (1.00) |
0.000116 (0.0338) |
0.378 (1.00) |
0.0855 (1.00) |
0.182 (1.00) |
0.00378 (1.00) |
0.377 (1.00) |
| Amp Peak 3(7p11 2) | 53 (26%) | 154 |
0.00366 (1.00) |
0.000626 (0.18) |
0.109 (1.00) |
0.604 (1.00) |
0.0547 (1.00) |
0.00387 (1.00) |
0.34 (1.00) |
| Amp Peak 4(7q32 3) | 73 (35%) | 134 |
0.247 (1.00) |
8.46e-05 (0.0249) |
0.0283 (1.00) |
0.844 (1.00) |
0.384 (1.00) |
0.559 (1.00) |
0.0416 (1.00) |
| Amp Peak 11(12q14 1) | 13 (6%) | 194 |
1.49e-05 (0.00442) |
0.0516 (1.00) |
0.564 (1.00) |
0.466 (1.00) |
0.117 (1.00) |
0.39 (1.00) |
0.568 (1.00) |
| Del Peak 1(1p36 31) | 80 (39%) | 127 |
0.93 (1.00) |
0.00114 (0.325) |
0.474 (1.00) |
0.85 (1.00) |
7.71e-13 (2.31e-10) |
0.478 (1.00) |
0.00432 (1.00) |
| Del Peak 14(10q26 2) | 65 (31%) | 142 |
0.000151 (0.0439) |
0.0104 (1.00) |
0.0717 (1.00) |
0.33 (1.00) |
0.0167 (1.00) |
0.0511 (1.00) |
0.765 (1.00) |
| Del Peak 25(19q13 42) | 111 (54%) | 96 |
0.0266 (1.00) |
0.629 (1.00) |
0.888 (1.00) |
0.566 (1.00) |
9.51e-08 (2.83e-05) |
0.675 (1.00) |
0.889 (1.00) |
| Amp Peak 2(4q12) | 10 (5%) | 197 |
0.953 (1.00) |
0.606 (1.00) |
0.748 (1.00) |
0.325 (1.00) |
0.0461 (1.00) |
0.00216 (0.609) |
0.748 (1.00) |
| Amp Peak 5(8q24 21) | 42 (20%) | 165 |
0.903 (1.00) |
0.56 (1.00) |
0.0837 (1.00) |
0.332 (1.00) |
0.011 (1.00) |
0.301 (1.00) |
0.119 (1.00) |
| Amp Peak 6(10p15 1) | 33 (16%) | 174 |
0.739 (1.00) |
0.00528 (1.00) |
0.127 (1.00) |
0.636 (1.00) |
0.00415 (1.00) |
0.26 (1.00) |
0.255 (1.00) |
| Amp Peak 7(10q11 21) | 4 (2%) | 203 |
0.782 (1.00) |
0.692 (1.00) |
0.636 (1.00) |
0.0125 (1.00) |
0.127 (1.00) |
1 (1.00) |
|
| Amp Peak 8(11q23 3) | 35 (17%) | 172 |
0.605 (1.00) |
0.0473 (1.00) |
0.349 (1.00) |
0.568 (1.00) |
0.35 (1.00) |
0.577 (1.00) |
0.266 (1.00) |
| Amp Peak 9(12p13 32) | 32 (15%) | 175 |
0.899 (1.00) |
0.0809 (1.00) |
0.176 (1.00) |
0.47 (1.00) |
0.486 (1.00) |
0.849 (1.00) |
0.848 (1.00) |
| Amp Peak 10(12p11 22) | 19 (9%) | 188 |
0.906 (1.00) |
0.193 (1.00) |
0.0521 (1.00) |
0.448 (1.00) |
0.297 (1.00) |
1 (1.00) |
0.631 (1.00) |
| Amp Peak 12(19p13 3) | 48 (23%) | 159 |
0.828 (1.00) |
0.0993 (1.00) |
0.869 (1.00) |
0.338 (1.00) |
0.0146 (1.00) |
1 (1.00) |
0.744 (1.00) |
| Amp Peak 14(Xp22 33) | 14 (7%) | 193 |
0.579 (1.00) |
0.877 (1.00) |
1 (1.00) |
0.611 (1.00) |
0.00384 (1.00) |
0.267 (1.00) |
0.407 (1.00) |
| Amp Peak 15(Xq11 2) | 29 (14%) | 178 |
0.666 (1.00) |
0.451 (1.00) |
0.163 (1.00) |
0.687 (1.00) |
0.00489 (1.00) |
0.685 (1.00) |
0.424 (1.00) |
| Del Peak 3(1q43) | 12 (6%) | 195 |
0.942 (1.00) |
0.546 (1.00) |
0.369 (1.00) |
0.244 (1.00) |
0.491 (1.00) |
0.757 (1.00) |
0.768 (1.00) |
| Del Peak 4(2q37 3) | 31 (15%) | 176 |
0.818 (1.00) |
0.0889 (1.00) |
1 (1.00) |
0.542 (1.00) |
0.114 (1.00) |
1 (1.00) |
0.242 (1.00) |
| Del Peak 5(3p21 1) | 19 (9%) | 188 |
0.288 (1.00) |
0.0149 (1.00) |
0.634 (1.00) |
0.674 (1.00) |
0.362 (1.00) |
0.328 (1.00) |
0.147 (1.00) |
| Del Peak 6(3q29) | 20 (10%) | 187 |
0.381 (1.00) |
0.655 (1.00) |
0.1 (1.00) |
0.0446 (1.00) |
0.159 (1.00) |
0.644 (1.00) |
0.481 (1.00) |
| Del Peak 7(4q33) | 60 (29%) | 147 |
0.614 (1.00) |
0.813 (1.00) |
0.164 (1.00) |
0.532 (1.00) |
0.133 (1.00) |
0.759 (1.00) |
0.284 (1.00) |
| Del Peak 8(4q35 2) | 61 (29%) | 146 |
0.56 (1.00) |
0.759 (1.00) |
0.125 (1.00) |
0.663 (1.00) |
0.0924 (1.00) |
0.879 (1.00) |
0.361 (1.00) |
| Del Peak 9(5q35 2) | 27 (13%) | 180 |
0.0993 (1.00) |
0.34 (1.00) |
0.305 (1.00) |
0.31 (1.00) |
0.11 (1.00) |
0.0119 (1.00) |
0.0376 (1.00) |
| Del Peak 10(6p24 1) | 17 (8%) | 190 |
0.0458 (1.00) |
0.525 (1.00) |
0.31 (1.00) |
0.698 (1.00) |
0.00129 (0.364) |
0.802 (1.00) |
0.127 (1.00) |
| Del Peak 11(6q24 3) | 30 (14%) | 177 |
0.0186 (1.00) |
0.482 (1.00) |
0.43 (1.00) |
0.56 (1.00) |
0.0243 (1.00) |
0.425 (1.00) |
0.0026 (0.724) |
| Del Peak 12(8p23 2) | 10 (5%) | 197 |
0.362 (1.00) |
0.514 (1.00) |
1 (1.00) |
0.249 (1.00) |
0.133 (1.00) |
0.00216 (0.609) |
0.332 (1.00) |
| Del Peak 15(11p15 5) | 43 (21%) | 164 |
0.381 (1.00) |
0.0493 (1.00) |
0.0598 (1.00) |
0.671 (1.00) |
0.00928 (1.00) |
0.865 (1.00) |
0.304 (1.00) |
| Del Peak 16(11q25) | 13 (6%) | 194 |
0.0051 (1.00) |
0.944 (1.00) |
0.246 (1.00) |
0.864 (1.00) |
0.623 (1.00) |
0.775 (1.00) |
0.568 (1.00) |
| Del Peak 17(12q24 11) | 27 (13%) | 180 |
0.861 (1.00) |
0.286 (1.00) |
0.305 (1.00) |
0.34 (1.00) |
0.11 (1.00) |
0.538 (1.00) |
0.681 (1.00) |
| Del Peak 18(13q14 2) | 62 (30%) | 145 |
0.462 (1.00) |
0.853 (1.00) |
0.648 (1.00) |
0.0725 (1.00) |
0.0745 (1.00) |
0.128 (1.00) |
0.095 (1.00) |
| Del Peak 19(13q34) | 48 (23%) | 159 |
0.361 (1.00) |
0.528 (1.00) |
0.506 (1.00) |
0.433 (1.00) |
0.551 (1.00) |
0.62 (1.00) |
0.138 (1.00) |
| Del Peak 20(14q24 3) | 48 (23%) | 159 |
0.000981 (0.28) |
0.184 (1.00) |
0.0455 (1.00) |
0.994 (1.00) |
0.0652 (1.00) |
0.182 (1.00) |
0.411 (1.00) |
| Del Peak 21(15q21 3) | 26 (13%) | 181 |
0.15 (1.00) |
0.34 (1.00) |
1 (1.00) |
0.212 (1.00) |
0.646 (1.00) |
0.293 (1.00) |
0.681 (1.00) |
| Del Peak 22(17q25 3) | 11 (5%) | 196 |
0.606 (1.00) |
0.454 (1.00) |
0.761 (1.00) |
0.731 (1.00) |
1 (1.00) |
1 (1.00) |
1 (1.00) |
| Del Peak 23(18p11 32) | 29 (14%) | 178 |
0.822 (1.00) |
0.852 (1.00) |
0.225 (1.00) |
0.349 (1.00) |
0.875 (1.00) |
0.841 (1.00) |
0.0439 (1.00) |
| Del Peak 24(18q23) | 32 (15%) | 175 |
0.722 (1.00) |
0.383 (1.00) |
0.699 (1.00) |
0.843 (1.00) |
0.876 (1.00) |
1 (1.00) |
0.0826 (1.00) |
| Del Peak 26(22q13 31) | 29 (14%) | 178 |
0.116 (1.00) |
0.281 (1.00) |
0.319 (1.00) |
0.733 (1.00) |
0.0023 (0.644) |
0.044 (1.00) |
1 (1.00) |
| Del Peak 27(Xp22 31) | 48 (23%) | 159 |
0.54 (1.00) |
0.489 (1.00) |
0.319 (1.00) |
0.675 (1.00) |
0.831 (1.00) |
0.869 (1.00) |
0.411 (1.00) |
| Del Peak 28(Xq21 1) | 29 (14%) | 178 |
0.582 (1.00) |
0.233 (1.00) |
0.55 (1.00) |
0.957 (1.00) |
0.206 (1.00) |
0.109 (1.00) |
0.844 (1.00) |
P value = 0.000116 (t-test), Q value = 0.034
Table S1. Gene #1: 'Amp Peak 1(1q32.1) mutation analysis' versus Clinical Feature #2: 'AGE'
| nPatients | Mean (Std.Dev) | |
|---|---|---|
| ALL | 207 | 43.1 (13.4) |
| AMP PEAK 1(1Q32.1) MUTATED | 23 | 53.2 (11.4) |
| AMP PEAK 1(1Q32.1) WILD-TYPE | 184 | 41.8 (13.1) |
Figure S1. Get High-res Image Gene #1: 'Amp Peak 1(1q32.1) mutation analysis' versus Clinical Feature #2: 'AGE'
P value = 0.000626 (t-test), Q value = 0.18
Table S2. Gene #3: 'Amp Peak 3(7p11.2) mutation analysis' versus Clinical Feature #2: 'AGE'
| nPatients | Mean (Std.Dev) | |
|---|---|---|
| ALL | 207 | 43.1 (13.4) |
| AMP PEAK 3(7P11.2) MUTATED | 53 | 48.7 (13.4) |
| AMP PEAK 3(7P11.2) WILD-TYPE | 154 | 41.2 (12.9) |
Figure S2. Get High-res Image Gene #3: 'Amp Peak 3(7p11.2) mutation analysis' versus Clinical Feature #2: 'AGE'
P value = 8.46e-05 (t-test), Q value = 0.025
Table S3. Gene #4: 'Amp Peak 4(7q32.3) mutation analysis' versus Clinical Feature #2: 'AGE'
| nPatients | Mean (Std.Dev) | |
|---|---|---|
| ALL | 207 | 43.1 (13.4) |
| AMP PEAK 4(7Q32.3) MUTATED | 73 | 48.1 (13.1) |
| AMP PEAK 4(7Q32.3) WILD-TYPE | 134 | 40.4 (12.9) |
Figure S3. Get High-res Image Gene #4: 'Amp Peak 4(7q32.3) mutation analysis' versus Clinical Feature #2: 'AGE'
P value = 1.49e-05 (logrank test), Q value = 0.0044
Table S4. Gene #11: 'Amp Peak 11(12q14.1) mutation analysis' versus Clinical Feature #1: 'Time to Death'
| nPatients | nDeath | Duration Range (Median), Month | |
|---|---|---|---|
| ALL | 206 | 51 | 0.0 - 211.2 (13.4) |
| AMP PEAK 11(12Q14.1) MUTATED | 13 | 9 | 1.2 - 80.0 (12.4) |
| AMP PEAK 11(12Q14.1) WILD-TYPE | 193 | 42 | 0.0 - 211.2 (13.4) |
Figure S4. Get High-res Image Gene #11: 'Amp Peak 11(12q14.1) mutation analysis' versus Clinical Feature #1: 'Time to Death'
P value = 6.78e-05 (logrank test), Q value = 0.02
Table S5. Gene #13: 'Amp Peak 13(19q13.2) mutation analysis' versus Clinical Feature #1: 'Time to Death'
| nPatients | nDeath | Duration Range (Median), Month | |
|---|---|---|---|
| ALL | 206 | 51 | 0.0 - 211.2 (13.4) |
| AMP PEAK 13(19Q13.2) MUTATED | 15 | 6 | 0.0 - 43.9 (10.6) |
| AMP PEAK 13(19Q13.2) WILD-TYPE | 191 | 45 | 0.1 - 211.2 (14.3) |
Figure S5. Get High-res Image Gene #13: 'Amp Peak 13(19q13.2) mutation analysis' versus Clinical Feature #1: 'Time to Death'
P value = 0.00011 (t-test), Q value = 0.032
Table S6. Gene #13: 'Amp Peak 13(19q13.2) mutation analysis' versus Clinical Feature #2: 'AGE'
| nPatients | Mean (Std.Dev) | |
|---|---|---|
| ALL | 207 | 43.1 (13.4) |
| AMP PEAK 13(19Q13.2) MUTATED | 15 | 53.1 (8.0) |
| AMP PEAK 13(19Q13.2) WILD-TYPE | 192 | 42.3 (13.5) |
Figure S6. Get High-res Image Gene #13: 'Amp Peak 13(19q13.2) mutation analysis' versus Clinical Feature #2: 'AGE'
P value = 7.71e-13 (Fisher's exact test), Q value = 2.3e-10
Table S7. Gene #16: 'Del Peak 1(1p36.31) mutation analysis' versus Clinical Feature #5: 'HISTOLOGICAL.TYPE'
| nPatients | ASTROCYTOMA | OLIGOASTROCYTOMA | OLIGODENDROGLIOMA |
|---|---|---|---|
| ALL | 63 | 54 | 89 |
| DEL PEAK 1(1P36.31) MUTATED | 9 | 11 | 60 |
| DEL PEAK 1(1P36.31) WILD-TYPE | 54 | 43 | 29 |
Figure S7. Get High-res Image Gene #16: 'Del Peak 1(1p36.31) mutation analysis' versus Clinical Feature #5: 'HISTOLOGICAL.TYPE'
P value = 7.56e-15 (Fisher's exact test), Q value = 2.3e-12
Table S8. Gene #17: 'Del Peak 2(1p32.3) mutation analysis' versus Clinical Feature #5: 'HISTOLOGICAL.TYPE'
| nPatients | ASTROCYTOMA | OLIGOASTROCYTOMA | OLIGODENDROGLIOMA |
|---|---|---|---|
| ALL | 63 | 54 | 89 |
| DEL PEAK 2(1P32.3) MUTATED | 7 | 8 | 59 |
| DEL PEAK 2(1P32.3) WILD-TYPE | 56 | 46 | 30 |
Figure S8. Get High-res Image Gene #17: 'Del Peak 2(1p32.3) mutation analysis' versus Clinical Feature #5: 'HISTOLOGICAL.TYPE'
P value = 0.000489 (Fisher's exact test), Q value = 0.14
Table S9. Gene #17: 'Del Peak 2(1p32.3) mutation analysis' versus Clinical Feature #7: 'RADIATIONS.RADIATION.REGIMENINDICATION'
| nPatients | NO | YES |
|---|---|---|
| ALL | 104 | 103 |
| DEL PEAK 2(1P32.3) MUTATED | 25 | 49 |
| DEL PEAK 2(1P32.3) WILD-TYPE | 79 | 54 |
Figure S9. Get High-res Image Gene #17: 'Del Peak 2(1p32.3) mutation analysis' versus Clinical Feature #7: 'RADIATIONS.RADIATION.REGIMENINDICATION'
P value = 3.01e-05 (logrank test), Q value = 0.0089
Table S10. Gene #28: 'Del Peak 13(9p21.3) mutation analysis' versus Clinical Feature #1: 'Time to Death'
| nPatients | nDeath | Duration Range (Median), Month | |
|---|---|---|---|
| ALL | 206 | 51 | 0.0 - 211.2 (13.4) |
| DEL PEAK 13(9P21.3) MUTATED | 73 | 26 | 0.1 - 117.4 (14.7) |
| DEL PEAK 13(9P21.3) WILD-TYPE | 133 | 25 | 0.0 - 211.2 (13.4) |
Figure S10. Get High-res Image Gene #28: 'Del Peak 13(9p21.3) mutation analysis' versus Clinical Feature #1: 'Time to Death'
P value = 0.000488 (t-test), Q value = 0.14
Table S11. Gene #28: 'Del Peak 13(9p21.3) mutation analysis' versus Clinical Feature #2: 'AGE'
| nPatients | Mean (Std.Dev) | |
|---|---|---|
| ALL | 207 | 43.1 (13.4) |
| DEL PEAK 13(9P21.3) MUTATED | 74 | 47.5 (13.2) |
| DEL PEAK 13(9P21.3) WILD-TYPE | 133 | 40.7 (13.0) |
Figure S11. Get High-res Image Gene #28: 'Del Peak 13(9p21.3) mutation analysis' versus Clinical Feature #2: 'AGE'
P value = 0.000267 (Fisher's exact test), Q value = 0.077
Table S12. Gene #28: 'Del Peak 13(9p21.3) mutation analysis' versus Clinical Feature #7: 'RADIATIONS.RADIATION.REGIMENINDICATION'
| nPatients | NO | YES |
|---|---|---|
| ALL | 104 | 103 |
| DEL PEAK 13(9P21.3) MUTATED | 50 | 24 |
| DEL PEAK 13(9P21.3) WILD-TYPE | 54 | 79 |
Figure S12. Get High-res Image Gene #28: 'Del Peak 13(9p21.3) mutation analysis' versus Clinical Feature #7: 'RADIATIONS.RADIATION.REGIMENINDICATION'
P value = 0.000151 (logrank test), Q value = 0.044
Table S13. Gene #29: 'Del Peak 14(10q26.2) mutation analysis' versus Clinical Feature #1: 'Time to Death'
| nPatients | nDeath | Duration Range (Median), Month | |
|---|---|---|---|
| ALL | 206 | 51 | 0.0 - 211.2 (13.4) |
| DEL PEAK 14(10Q26.2) MUTATED | 65 | 29 | 0.1 - 156.2 (12.4) |
| DEL PEAK 14(10Q26.2) WILD-TYPE | 141 | 22 | 0.0 - 211.2 (14.3) |
Figure S13. Get High-res Image Gene #29: 'Del Peak 14(10q26.2) mutation analysis' versus Clinical Feature #1: 'Time to Death'
P value = 9.51e-08 (Fisher's exact test), Q value = 2.8e-05
Table S14. Gene #40: 'Del Peak 25(19q13.42) mutation analysis' versus Clinical Feature #5: 'HISTOLOGICAL.TYPE'
| nPatients | ASTROCYTOMA | OLIGOASTROCYTOMA | OLIGODENDROGLIOMA |
|---|---|---|---|
| ALL | 63 | 54 | 89 |
| DEL PEAK 25(19Q13.42) MUTATED | 20 | 23 | 67 |
| DEL PEAK 25(19Q13.42) WILD-TYPE | 43 | 31 | 22 |
Figure S14. Get High-res Image Gene #40: 'Del Peak 25(19q13.42) mutation analysis' versus Clinical Feature #5: 'HISTOLOGICAL.TYPE'
-
Mutation data file = all_lesions.conf_99.cnv.cluster.txt
-
Clinical data file = LGG-TP.clin.merged.picked.txt
-
Number of patients = 207
-
Number of significantly arm-level cnvs = 43
-
Number of selected clinical features = 7
-
Exclude genes that fewer than K tumors have mutations, K = 3
For survival clinical features, the Kaplan-Meier survival curves of tumors with and without gene mutations were plotted and the statistical significance P values were estimated by logrank test (Bland and Altman 2004) using the 'survdiff' function in R
For continuous numerical clinical features, two-tailed Student's t test with unequal variance (Lehmann and Romano 2005) was applied to compare the clinical values between tumors with and without gene mutations using 't.test' function in R
For binary or multi-class clinical features (nominal or ordinal), two-tailed Fisher's exact tests (Fisher 1922) were used to estimate the P values using the 'fisher.test' function in R
For multiple hypothesis correction, Q value is the False Discovery Rate (FDR) analogue of the P value (Benjamini and Hochberg 1995), defined as the minimum FDR at which the test may be called significant. We used the 'Benjamini and Hochberg' method of 'p.adjust' function in R to convert P values into Q values.
This is an experimental feature. The full results of the analysis summarized in this report can be downloaded from the TCGA Data Coordination Center.