(primary solid tumor cohort)
This pipeline computes the correlation between significant arm-level copy number variations (cnvs) and selected clinical features.
Testing the association between copy number variation 50 arm-level results and 7 clinical features across 207 patients, 16 significant findings detected with Q value < 0.25.
-
19q gain cnv correlated to 'Time to Death'.
-
20p gain cnv correlated to 'Time to Death'.
-
20q gain cnv correlated to 'Time to Death'.
-
1p loss cnv correlated to 'HISTOLOGICAL.TYPE'.
-
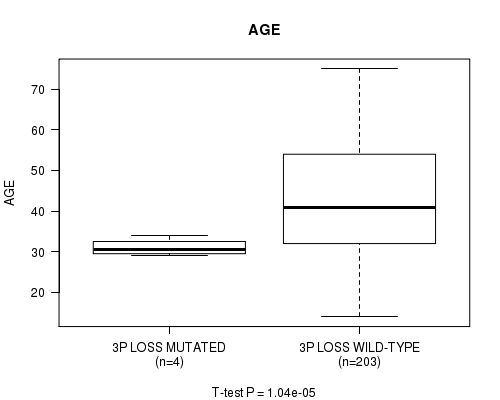
3p loss cnv correlated to 'AGE'.
-
6p loss cnv correlated to 'Time to Death'.
-
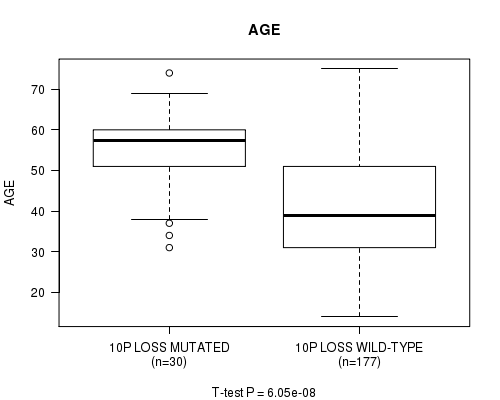
10p loss cnv correlated to 'Time to Death', 'AGE', and 'HISTOLOGICCLASSIFICATION'.
-
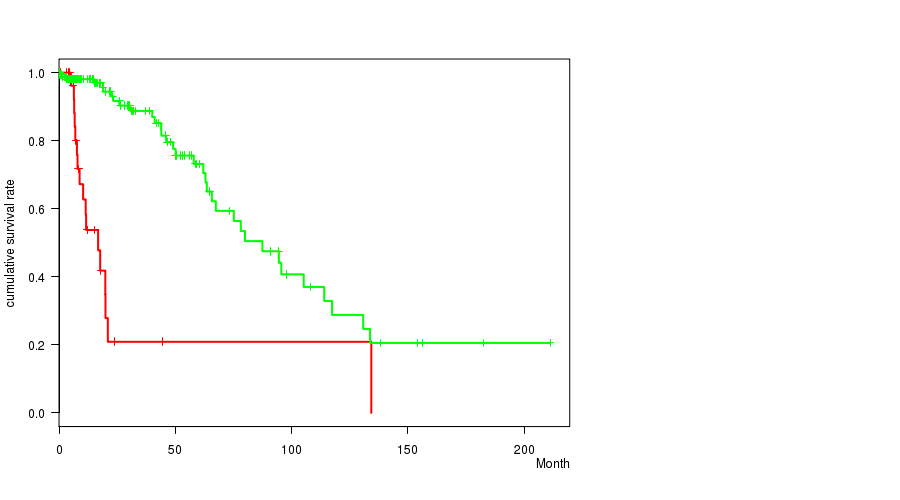
10q loss cnv correlated to 'Time to Death', 'AGE', 'HISTOLOGICAL.TYPE', and 'HISTOLOGICCLASSIFICATION'.
-
11q loss cnv correlated to 'Time to Death'.
-
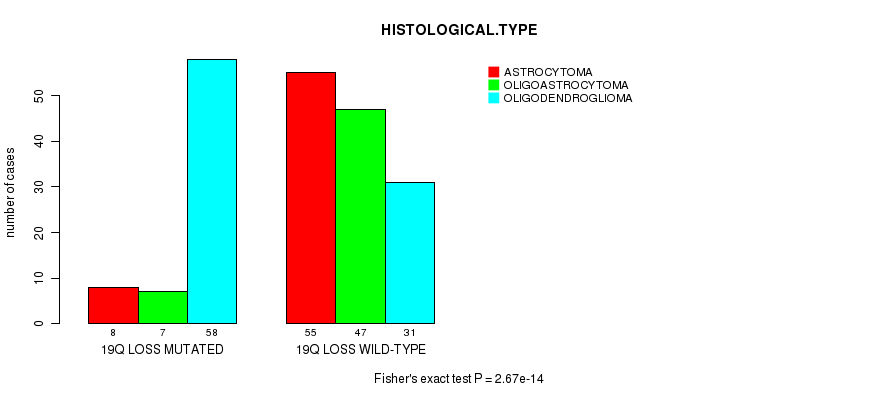
19q loss cnv correlated to 'HISTOLOGICAL.TYPE'.
-
22q loss cnv correlated to 'Time to Death'.
Table 1. Get Full Table Overview of the association between significant copy number variation of 50 arm-level results and 7 clinical features. Shown in the table are P values (Q values). Thresholded by Q value < 0.25, 16 significant findings detected.
|
Clinical Features |
Time to Death |
AGE | GENDER |
KARNOFSKY PERFORMANCE SCORE |
HISTOLOGICAL TYPE |
HISTOLOGICCLASSIFICATION |
RADIATIONS RADIATION REGIMENINDICATION |
||
| nCNV (%) | nWild-Type | logrank test | t-test | Fisher's exact test | t-test | Fisher's exact test | Fisher's exact test | Fisher's exact test | |
| 10q loss | 31 (15%) | 176 |
1.88e-10 (6.29e-08) |
3.06e-08 (1.02e-05) |
0.0308 (1.00) |
0.927 (1.00) |
0.000389 (0.126) |
7.47e-06 (0.00247) |
1 (1.00) |
| 10p loss | 30 (14%) | 177 |
8.93e-11 (3e-08) |
6.05e-08 (2.02e-05) |
0.0478 (1.00) |
0.879 (1.00) |
0.00083 (0.267) |
1.48e-05 (0.00487) |
1 (1.00) |
| 19q gain | 8 (4%) | 199 |
0.000661 (0.214) |
0.0102 (1.00) |
1 (1.00) |
0.26 (1.00) |
0.595 (1.00) |
0.0733 (1.00) |
0.721 (1.00) |
| 20p gain | 17 (8%) | 190 |
0.000116 (0.0379) |
0.00665 (1.00) |
0.0744 (1.00) |
0.976 (1.00) |
0.175 (1.00) |
0.207 (1.00) |
0.614 (1.00) |
| 20q gain | 15 (7%) | 192 |
0.000335 (0.109) |
0.0141 (1.00) |
0.0627 (1.00) |
0.893 (1.00) |
0.16 (1.00) |
0.179 (1.00) |
1 (1.00) |
| 1p loss | 65 (31%) | 142 |
0.124 (1.00) |
0.0169 (1.00) |
0.88 (1.00) |
0.692 (1.00) |
4.61e-19 (1.56e-16) |
0.132 (1.00) |
0.00165 (0.525) |
| 3p loss | 4 (2%) | 203 |
0.917 (1.00) |
1.04e-05 (0.00342) |
0.636 (1.00) |
0.688 (1.00) |
0.127 (1.00) |
0.369 (1.00) |
|
| 6p loss | 5 (2%) | 202 |
5.29e-05 (0.0173) |
0.806 (1.00) |
1 (1.00) |
0.861 (1.00) |
0.449 (1.00) |
0.379 (1.00) |
1 (1.00) |
| 11q loss | 4 (2%) | 203 |
0.000569 (0.184) |
0.0656 (1.00) |
0.316 (1.00) |
0.214 (1.00) |
0.127 (1.00) |
0.621 (1.00) |
|
| 19q loss | 73 (35%) | 134 |
0.186 (1.00) |
0.0459 (1.00) |
0.769 (1.00) |
0.825 (1.00) |
2.67e-14 (8.99e-12) |
0.467 (1.00) |
0.0295 (1.00) |
| 22q loss | 14 (7%) | 193 |
3.89e-06 (0.00129) |
0.452 (1.00) |
0.28 (1.00) |
0.187 (1.00) |
0.00293 (0.912) |
0.00373 (1.00) |
0.284 (1.00) |
| 1p gain | 6 (3%) | 201 |
0.00425 (1.00) |
0.171 (1.00) |
0.0864 (1.00) |
0.14 (1.00) |
0.0282 (1.00) |
0.0325 (1.00) |
1 (1.00) |
| 1q gain | 8 (4%) | 199 |
0.252 (1.00) |
0.00496 (1.00) |
0.293 (1.00) |
0.572 (1.00) |
0.432 (1.00) |
0.0733 (1.00) |
0.721 (1.00) |
| 6p gain | 3 (1%) | 204 |
0.506 (1.00) |
0.761 (1.00) |
0.578 (1.00) |
0.0449 (1.00) |
1 (1.00) |
0.246 (1.00) |
|
| 7p gain | 36 (17%) | 171 |
0.00841 (1.00) |
0.0264 (1.00) |
0.044 (1.00) |
0.958 (1.00) |
0.0204 (1.00) |
0.0262 (1.00) |
0.36 (1.00) |
| 7q gain | 49 (24%) | 158 |
0.0113 (1.00) |
0.00174 (0.55) |
0.137 (1.00) |
0.702 (1.00) |
0.0623 (1.00) |
0.325 (1.00) |
0.514 (1.00) |
| 8p gain | 14 (7%) | 193 |
0.731 (1.00) |
0.618 (1.00) |
0.403 (1.00) |
0.987 (1.00) |
0.159 (1.00) |
1 (1.00) |
0.165 (1.00) |
| 8q gain | 17 (8%) | 190 |
0.941 (1.00) |
0.271 (1.00) |
0.613 (1.00) |
0.348 (1.00) |
0.0511 (1.00) |
1 (1.00) |
0.311 (1.00) |
| 9p gain | 4 (2%) | 203 |
0.135 (1.00) |
0.00595 (1.00) |
0.316 (1.00) |
0.817 (1.00) |
0.627 (1.00) |
1 (1.00) |
|
| 9q gain | 4 (2%) | 203 |
0.043 (1.00) |
0.0912 (1.00) |
0.316 (1.00) |
0.14 (1.00) |
0.214 (1.00) |
0.127 (1.00) |
0.621 (1.00) |
| 10p gain | 21 (10%) | 186 |
0.502 (1.00) |
0.00632 (1.00) |
0.0669 (1.00) |
0.101 (1.00) |
0.101 (1.00) |
0.822 (1.00) |
0.0635 (1.00) |
| 11p gain | 9 (4%) | 198 |
0.511 (1.00) |
0.277 (1.00) |
1 (1.00) |
0.722 (1.00) |
0.469 (1.00) |
0.514 (1.00) |
1 (1.00) |
| 11q gain | 13 (6%) | 194 |
0.69 (1.00) |
0.185 (1.00) |
0.564 (1.00) |
0.605 (1.00) |
0.875 (1.00) |
0.576 (1.00) |
0.568 (1.00) |
| 12p gain | 10 (5%) | 197 |
0.465 (1.00) |
0.00184 (0.581) |
0.0458 (1.00) |
0.758 (1.00) |
0.0826 (1.00) |
1 (1.00) |
|
| 12q gain | 4 (2%) | 203 |
0.364 (1.00) |
0.000869 (0.278) |
0.136 (1.00) |
1 (1.00) |
0.0934 (1.00) |
1 (1.00) |
|
| 18p gain | 4 (2%) | 203 |
0.493 (1.00) |
0.75 (1.00) |
0.316 (1.00) |
0.214 (1.00) |
0.627 (1.00) |
0.369 (1.00) |
|
| 19p gain | 10 (5%) | 197 |
0.171 (1.00) |
0.00203 (0.639) |
1 (1.00) |
0.0572 (1.00) |
0.293 (1.00) |
0.114 (1.00) |
0.332 (1.00) |
| 21q gain | 3 (1%) | 204 |
0.533 (1.00) |
0.994 (1.00) |
1 (1.00) |
0.26 (1.00) |
0.593 (1.00) |
1 (1.00) |
|
| 1q loss | 9 (4%) | 198 |
0.489 (1.00) |
0.047 (1.00) |
1 (1.00) |
0.111 (1.00) |
0.00112 (0.356) |
0.735 (1.00) |
0.748 (1.00) |
| 2p loss | 4 (2%) | 203 |
0.054 (1.00) |
0.675 (1.00) |
0.636 (1.00) |
0.688 (1.00) |
0.627 (1.00) |
0.621 (1.00) |
|
| 2q loss | 3 (1%) | 204 |
0.539 (1.00) |
0.189 (1.00) |
0.261 (1.00) |
0.108 (1.00) |
1 (1.00) |
0.621 (1.00) |
|
| 3q loss | 9 (4%) | 198 |
0.554 (1.00) |
0.857 (1.00) |
0.735 (1.00) |
0.217 (1.00) |
0.387 (1.00) |
0.514 (1.00) |
1 (1.00) |
| 4p loss | 15 (7%) | 192 |
0.143 (1.00) |
0.252 (1.00) |
0.279 (1.00) |
0.563 (1.00) |
0.0664 (1.00) |
0.79 (1.00) |
0.436 (1.00) |
| 4q loss | 24 (12%) | 183 |
0.116 (1.00) |
0.88 (1.00) |
0.663 (1.00) |
0.395 (1.00) |
0.314 (1.00) |
0.514 (1.00) |
0.394 (1.00) |
| 5p loss | 11 (5%) | 196 |
0.309 (1.00) |
0.814 (1.00) |
0.358 (1.00) |
0.212 (1.00) |
0.00272 (0.852) |
0.757 (1.00) |
0.538 (1.00) |
| 5q loss | 9 (4%) | 198 |
0.0292 (1.00) |
0.364 (1.00) |
1 (1.00) |
0.14 (1.00) |
0.224 (1.00) |
0.514 (1.00) |
0.17 (1.00) |
| 6q loss | 19 (9%) | 188 |
0.00251 (0.787) |
0.134 (1.00) |
0.467 (1.00) |
0.194 (1.00) |
0.025 (1.00) |
0.14 (1.00) |
0.0029 (0.905) |
| 9p loss | 36 (17%) | 171 |
0.00408 (1.00) |
0.126 (1.00) |
0.855 (1.00) |
0.595 (1.00) |
0.0808 (1.00) |
0.192 (1.00) |
0.00544 (1.00) |
| 9q loss | 6 (3%) | 201 |
0.851 (1.00) |
0.116 (1.00) |
0.406 (1.00) |
0.615 (1.00) |
0.579 (1.00) |
1 (1.00) |
0.445 (1.00) |
| 11p loss | 18 (9%) | 189 |
0.131 (1.00) |
0.111 (1.00) |
0.621 (1.00) |
0.797 (1.00) |
0.00472 (1.00) |
0.14 (1.00) |
0.217 (1.00) |
| 12q loss | 8 (4%) | 199 |
0.464 (1.00) |
0.894 (1.00) |
0.727 (1.00) |
0.859 (1.00) |
0.214 (1.00) |
0.473 (1.00) |
0.721 (1.00) |
| 13q loss | 27 (13%) | 180 |
0.163 (1.00) |
0.397 (1.00) |
1 (1.00) |
0.839 (1.00) |
1 (1.00) |
1 (1.00) |
0.215 (1.00) |
| 14q loss | 22 (11%) | 185 |
0.000835 (0.268) |
0.0113 (1.00) |
0.0432 (1.00) |
0.5 (1.00) |
0.0839 (1.00) |
0.111 (1.00) |
0.377 (1.00) |
| 15q loss | 12 (6%) | 195 |
0.252 (1.00) |
0.734 (1.00) |
0.561 (1.00) |
0.816 (1.00) |
0.0384 (1.00) |
0.388 (1.00) |
0.0822 (1.00) |
| 16q loss | 6 (3%) | 201 |
0.962 (1.00) |
0.178 (1.00) |
1 (1.00) |
0.879 (1.00) |
0.69 (1.00) |
0.212 (1.00) |
|
| 18p loss | 14 (7%) | 193 |
0.69 (1.00) |
0.409 (1.00) |
1 (1.00) |
0.5 (1.00) |
0.606 (1.00) |
1 (1.00) |
0.783 (1.00) |
| 18q loss | 15 (7%) | 192 |
0.813 (1.00) |
0.367 (1.00) |
0.428 (1.00) |
0.731 (1.00) |
0.182 (1.00) |
0.597 (1.00) |
0.593 (1.00) |
| 19p loss | 9 (4%) | 198 |
0.484 (1.00) |
0.247 (1.00) |
0.503 (1.00) |
0.44 (1.00) |
0.198 (1.00) |
0.185 (1.00) |
0.498 (1.00) |
| 21q loss | 7 (3%) | 200 |
0.431 (1.00) |
0.746 (1.00) |
1 (1.00) |
0.26 (1.00) |
0.0666 (1.00) |
1 (1.00) |
1 (1.00) |
| Xq loss | 5 (2%) | 202 |
0.423 (1.00) |
0.794 (1.00) |
0.654 (1.00) |
0.578 (1.00) |
0.333 (1.00) |
0.369 (1.00) |
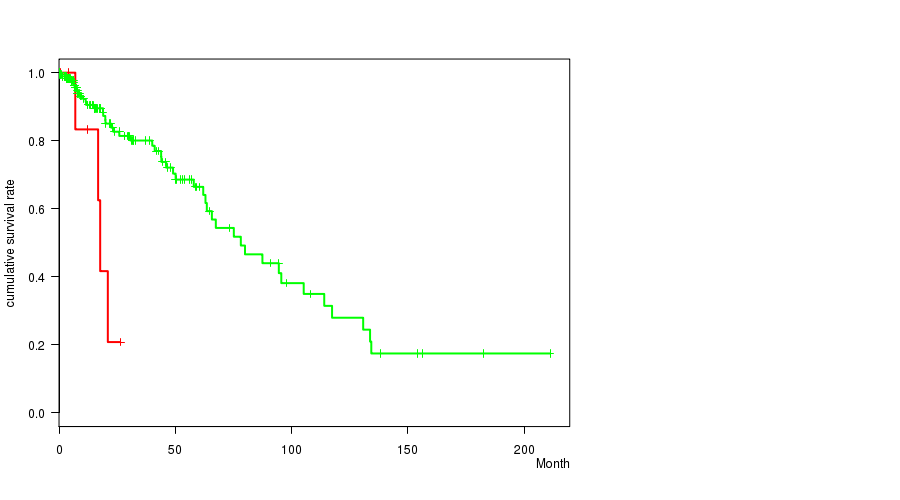
P value = 0.000661 (logrank test), Q value = 0.21
Table S1. Gene #17: '19q gain mutation analysis' versus Clinical Feature #1: 'Time to Death'
| nPatients | nDeath | Duration Range (Median), Month | |
|---|---|---|---|
| ALL | 206 | 51 | 0.0 - 211.2 (13.4) |
| 19Q GAIN MUTATED | 8 | 4 | 0.5 - 26.3 (14.5) |
| 19Q GAIN WILD-TYPE | 198 | 47 | 0.0 - 211.2 (13.4) |
Figure S1. Get High-res Image Gene #17: '19q gain mutation analysis' versus Clinical Feature #1: 'Time to Death'
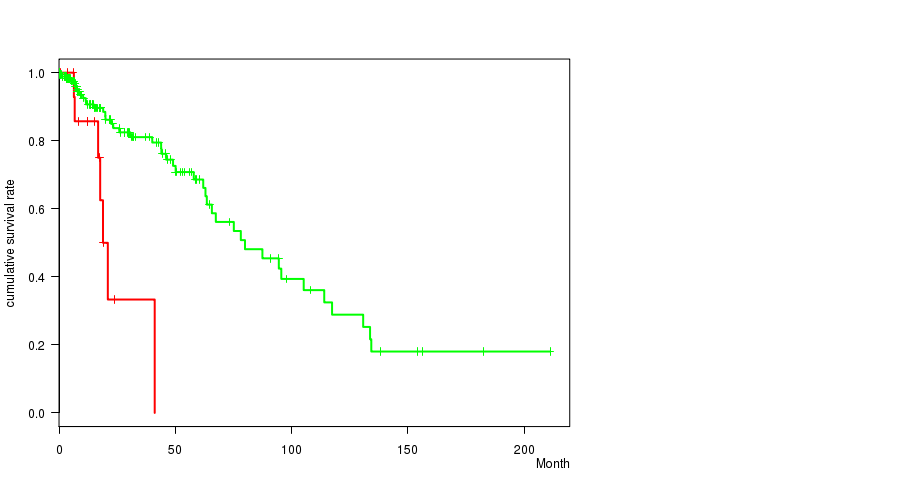
P value = 0.000116 (logrank test), Q value = 0.038
Table S2. Gene #18: '20p gain mutation analysis' versus Clinical Feature #1: 'Time to Death'
| nPatients | nDeath | Duration Range (Median), Month | |
|---|---|---|---|
| ALL | 206 | 51 | 0.0 - 211.2 (13.4) |
| 20P GAIN MUTATED | 17 | 7 | 0.5 - 41.1 (15.3) |
| 20P GAIN WILD-TYPE | 189 | 44 | 0.0 - 211.2 (13.4) |
Figure S2. Get High-res Image Gene #18: '20p gain mutation analysis' versus Clinical Feature #1: 'Time to Death'
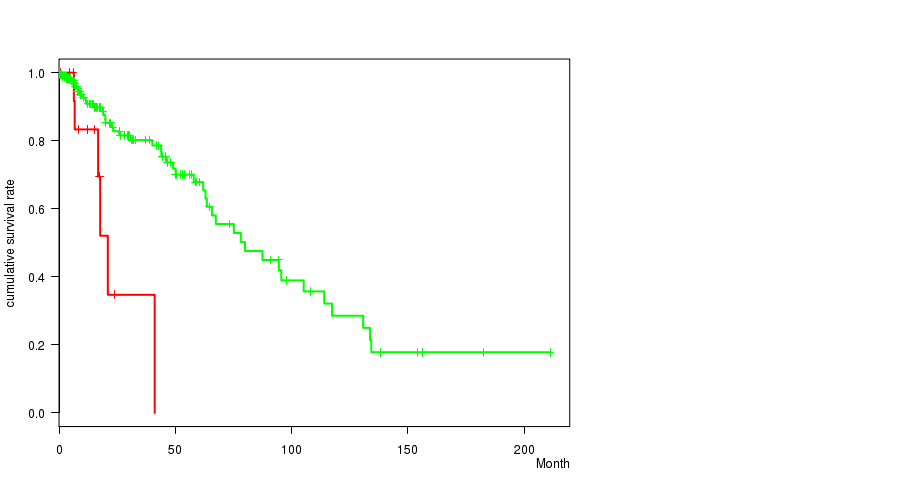
P value = 0.000335 (logrank test), Q value = 0.11
Table S3. Gene #19: '20q gain mutation analysis' versus Clinical Feature #1: 'Time to Death'
| nPatients | nDeath | Duration Range (Median), Month | |
|---|---|---|---|
| ALL | 206 | 51 | 0.0 - 211.2 (13.4) |
| 20Q GAIN MUTATED | 15 | 6 | 0.5 - 41.1 (12.4) |
| 20Q GAIN WILD-TYPE | 191 | 45 | 0.0 - 211.2 (13.4) |
Figure S3. Get High-res Image Gene #19: '20q gain mutation analysis' versus Clinical Feature #1: 'Time to Death'
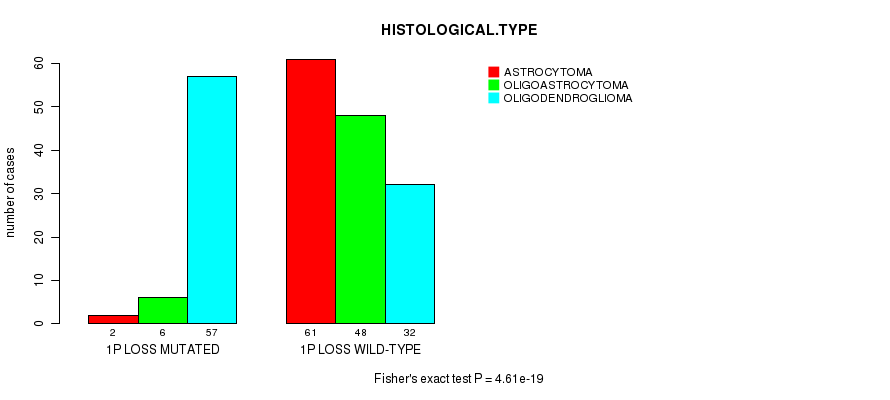
P value = 4.61e-19 (Fisher's exact test), Q value = 1.6e-16
Table S4. Gene #21: '1p loss mutation analysis' versus Clinical Feature #5: 'HISTOLOGICAL.TYPE'
| nPatients | ASTROCYTOMA | OLIGOASTROCYTOMA | OLIGODENDROGLIOMA |
|---|---|---|---|
| ALL | 63 | 54 | 89 |
| 1P LOSS MUTATED | 2 | 6 | 57 |
| 1P LOSS WILD-TYPE | 61 | 48 | 32 |
Figure S4. Get High-res Image Gene #21: '1p loss mutation analysis' versus Clinical Feature #5: 'HISTOLOGICAL.TYPE'
P value = 1.04e-05 (t-test), Q value = 0.0034
Table S5. Gene #25: '3p loss mutation analysis' versus Clinical Feature #2: 'AGE'
| nPatients | Mean (Std.Dev) | |
|---|---|---|
| ALL | 207 | 43.1 (13.4) |
| 3P LOSS MUTATED | 4 | 31.0 (2.2) |
| 3P LOSS WILD-TYPE | 203 | 43.3 (13.4) |
Figure S5. Get High-res Image Gene #25: '3p loss mutation analysis' versus Clinical Feature #2: 'AGE'
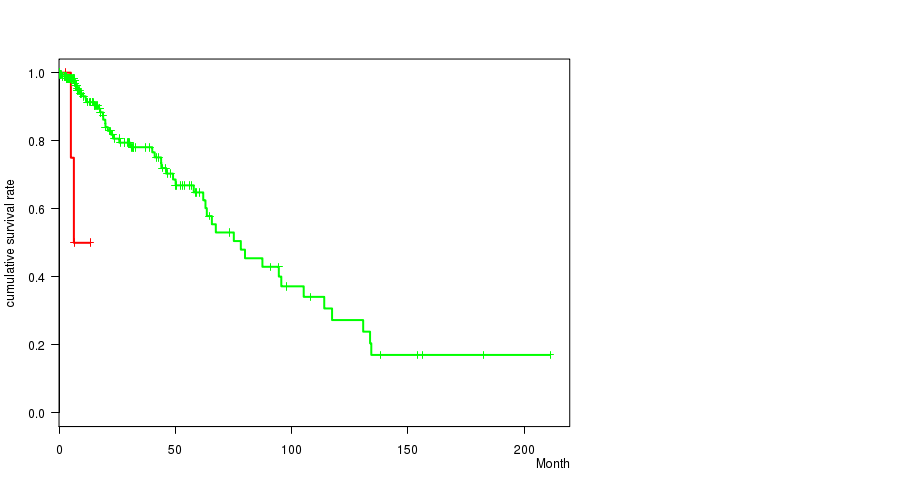
P value = 5.29e-05 (logrank test), Q value = 0.017
Table S6. Gene #31: '6p loss mutation analysis' versus Clinical Feature #1: 'Time to Death'
| nPatients | nDeath | Duration Range (Median), Month | |
|---|---|---|---|
| ALL | 206 | 51 | 0.0 - 211.2 (13.4) |
| 6P LOSS MUTATED | 5 | 2 | 3.0 - 13.4 (6.4) |
| 6P LOSS WILD-TYPE | 201 | 49 | 0.0 - 211.2 (14.4) |
Figure S6. Get High-res Image Gene #31: '6p loss mutation analysis' versus Clinical Feature #1: 'Time to Death'
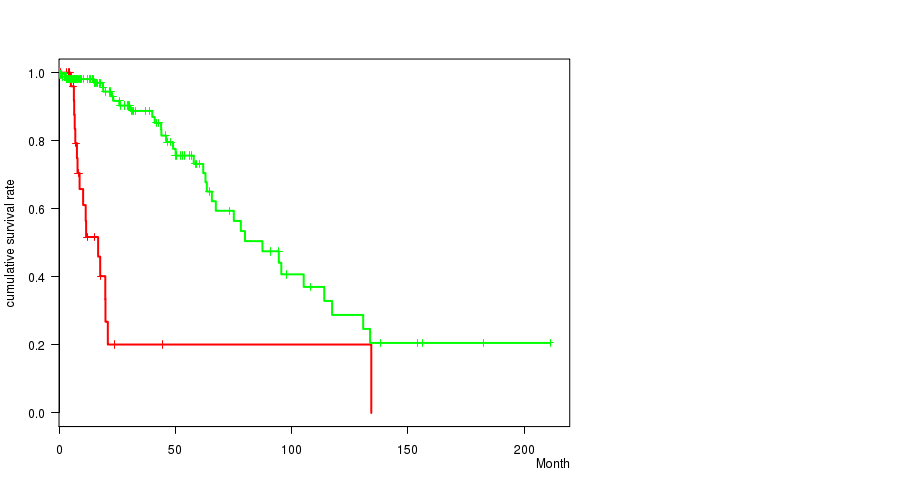
P value = 8.93e-11 (logrank test), Q value = 3e-08
Table S7. Gene #35: '10p loss mutation analysis' versus Clinical Feature #1: 'Time to Death'
| nPatients | nDeath | Duration Range (Median), Month | |
|---|---|---|---|
| ALL | 206 | 51 | 0.0 - 211.2 (13.4) |
| 10P LOSS MUTATED | 30 | 17 | 0.1 - 134.3 (8.6) |
| 10P LOSS WILD-TYPE | 176 | 34 | 0.0 - 211.2 (14.6) |
Figure S7. Get High-res Image Gene #35: '10p loss mutation analysis' versus Clinical Feature #1: 'Time to Death'
P value = 6.05e-08 (t-test), Q value = 2e-05
Table S8. Gene #35: '10p loss mutation analysis' versus Clinical Feature #2: 'AGE'
| nPatients | Mean (Std.Dev) | |
|---|---|---|
| ALL | 207 | 43.1 (13.4) |
| 10P LOSS MUTATED | 30 | 54.9 (10.4) |
| 10P LOSS WILD-TYPE | 177 | 41.1 (12.9) |
Figure S8. Get High-res Image Gene #35: '10p loss mutation analysis' versus Clinical Feature #2: 'AGE'
P value = 1.48e-05 (Fisher's exact test), Q value = 0.0049
Table S9. Gene #35: '10p loss mutation analysis' versus Clinical Feature #6: 'HISTOLOGICCLASSIFICATION'
| nPatients | GRADE II | GRADE III |
|---|---|---|
| ALL | 94 | 112 |
| 10P LOSS MUTATED | 3 | 27 |
| 10P LOSS WILD-TYPE | 91 | 85 |
Figure S9. Get High-res Image Gene #35: '10p loss mutation analysis' versus Clinical Feature #6: 'HISTOLOGICCLASSIFICATION'

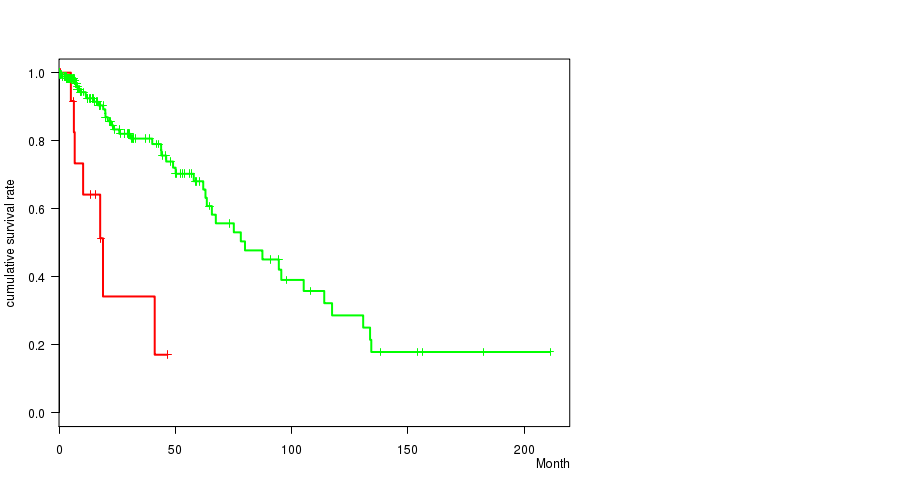
P value = 1.88e-10 (logrank test), Q value = 6.3e-08
Table S10. Gene #36: '10q loss mutation analysis' versus Clinical Feature #1: 'Time to Death'
| nPatients | nDeath | Duration Range (Median), Month | |
|---|---|---|---|
| ALL | 206 | 51 | 0.0 - 211.2 (13.4) |
| 10Q LOSS MUTATED | 31 | 17 | 0.1 - 134.3 (8.8) |
| 10Q LOSS WILD-TYPE | 175 | 34 | 0.0 - 211.2 (14.7) |
Figure S10. Get High-res Image Gene #36: '10q loss mutation analysis' versus Clinical Feature #1: 'Time to Death'
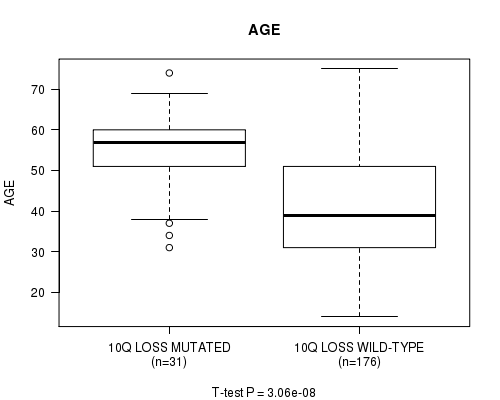
P value = 3.06e-08 (t-test), Q value = 1e-05
Table S11. Gene #36: '10q loss mutation analysis' versus Clinical Feature #2: 'AGE'
| nPatients | Mean (Std.Dev) | |
|---|---|---|
| ALL | 207 | 43.1 (13.4) |
| 10Q LOSS MUTATED | 31 | 54.8 (10.3) |
| 10Q LOSS WILD-TYPE | 176 | 41.0 (12.9) |
Figure S11. Get High-res Image Gene #36: '10q loss mutation analysis' versus Clinical Feature #2: 'AGE'
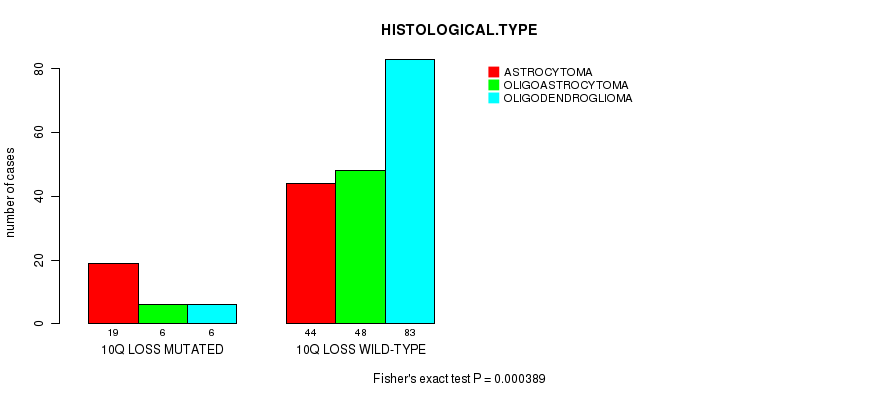
P value = 0.000389 (Fisher's exact test), Q value = 0.13
Table S12. Gene #36: '10q loss mutation analysis' versus Clinical Feature #5: 'HISTOLOGICAL.TYPE'
| nPatients | ASTROCYTOMA | OLIGOASTROCYTOMA | OLIGODENDROGLIOMA |
|---|---|---|---|
| ALL | 63 | 54 | 89 |
| 10Q LOSS MUTATED | 19 | 6 | 6 |
| 10Q LOSS WILD-TYPE | 44 | 48 | 83 |
Figure S12. Get High-res Image Gene #36: '10q loss mutation analysis' versus Clinical Feature #5: 'HISTOLOGICAL.TYPE'
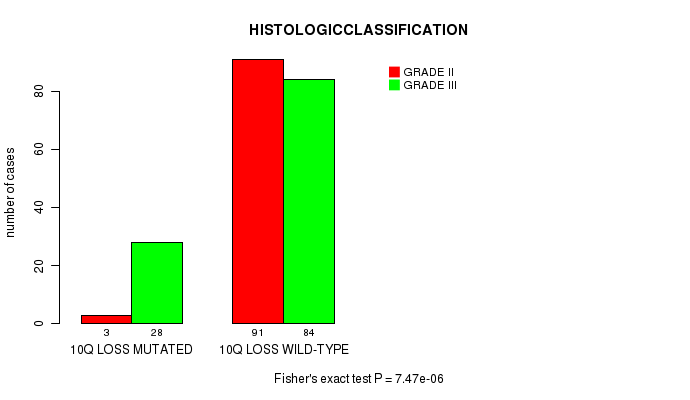
P value = 7.47e-06 (Fisher's exact test), Q value = 0.0025
Table S13. Gene #36: '10q loss mutation analysis' versus Clinical Feature #6: 'HISTOLOGICCLASSIFICATION'
| nPatients | GRADE II | GRADE III |
|---|---|---|
| ALL | 94 | 112 |
| 10Q LOSS MUTATED | 3 | 28 |
| 10Q LOSS WILD-TYPE | 91 | 84 |
Figure S13. Get High-res Image Gene #36: '10q loss mutation analysis' versus Clinical Feature #6: 'HISTOLOGICCLASSIFICATION'
P value = 0.000569 (logrank test), Q value = 0.18
Table S14. Gene #38: '11q loss mutation analysis' versus Clinical Feature #1: 'Time to Death'
| nPatients | nDeath | Duration Range (Median), Month | |
|---|---|---|---|
| ALL | 206 | 51 | 0.0 - 211.2 (13.4) |
| 11Q LOSS MUTATED | 4 | 3 | 6.0 - 41.1 (13.2) |
| 11Q LOSS WILD-TYPE | 202 | 48 | 0.0 - 211.2 (13.4) |
Figure S14. Get High-res Image Gene #38: '11q loss mutation analysis' versus Clinical Feature #1: 'Time to Death'

P value = 2.67e-14 (Fisher's exact test), Q value = 9e-12
Table S15. Gene #47: '19q loss mutation analysis' versus Clinical Feature #5: 'HISTOLOGICAL.TYPE'
| nPatients | ASTROCYTOMA | OLIGOASTROCYTOMA | OLIGODENDROGLIOMA |
|---|---|---|---|
| ALL | 63 | 54 | 89 |
| 19Q LOSS MUTATED | 8 | 7 | 58 |
| 19Q LOSS WILD-TYPE | 55 | 47 | 31 |
Figure S15. Get High-res Image Gene #47: '19q loss mutation analysis' versus Clinical Feature #5: 'HISTOLOGICAL.TYPE'
P value = 3.89e-06 (logrank test), Q value = 0.0013
Table S16. Gene #49: '22q loss mutation analysis' versus Clinical Feature #1: 'Time to Death'
| nPatients | nDeath | Duration Range (Median), Month | |
|---|---|---|---|
| ALL | 206 | 51 | 0.0 - 211.2 (13.4) |
| 22Q LOSS MUTATED | 14 | 7 | 0.1 - 46.6 (11.9) |
| 22Q LOSS WILD-TYPE | 192 | 44 | 0.0 - 211.2 (13.9) |
Figure S16. Get High-res Image Gene #49: '22q loss mutation analysis' versus Clinical Feature #1: 'Time to Death'
-
Mutation data file = broad_values_by_arm.mutsig.cluster.txt
-
Clinical data file = LGG-TP.clin.merged.picked.txt
-
Number of patients = 207
-
Number of significantly arm-level cnvs = 50
-
Number of selected clinical features = 7
-
Exclude genes that fewer than K tumors have mutations, K = 3
For survival clinical features, the Kaplan-Meier survival curves of tumors with and without gene mutations were plotted and the statistical significance P values were estimated by logrank test (Bland and Altman 2004) using the 'survdiff' function in R
For continuous numerical clinical features, two-tailed Student's t test with unequal variance (Lehmann and Romano 2005) was applied to compare the clinical values between tumors with and without gene mutations using 't.test' function in R
For binary or multi-class clinical features (nominal or ordinal), two-tailed Fisher's exact tests (Fisher 1922) were used to estimate the P values using the 'fisher.test' function in R
For multiple hypothesis correction, Q value is the False Discovery Rate (FDR) analogue of the P value (Benjamini and Hochberg 1995), defined as the minimum FDR at which the test may be called significant. We used the 'Benjamini and Hochberg' method of 'p.adjust' function in R to convert P values into Q values.
This is an experimental feature. The full results of the analysis summarized in this report can be downloaded from the TCGA Data Coordination Center.