(primary solid tumor cohort)
This pipeline uses various statistical tests to identify mRNAs whose expression levels correlated to selected clinical features.
Testing the association between 17814 genes and 7 clinical features across 27 samples, statistically thresholded by Q value < 0.05, 2 clinical features related to at least one genes.
-
13 genes correlated to 'GENDER'.
-
DDX3Y , RPS4Y1 , RPS4Y2 , EIF1AY , UTY , ...
-
1 gene correlated to 'HISTOLOGICAL.TYPE'.
-
PCDHA5
-
No genes correlated to 'Time to Death', 'AGE', 'KARNOFSKY.PERFORMANCE.SCORE', 'HISTOLOGICCLASSIFICATION', and 'RADIATIONS.RADIATION.REGIMENINDICATION'.
Complete statistical result table is provided in Supplement Table 1
Table 1. Get Full Table This table shows the clinical features, statistical methods used, and the number of genes that are significantly associated with each clinical feature at Q value < 0.05.
| Clinical feature | Statistical test | Significant genes | Associated with | Associated with | ||
|---|---|---|---|---|---|---|
| Time to Death | Cox regression test | N=0 | ||||
| AGE | Spearman correlation test | N=0 | ||||
| GENDER | t test | N=13 | male | N=13 | female | N=0 |
| KARNOFSKY PERFORMANCE SCORE | Spearman correlation test | N=0 | ||||
| HISTOLOGICAL TYPE | ANOVA test | N=1 | ||||
| HISTOLOGICCLASSIFICATION | t test | N=0 | ||||
| RADIATIONS RADIATION REGIMENINDICATION | t test | N=0 |
Table S1. Basic characteristics of clinical feature: 'Time to Death'
| Time to Death | Duration (Months) | 0.1-134.3 (median=46.6) |
| censored | N = 18 | |
| death | N = 9 | |
| Significant markers | N = 0 |
Table S2. Basic characteristics of clinical feature: 'AGE'
| AGE | Mean (SD) | 39.33 (9.1) |
| Significant markers | N = 0 |
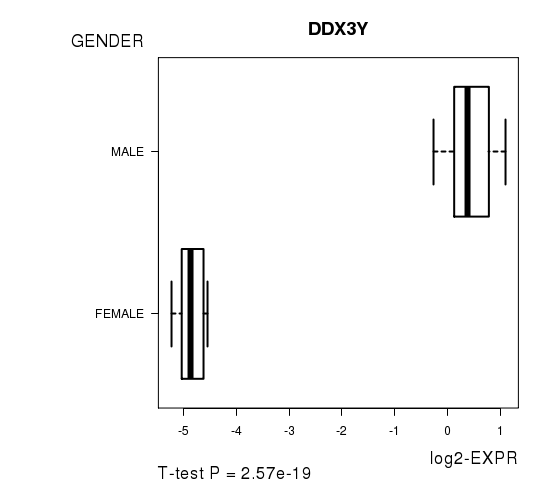
Table S3. Basic characteristics of clinical feature: 'GENDER'
| GENDER | Labels | N |
| FEMALE | 9 | |
| MALE | 18 | |
| Significant markers | N = 13 | |
| Higher in MALE | 13 | |
| Higher in FEMALE | 0 |
Table S4. Get Full Table List of top 10 genes differentially expressed by 'GENDER'
| T(pos if higher in 'MALE') | ttestP | Q | AUC | |
|---|---|---|---|---|
| DDX3Y | 27.22 | 2.571e-19 | 4.58e-15 | 1 |
| RPS4Y1 | 26.27 | 7.639e-19 | 1.36e-14 | 1 |
| RPS4Y2 | 22.72 | 7.422e-18 | 1.32e-13 | 1 |
| EIF1AY | 21.11 | 3.274e-15 | 5.83e-11 | 1 |
| UTY | 15.83 | 4.102e-14 | 7.31e-10 | 1 |
| TTTY14 | 14.98 | 9.764e-14 | 1.74e-09 | 1 |
| CYORF15B | 11.67 | 1.584e-11 | 2.82e-07 | 0.9815 |
| JARID1D | 13.62 | 3.137e-11 | 5.59e-07 | 1 |
| ZFY | 11.65 | 6.005e-11 | 1.07e-06 | 0.9753 |
| NLGN4Y | 9.19 | 1.73e-08 | 0.000308 | 0.9691 |
Figure S1. Get High-res Image As an example, this figure shows the association of DDX3Y to 'GENDER'. P value = 2.57e-19 with T-test analysis.
No gene related to 'KARNOFSKY.PERFORMANCE.SCORE'.
Table S5. Basic characteristics of clinical feature: 'KARNOFSKY.PERFORMANCE.SCORE'
| KARNOFSKY.PERFORMANCE.SCORE | Mean (SD) | 88.82 (12) |
| Score | N | |
| 50 | 1 | |
| 80 | 3 | |
| 90 | 8 | |
| 100 | 5 | |
| Significant markers | N = 0 |
Table S6. Basic characteristics of clinical feature: 'HISTOLOGICAL.TYPE'
| HISTOLOGICAL.TYPE | Labels | N |
| ASTROCYTOMA | 10 | |
| OLIGOASTROCYTOMA | 9 | |
| OLIGODENDROGLIOMA | 8 | |
| Significant markers | N = 1 |
Table S7. Get Full Table List of one gene differentially expressed by 'HISTOLOGICAL.TYPE'
| ANOVA_P | Q | |
|---|---|---|
| PCDHA5 | 8.339e-09 | 0.000149 |
Figure S2. Get High-res Image As an example, this figure shows the association of PCDHA5 to 'HISTOLOGICAL.TYPE'. P value = 8.34e-09 with ANOVA analysis.
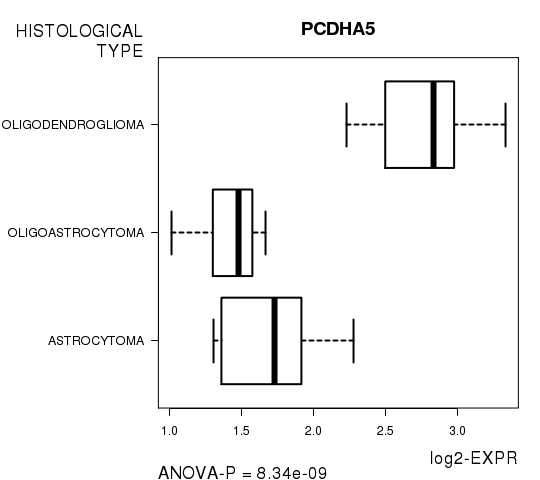
Table S8. Basic characteristics of clinical feature: 'HISTOLOGICCLASSIFICATION'
| HISTOLOGICCLASSIFICATION | Labels | N |
| GRADE II | 7 | |
| GRADE III | 20 | |
| Significant markers | N = 0 |
No gene related to 'RADIATIONS.RADIATION.REGIMENINDICATION'.
Table S9. Basic characteristics of clinical feature: 'RADIATIONS.RADIATION.REGIMENINDICATION'
| RADIATIONS.RADIATION.REGIMENINDICATION | Labels | N |
| NO | 19 | |
| YES | 8 | |
| Significant markers | N = 0 |
-
Expresson data file = LGG-TP.medianexp.txt
-
Clinical data file = LGG-TP.clin.merged.picked.txt
-
Number of patients = 27
-
Number of genes = 17814
-
Number of clinical features = 7
For survival clinical features, Wald's test in univariate Cox regression analysis with proportional hazards model (Andersen and Gill 1982) was used to estimate the P values using the 'coxph' function in R. Kaplan-Meier survival curves were plot using the four quartile subgroups of patients based on expression levels
For continuous numerical clinical features, Spearman's rank correlation coefficients (Spearman 1904) and two-tailed P values were estimated using 'cor.test' function in R
For two-class clinical features, two-tailed Student's t test with unequal variance (Lehmann and Romano 2005) was applied to compare the log2-expression levels between the two clinical classes using 't.test' function in R
For multi-class clinical features (ordinal or nominal), one-way analysis of variance (Howell 2002) was applied to compare the log2-expression levels between different clinical classes using 'anova' function in R
For multiple hypothesis correction, Q value is the False Discovery Rate (FDR) analogue of the P value (Benjamini and Hochberg 1995), defined as the minimum FDR at which the test may be called significant. We used the 'Benjamini and Hochberg' method of 'p.adjust' function in R to convert P values into Q values.
This is an experimental feature. The full results of the analysis summarized in this report can be downloaded from the TCGA Data Coordination Center.