(primary solid tumor cohort)
This pipeline computes the correlation between cancer subtypes identified by different molecular patterns and selected clinical features.
Testing the association between subtypes identified by 8 different clustering approaches and 7 clinical features across 208 patients, 17 significant findings detected with P value < 0.05 and Q value < 0.25.
-
CNMF clustering analysis on array-based mRNA expression data identified 3 subtypes that do not correlate to any clinical features.
-
Consensus hierarchical clustering analysis on array-based mRNA expression data identified 3 subtypes that do not correlate to any clinical features.
-
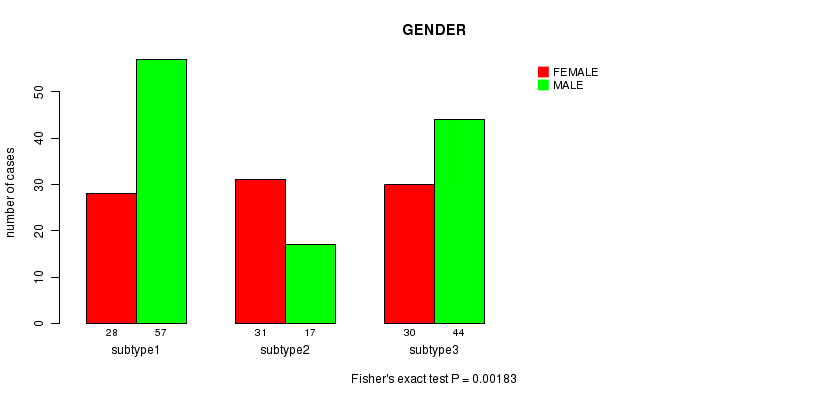
3 subtypes identified in current cancer cohort by 'Copy Number Ratio CNMF subtypes'. These subtypes correlate to 'Time to Death', 'AGE', 'GENDER', 'HISTOLOGICAL.TYPE', and 'HISTOLOGICCLASSIFICATION'.
-
4 subtypes identified in current cancer cohort by 'METHLYATION CNMF'. These subtypes correlate to 'Time to Death', 'AGE', 'HISTOLOGICAL.TYPE', 'HISTOLOGICCLASSIFICATION', and 'RADIATIONS.RADIATION.REGIMENINDICATION'.
-
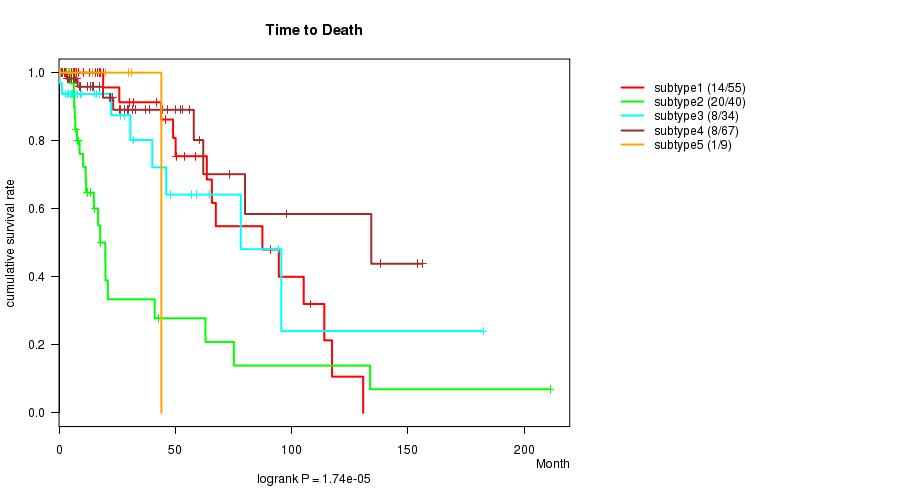
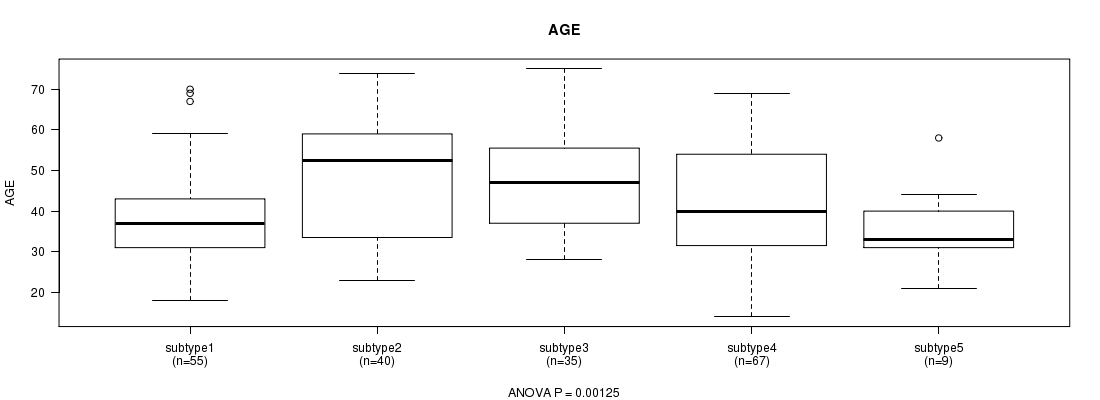
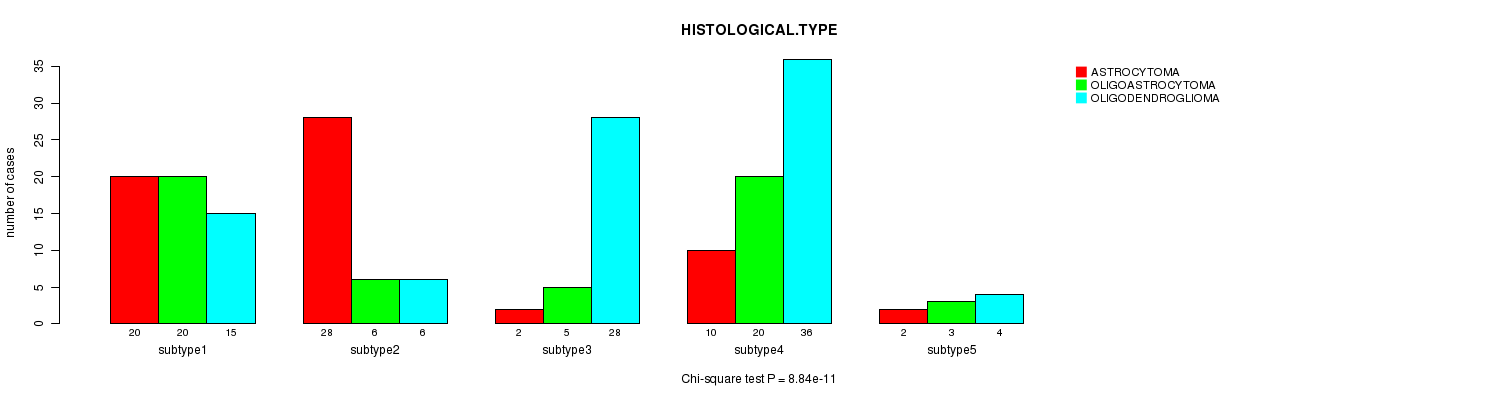
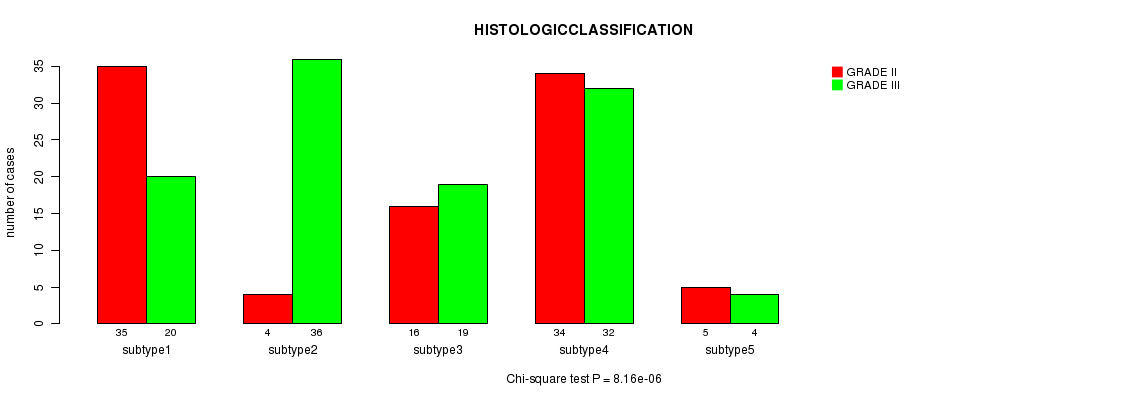
CNMF clustering analysis on sequencing-based mRNA expression data identified 5 subtypes that correlate to 'Time to Death', 'AGE', 'HISTOLOGICAL.TYPE', and 'HISTOLOGICCLASSIFICATION'.
-
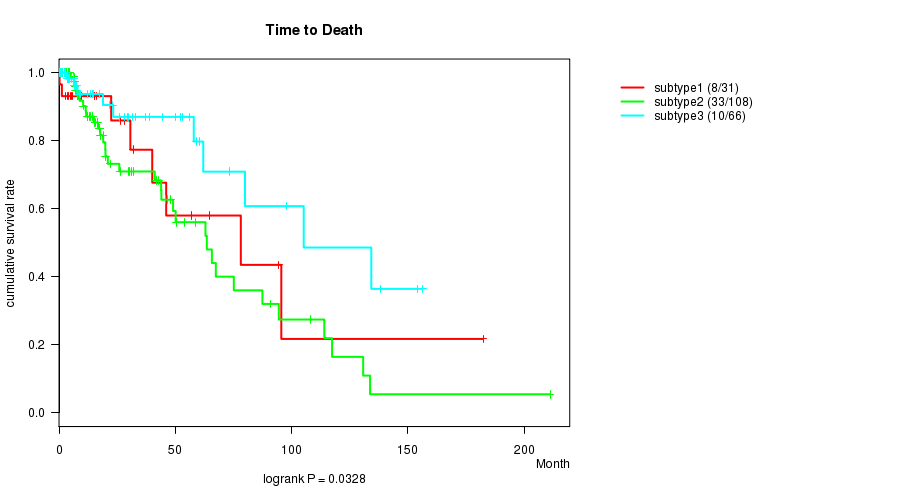
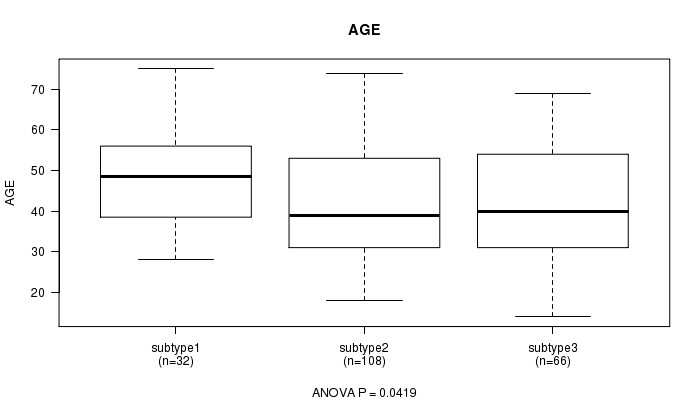
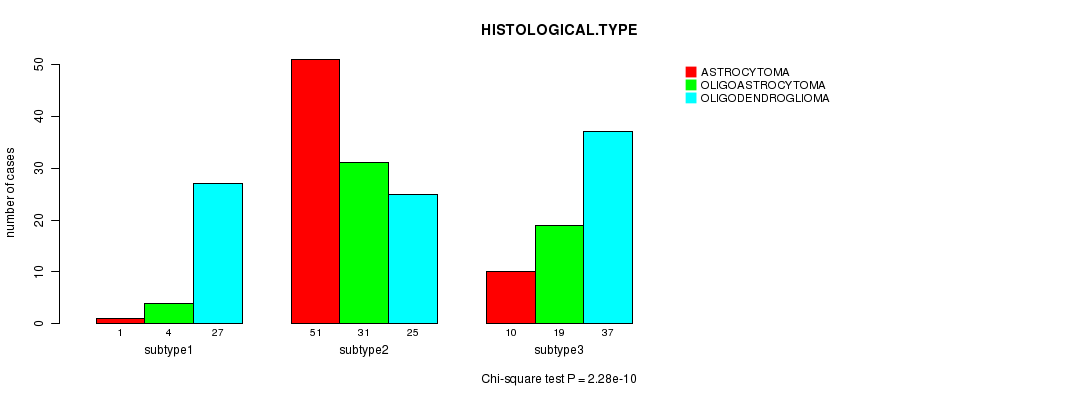
Consensus hierarchical clustering analysis on sequencing-based mRNA expression data identified 3 subtypes that correlate to 'HISTOLOGICAL.TYPE'.
-
4 subtypes identified in current cancer cohort by 'MIRSEQ CNMF'. These subtypes correlate to 'HISTOLOGICAL.TYPE'.
-
3 subtypes identified in current cancer cohort by 'MIRSEQ CHIERARCHICAL'. These subtypes correlate to 'HISTOLOGICAL.TYPE'.
Table 1. Get Full Table Overview of the association between subtypes identified by 8 different clustering approaches and 7 clinical features. Shown in the table are P values (Q values). Thresholded by P value < 0.05 and Q value < 0.25, 17 significant findings detected.
|
Clinical Features |
Time to Death |
AGE | GENDER |
KARNOFSKY PERFORMANCE SCORE |
HISTOLOGICAL TYPE |
HISTOLOGICCLASSIFICATION |
RADIATIONS RADIATION REGIMENINDICATION |
| Statistical Tests | logrank test | ANOVA | Fisher's exact test | ANOVA | Chi-square test | Fisher's exact test | Fisher's exact test |
| mRNA CNMF subtypes |
0.247 (1.00) |
0.326 (1.00) |
0.101 (1.00) |
0.441 (1.00) |
0.0226 (0.835) |
0.864 (1.00) |
0.384 (1.00) |
| mRNA cHierClus subtypes |
0.31 (1.00) |
0.467 (1.00) |
0.172 (1.00) |
0.441 (1.00) |
0.0136 (0.517) |
0.86 (1.00) |
0.757 (1.00) |
| Copy Number Ratio CNMF subtypes |
1.62e-05 (0.000744) |
6.39e-08 (3.32e-06) |
0.00183 (0.075) |
0.977 (1.00) |
2.47e-13 (1.36e-11) |
0.0013 (0.0546) |
0.0468 (1.00) |
| METHLYATION CNMF |
4.96e-06 (0.000238) |
2.41e-07 (1.23e-05) |
0.0514 (1.00) |
0.695 (1.00) |
2.93e-15 (1.64e-13) |
3.13e-07 (1.56e-05) |
3.67e-05 (0.00161) |
| RNAseq CNMF subtypes |
1.74e-05 (0.000782) |
0.00125 (0.0539) |
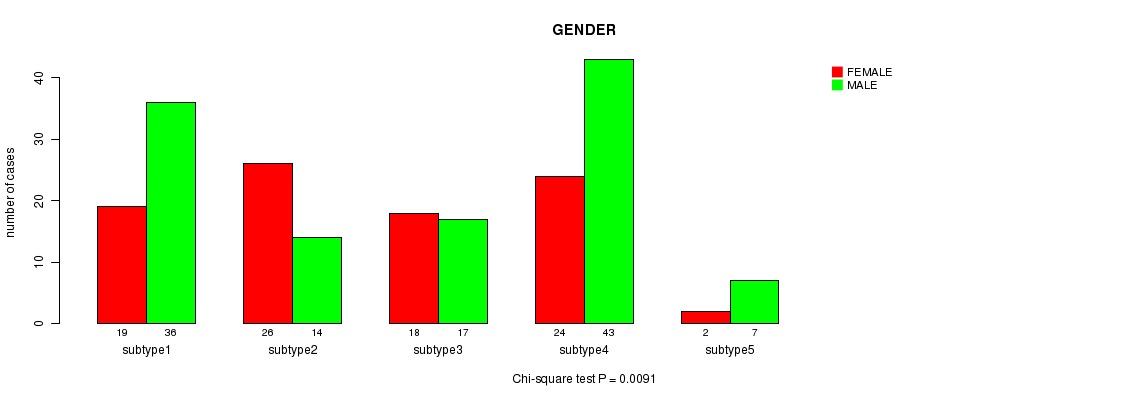
0.0091 (0.355) |
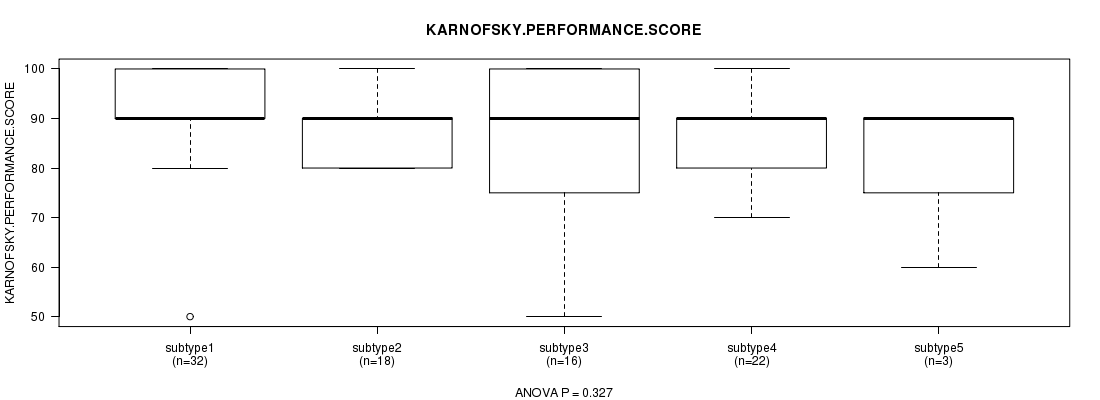
0.327 (1.00) |
8.84e-11 (4.78e-09) |
8.16e-06 (0.000383) |
0.0465 (1.00) |
| RNAseq cHierClus subtypes |
0.0328 (1.00) |
0.0419 (1.00) |
0.444 (1.00) |
0.245 (1.00) |
2.28e-10 (1.21e-08) |
0.22 (1.00) |
0.0253 (0.91) |
| MIRSEQ CNMF |
0.336 (1.00) |
0.392 (1.00) |
0.546 (1.00) |
0.282 (1.00) |
4.12e-07 (2.02e-05) |
0.204 (1.00) |
0.221 (1.00) |
| MIRSEQ CHIERARCHICAL |
0.0778 (1.00) |
0.566 (1.00) |
0.873 (1.00) |
0.0536 (1.00) |
0.00492 (0.197) |
0.428 (1.00) |
0.25 (1.00) |
Table S1. Get Full Table Description of clustering approach #1: 'mRNA CNMF subtypes'
| Cluster Labels | 1 | 2 | 3 |
|---|---|---|---|
| Number of samples | 9 | 10 | 8 |
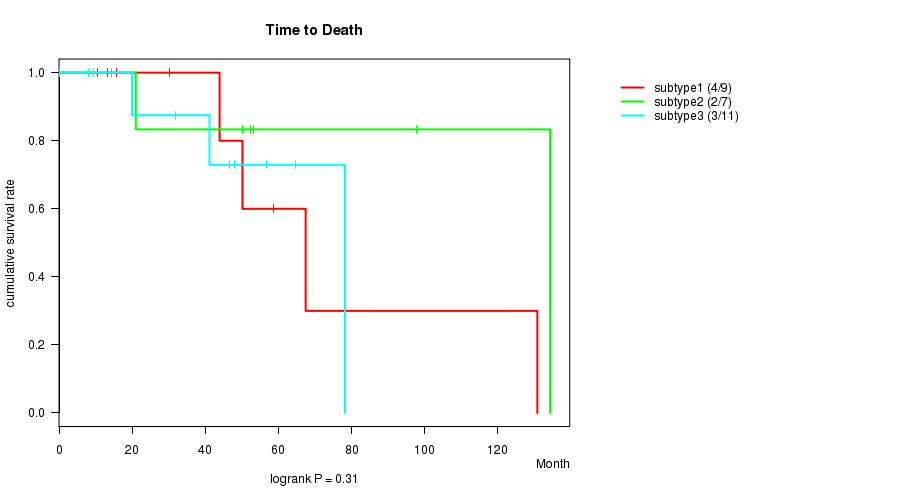
P value = 0.247 (logrank test), Q value = 1
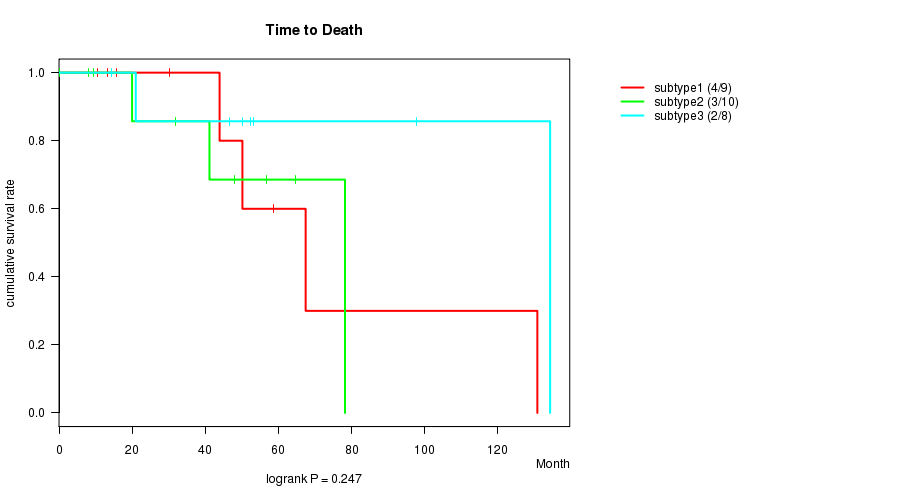
Table S2. Clustering Approach #1: 'mRNA CNMF subtypes' versus Clinical Feature #1: 'Time to Death'
| nPatients | nDeath | Duration Range (Median), Month | |
|---|---|---|---|
| ALL | 27 | 9 | 0.1 - 134.3 (46.6) |
| subtype1 | 9 | 4 | 10.6 - 130.8 (43.9) |
| subtype2 | 10 | 3 | 0.1 - 78.2 (36.5) |
| subtype3 | 8 | 2 | 14.4 - 134.3 (51.3) |
Figure S1. Get High-res Image Clustering Approach #1: 'mRNA CNMF subtypes' versus Clinical Feature #1: 'Time to Death'
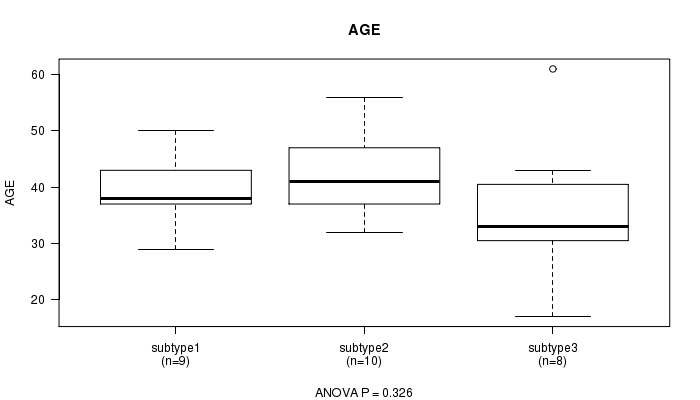
P value = 0.326 (ANOVA), Q value = 1
Table S3. Clustering Approach #1: 'mRNA CNMF subtypes' versus Clinical Feature #2: 'AGE'
| nPatients | Mean (Std.Dev) | |
|---|---|---|
| ALL | 27 | 39.3 (9.1) |
| subtype1 | 9 | 39.2 (6.2) |
| subtype2 | 10 | 42.3 (7.6) |
| subtype3 | 8 | 35.8 (12.6) |
Figure S2. Get High-res Image Clustering Approach #1: 'mRNA CNMF subtypes' versus Clinical Feature #2: 'AGE'
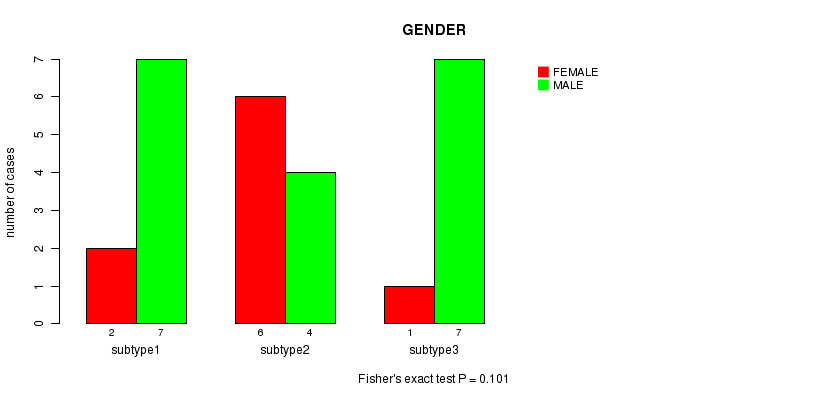
P value = 0.101 (Fisher's exact test), Q value = 1
Table S4. Clustering Approach #1: 'mRNA CNMF subtypes' versus Clinical Feature #3: 'GENDER'
| nPatients | FEMALE | MALE |
|---|---|---|
| ALL | 9 | 18 |
| subtype1 | 2 | 7 |
| subtype2 | 6 | 4 |
| subtype3 | 1 | 7 |
Figure S3. Get High-res Image Clustering Approach #1: 'mRNA CNMF subtypes' versus Clinical Feature #3: 'GENDER'
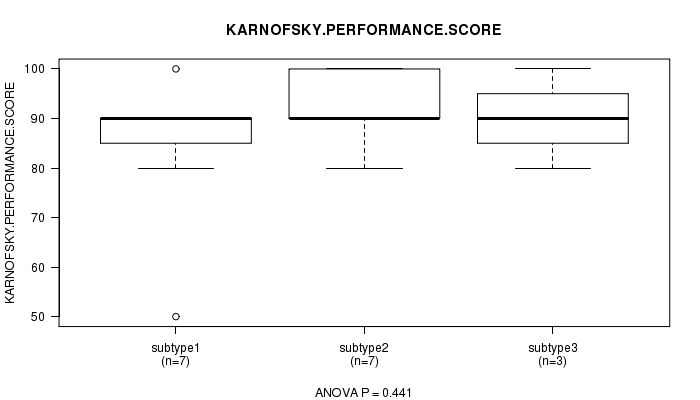
P value = 0.441 (ANOVA), Q value = 1
Table S5. Clustering Approach #1: 'mRNA CNMF subtypes' versus Clinical Feature #4: 'KARNOFSKY.PERFORMANCE.SCORE'
| nPatients | Mean (Std.Dev) | |
|---|---|---|
| ALL | 17 | 88.8 (12.2) |
| subtype1 | 7 | 84.3 (16.2) |
| subtype2 | 7 | 92.9 (7.6) |
| subtype3 | 3 | 90.0 (10.0) |
Figure S4. Get High-res Image Clustering Approach #1: 'mRNA CNMF subtypes' versus Clinical Feature #4: 'KARNOFSKY.PERFORMANCE.SCORE'
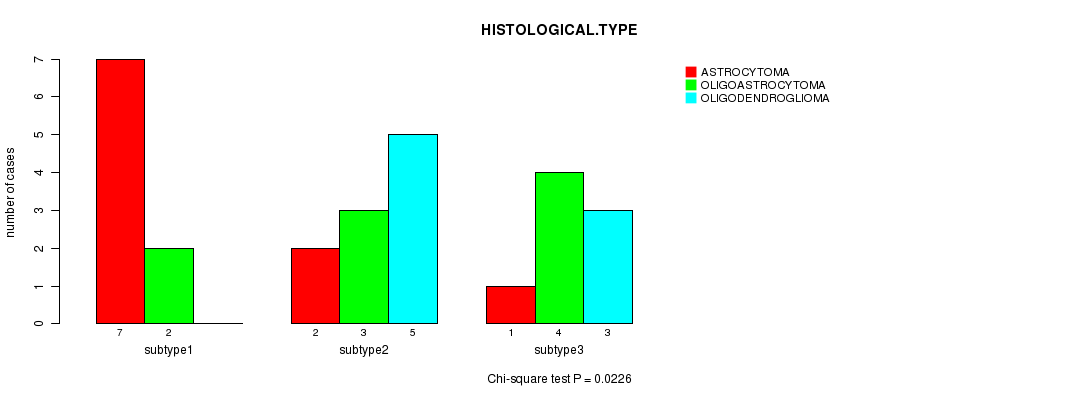
P value = 0.0226 (Chi-square test), Q value = 0.83
Table S6. Clustering Approach #1: 'mRNA CNMF subtypes' versus Clinical Feature #5: 'HISTOLOGICAL.TYPE'
| nPatients | ASTROCYTOMA | OLIGOASTROCYTOMA | OLIGODENDROGLIOMA |
|---|---|---|---|
| ALL | 10 | 9 | 8 |
| subtype1 | 7 | 2 | 0 |
| subtype2 | 2 | 3 | 5 |
| subtype3 | 1 | 4 | 3 |
Figure S5. Get High-res Image Clustering Approach #1: 'mRNA CNMF subtypes' versus Clinical Feature #5: 'HISTOLOGICAL.TYPE'
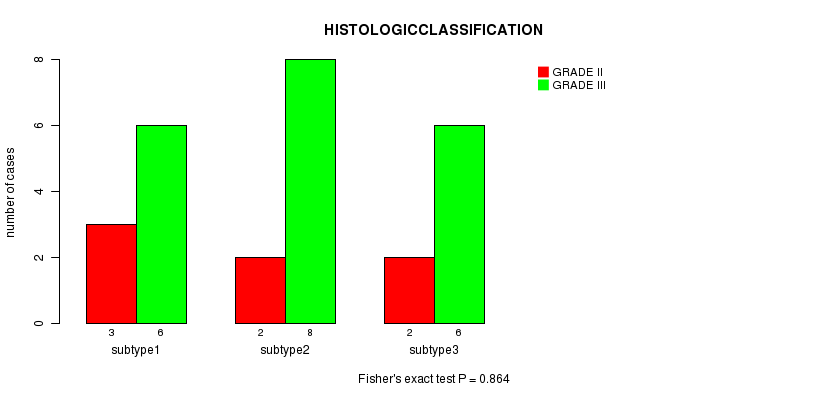
P value = 0.864 (Fisher's exact test), Q value = 1
Table S7. Clustering Approach #1: 'mRNA CNMF subtypes' versus Clinical Feature #6: 'HISTOLOGICCLASSIFICATION'
| nPatients | GRADE II | GRADE III |
|---|---|---|
| ALL | 7 | 20 |
| subtype1 | 3 | 6 |
| subtype2 | 2 | 8 |
| subtype3 | 2 | 6 |
Figure S6. Get High-res Image Clustering Approach #1: 'mRNA CNMF subtypes' versus Clinical Feature #6: 'HISTOLOGICCLASSIFICATION'
P value = 0.384 (Fisher's exact test), Q value = 1
Table S8. Clustering Approach #1: 'mRNA CNMF subtypes' versus Clinical Feature #7: 'RADIATIONS.RADIATION.REGIMENINDICATION'
| nPatients | NO | YES |
|---|---|---|
| ALL | 19 | 8 |
| subtype1 | 7 | 2 |
| subtype2 | 8 | 2 |
| subtype3 | 4 | 4 |
Figure S7. Get High-res Image Clustering Approach #1: 'mRNA CNMF subtypes' versus Clinical Feature #7: 'RADIATIONS.RADIATION.REGIMENINDICATION'
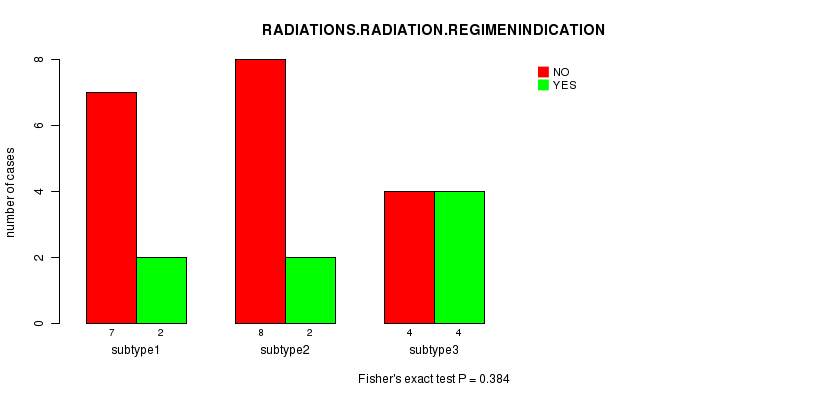
Table S9. Get Full Table Description of clustering approach #2: 'mRNA cHierClus subtypes'
| Cluster Labels | 1 | 2 | 3 |
|---|---|---|---|
| Number of samples | 9 | 7 | 11 |
P value = 0.31 (logrank test), Q value = 1
Table S10. Clustering Approach #2: 'mRNA cHierClus subtypes' versus Clinical Feature #1: 'Time to Death'
| nPatients | nDeath | Duration Range (Median), Month | |
|---|---|---|---|
| ALL | 27 | 9 | 0.1 - 134.3 (46.6) |
| subtype1 | 9 | 4 | 10.6 - 130.8 (43.9) |
| subtype2 | 7 | 2 | 14.4 - 134.3 (52.4) |
| subtype3 | 11 | 3 | 0.1 - 78.2 (41.1) |
Figure S8. Get High-res Image Clustering Approach #2: 'mRNA cHierClus subtypes' versus Clinical Feature #1: 'Time to Death'
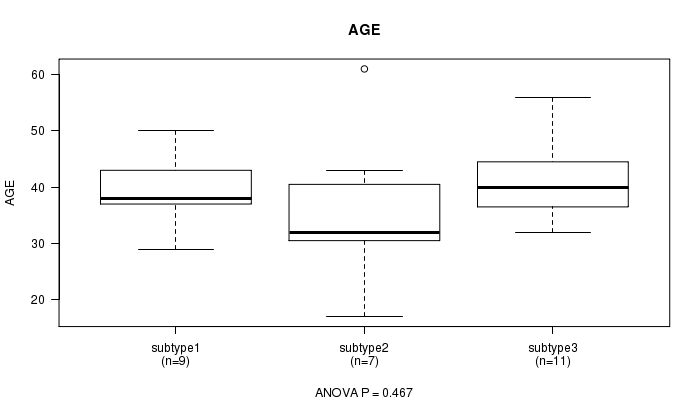
P value = 0.467 (ANOVA), Q value = 1
Table S11. Clustering Approach #2: 'mRNA cHierClus subtypes' versus Clinical Feature #2: 'AGE'
| nPatients | Mean (Std.Dev) | |
|---|---|---|
| ALL | 27 | 39.3 (9.1) |
| subtype1 | 9 | 39.2 (6.2) |
| subtype2 | 7 | 36.0 (13.6) |
| subtype3 | 11 | 41.5 (7.6) |
Figure S9. Get High-res Image Clustering Approach #2: 'mRNA cHierClus subtypes' versus Clinical Feature #2: 'AGE'
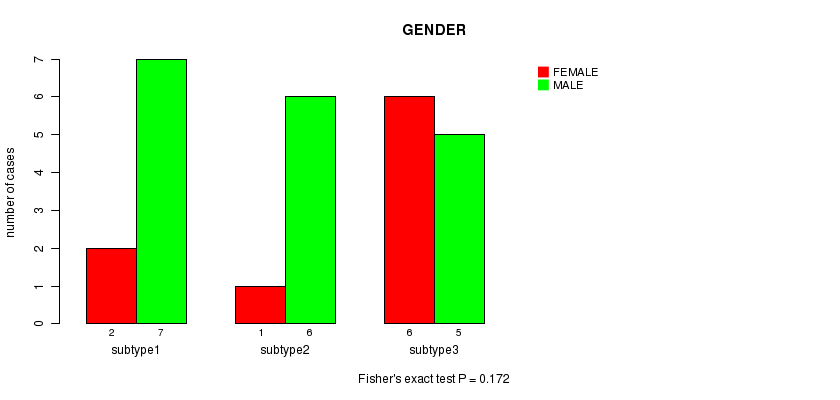
P value = 0.172 (Fisher's exact test), Q value = 1
Table S12. Clustering Approach #2: 'mRNA cHierClus subtypes' versus Clinical Feature #3: 'GENDER'
| nPatients | FEMALE | MALE |
|---|---|---|
| ALL | 9 | 18 |
| subtype1 | 2 | 7 |
| subtype2 | 1 | 6 |
| subtype3 | 6 | 5 |
Figure S10. Get High-res Image Clustering Approach #2: 'mRNA cHierClus subtypes' versus Clinical Feature #3: 'GENDER'
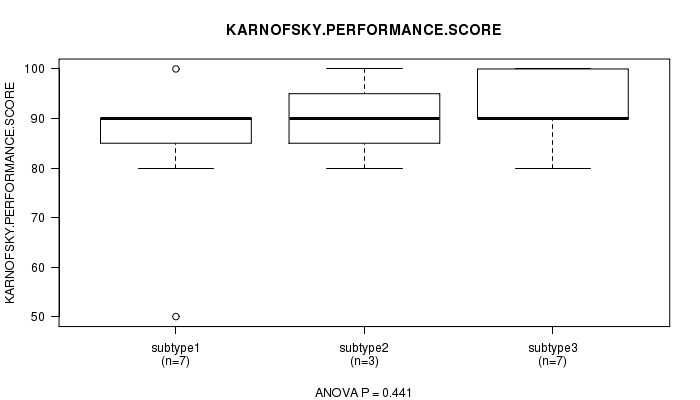
P value = 0.441 (ANOVA), Q value = 1
Table S13. Clustering Approach #2: 'mRNA cHierClus subtypes' versus Clinical Feature #4: 'KARNOFSKY.PERFORMANCE.SCORE'
| nPatients | Mean (Std.Dev) | |
|---|---|---|
| ALL | 17 | 88.8 (12.2) |
| subtype1 | 7 | 84.3 (16.2) |
| subtype2 | 3 | 90.0 (10.0) |
| subtype3 | 7 | 92.9 (7.6) |
Figure S11. Get High-res Image Clustering Approach #2: 'mRNA cHierClus subtypes' versus Clinical Feature #4: 'KARNOFSKY.PERFORMANCE.SCORE'
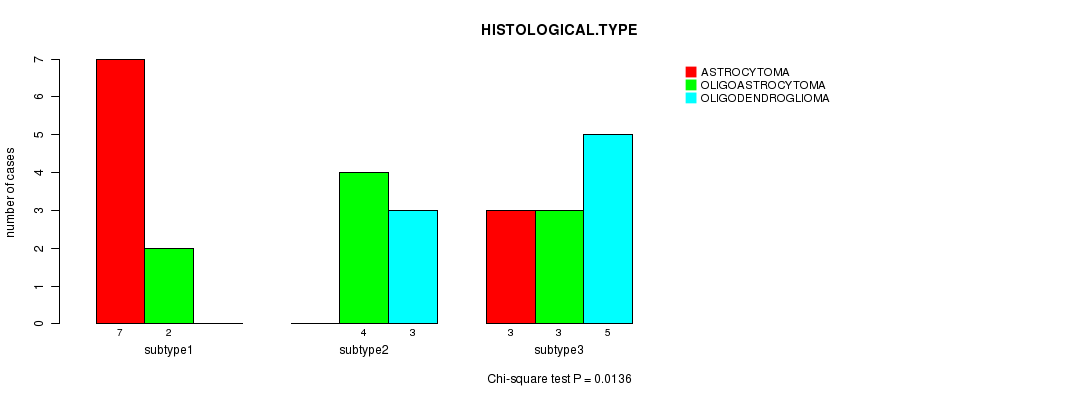
P value = 0.0136 (Chi-square test), Q value = 0.52
Table S14. Clustering Approach #2: 'mRNA cHierClus subtypes' versus Clinical Feature #5: 'HISTOLOGICAL.TYPE'
| nPatients | ASTROCYTOMA | OLIGOASTROCYTOMA | OLIGODENDROGLIOMA |
|---|---|---|---|
| ALL | 10 | 9 | 8 |
| subtype1 | 7 | 2 | 0 |
| subtype2 | 0 | 4 | 3 |
| subtype3 | 3 | 3 | 5 |
Figure S12. Get High-res Image Clustering Approach #2: 'mRNA cHierClus subtypes' versus Clinical Feature #5: 'HISTOLOGICAL.TYPE'
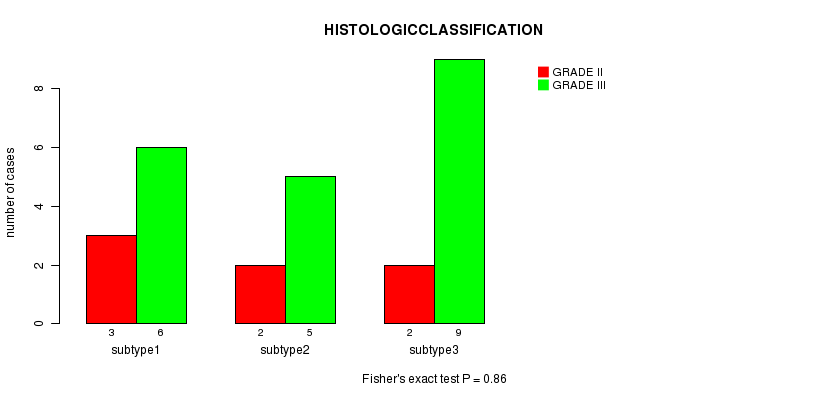
P value = 0.86 (Fisher's exact test), Q value = 1
Table S15. Clustering Approach #2: 'mRNA cHierClus subtypes' versus Clinical Feature #6: 'HISTOLOGICCLASSIFICATION'
| nPatients | GRADE II | GRADE III |
|---|---|---|
| ALL | 7 | 20 |
| subtype1 | 3 | 6 |
| subtype2 | 2 | 5 |
| subtype3 | 2 | 9 |
Figure S13. Get High-res Image Clustering Approach #2: 'mRNA cHierClus subtypes' versus Clinical Feature #6: 'HISTOLOGICCLASSIFICATION'
P value = 0.757 (Fisher's exact test), Q value = 1
Table S16. Clustering Approach #2: 'mRNA cHierClus subtypes' versus Clinical Feature #7: 'RADIATIONS.RADIATION.REGIMENINDICATION'
| nPatients | NO | YES |
|---|---|---|
| ALL | 19 | 8 |
| subtype1 | 7 | 2 |
| subtype2 | 4 | 3 |
| subtype3 | 8 | 3 |
Figure S14. Get High-res Image Clustering Approach #2: 'mRNA cHierClus subtypes' versus Clinical Feature #7: 'RADIATIONS.RADIATION.REGIMENINDICATION'
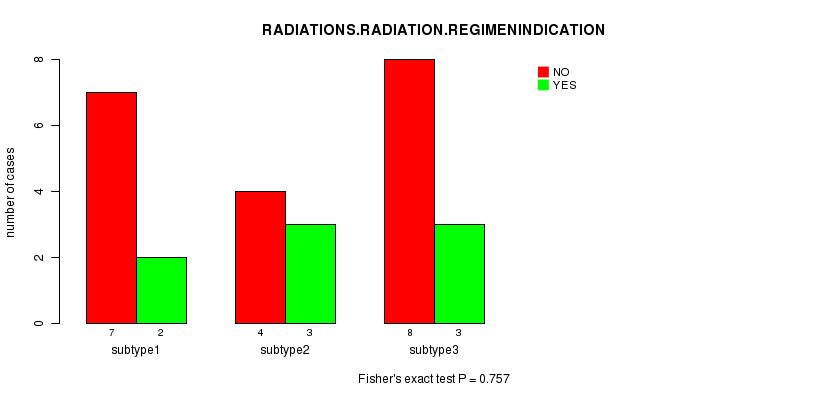
Table S17. Get Full Table Description of clustering approach #3: 'Copy Number Ratio CNMF subtypes'
| Cluster Labels | 1 | 2 | 3 |
|---|---|---|---|
| Number of samples | 85 | 48 | 74 |
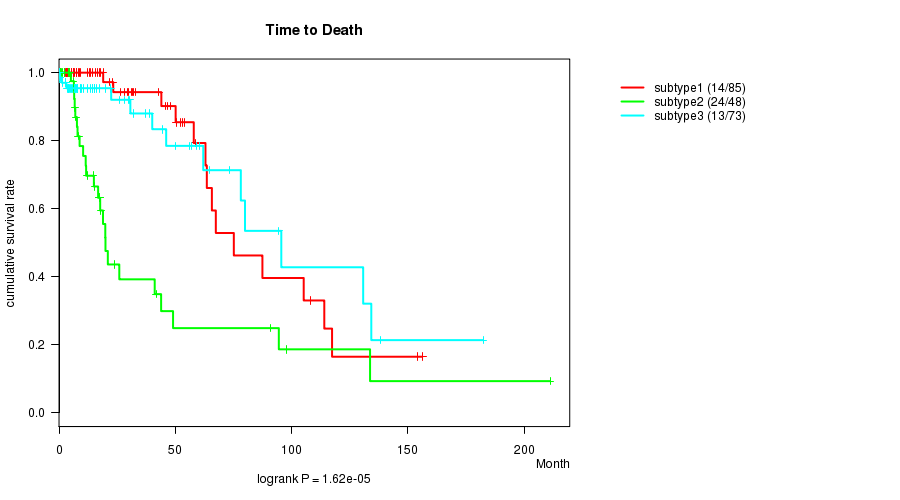
P value = 1.62e-05 (logrank test), Q value = 0.00074
Table S18. Clustering Approach #3: 'Copy Number Ratio CNMF subtypes' versus Clinical Feature #1: 'Time to Death'
| nPatients | nDeath | Duration Range (Median), Month | |
|---|---|---|---|
| ALL | 206 | 51 | 0.0 - 211.2 (13.4) |
| subtype1 | 85 | 14 | 0.1 - 156.2 (13.4) |
| subtype2 | 48 | 24 | 0.5 - 211.2 (11.9) |
| subtype3 | 73 | 13 | 0.0 - 182.3 (14.3) |
Figure S15. Get High-res Image Clustering Approach #3: 'Copy Number Ratio CNMF subtypes' versus Clinical Feature #1: 'Time to Death'
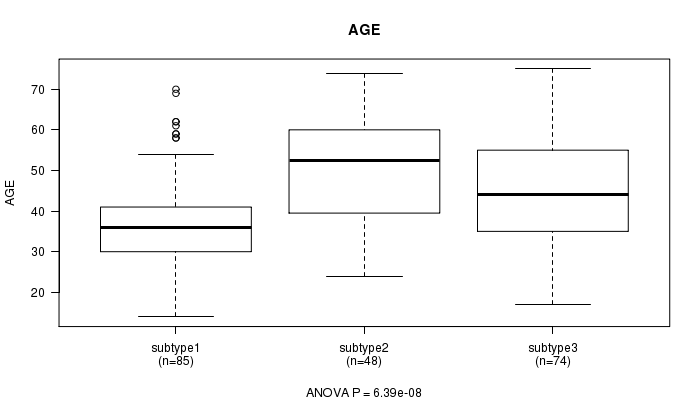
P value = 6.39e-08 (ANOVA), Q value = 3.3e-06
Table S19. Clustering Approach #3: 'Copy Number Ratio CNMF subtypes' versus Clinical Feature #2: 'AGE'
| nPatients | Mean (Std.Dev) | |
|---|---|---|
| ALL | 207 | 43.1 (13.4) |
| subtype1 | 85 | 37.3 (11.8) |
| subtype2 | 48 | 50.1 (12.9) |
| subtype3 | 74 | 45.2 (12.9) |
Figure S16. Get High-res Image Clustering Approach #3: 'Copy Number Ratio CNMF subtypes' versus Clinical Feature #2: 'AGE'
P value = 0.00183 (Fisher's exact test), Q value = 0.075
Table S20. Clustering Approach #3: 'Copy Number Ratio CNMF subtypes' versus Clinical Feature #3: 'GENDER'
| nPatients | FEMALE | MALE |
|---|---|---|
| ALL | 89 | 118 |
| subtype1 | 28 | 57 |
| subtype2 | 31 | 17 |
| subtype3 | 30 | 44 |
Figure S17. Get High-res Image Clustering Approach #3: 'Copy Number Ratio CNMF subtypes' versus Clinical Feature #3: 'GENDER'
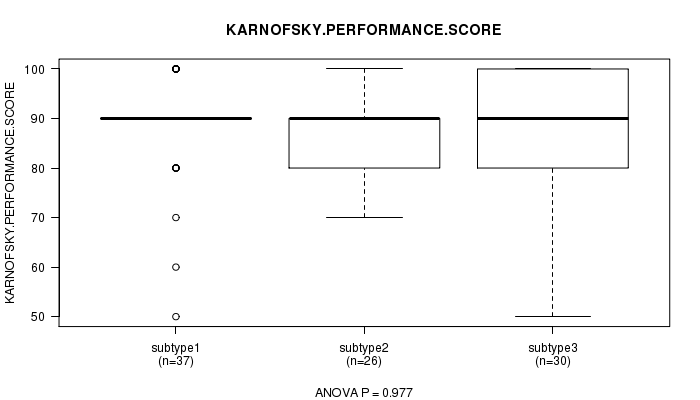
P value = 0.977 (ANOVA), Q value = 1
Table S21. Clustering Approach #3: 'Copy Number Ratio CNMF subtypes' versus Clinical Feature #4: 'KARNOFSKY.PERFORMANCE.SCORE'
| nPatients | Mean (Std.Dev) | |
|---|---|---|
| ALL | 93 | 88.4 (10.5) |
| subtype1 | 37 | 88.6 (10.8) |
| subtype2 | 26 | 88.1 (7.5) |
| subtype3 | 30 | 88.3 (12.3) |
Figure S18. Get High-res Image Clustering Approach #3: 'Copy Number Ratio CNMF subtypes' versus Clinical Feature #4: 'KARNOFSKY.PERFORMANCE.SCORE'
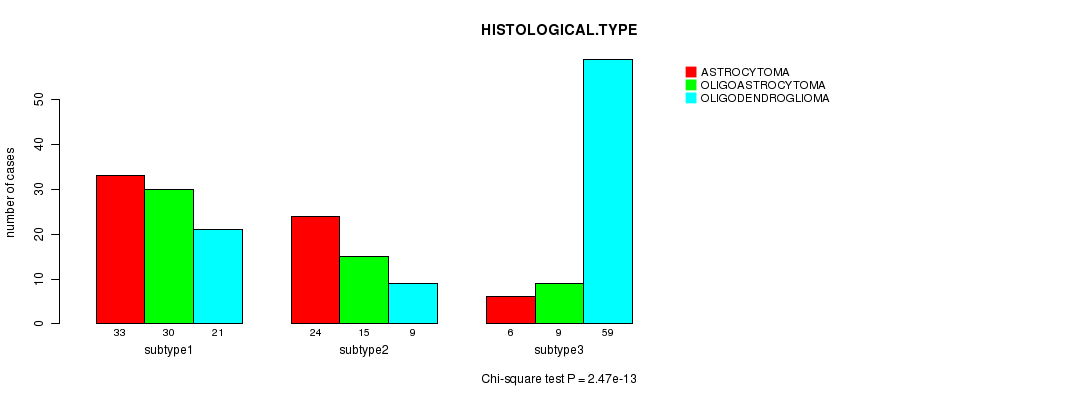
P value = 2.47e-13 (Chi-square test), Q value = 1.4e-11
Table S22. Clustering Approach #3: 'Copy Number Ratio CNMF subtypes' versus Clinical Feature #5: 'HISTOLOGICAL.TYPE'
| nPatients | ASTROCYTOMA | OLIGOASTROCYTOMA | OLIGODENDROGLIOMA |
|---|---|---|---|
| ALL | 63 | 54 | 89 |
| subtype1 | 33 | 30 | 21 |
| subtype2 | 24 | 15 | 9 |
| subtype3 | 6 | 9 | 59 |
Figure S19. Get High-res Image Clustering Approach #3: 'Copy Number Ratio CNMF subtypes' versus Clinical Feature #5: 'HISTOLOGICAL.TYPE'
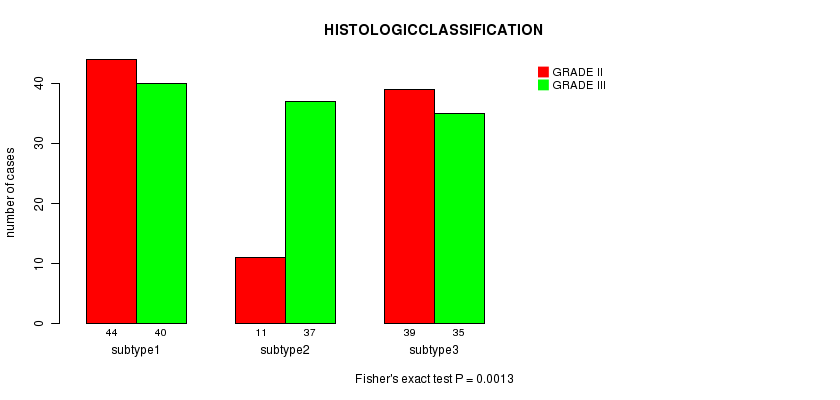
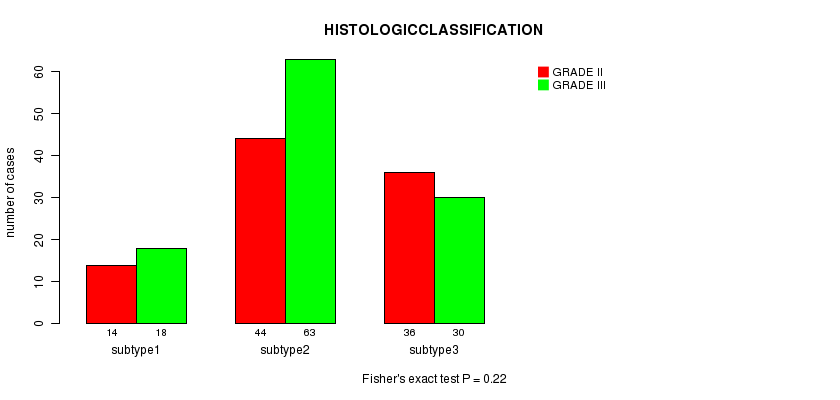
P value = 0.0013 (Fisher's exact test), Q value = 0.055
Table S23. Clustering Approach #3: 'Copy Number Ratio CNMF subtypes' versus Clinical Feature #6: 'HISTOLOGICCLASSIFICATION'
| nPatients | GRADE II | GRADE III |
|---|---|---|
| ALL | 94 | 112 |
| subtype1 | 44 | 40 |
| subtype2 | 11 | 37 |
| subtype3 | 39 | 35 |
Figure S20. Get High-res Image Clustering Approach #3: 'Copy Number Ratio CNMF subtypes' versus Clinical Feature #6: 'HISTOLOGICCLASSIFICATION'
P value = 0.0468 (Fisher's exact test), Q value = 1
Table S24. Clustering Approach #3: 'Copy Number Ratio CNMF subtypes' versus Clinical Feature #7: 'RADIATIONS.RADIATION.REGIMENINDICATION'
| nPatients | NO | YES |
|---|---|---|
| ALL | 104 | 103 |
| subtype1 | 46 | 39 |
| subtype2 | 29 | 19 |
| subtype3 | 29 | 45 |
Figure S21. Get High-res Image Clustering Approach #3: 'Copy Number Ratio CNMF subtypes' versus Clinical Feature #7: 'RADIATIONS.RADIATION.REGIMENINDICATION'
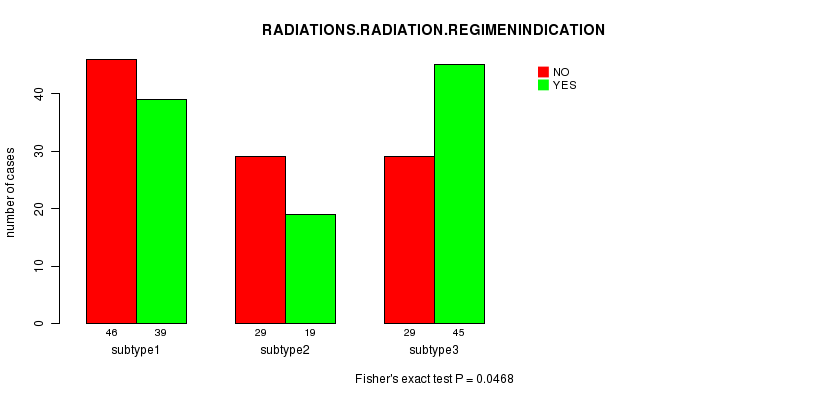
Table S25. Get Full Table Description of clustering approach #4: 'METHLYATION CNMF'
| Cluster Labels | 1 | 2 | 3 | 4 |
|---|---|---|---|---|
| Number of samples | 92 | 31 | 57 | 23 |
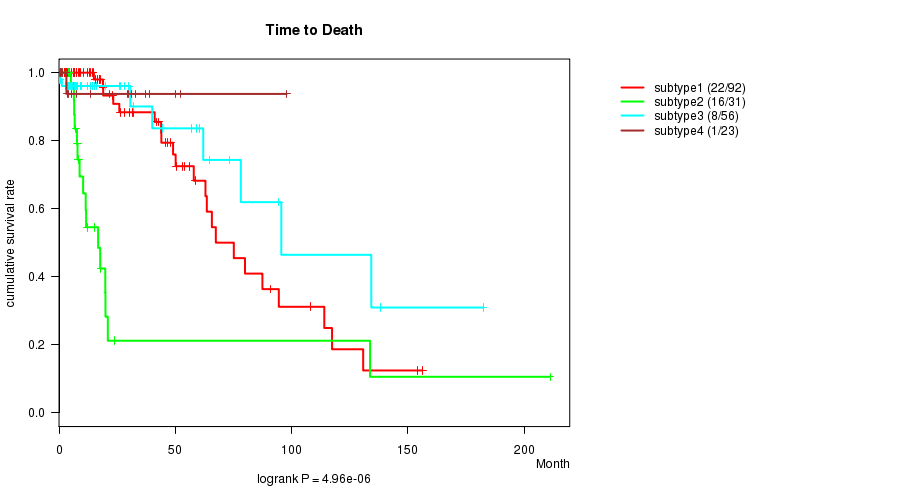
P value = 4.96e-06 (logrank test), Q value = 0.00024
Table S26. Clustering Approach #4: 'METHLYATION CNMF' versus Clinical Feature #1: 'Time to Death'
| nPatients | nDeath | Duration Range (Median), Month | |
|---|---|---|---|
| ALL | 202 | 47 | 0.0 - 211.2 (13.4) |
| subtype1 | 92 | 22 | 0.0 - 156.2 (17.4) |
| subtype2 | 31 | 16 | 0.1 - 211.2 (8.4) |
| subtype3 | 56 | 8 | 0.1 - 182.3 (12.9) |
| subtype4 | 23 | 1 | 0.1 - 97.9 (7.4) |
Figure S22. Get High-res Image Clustering Approach #4: 'METHLYATION CNMF' versus Clinical Feature #1: 'Time to Death'
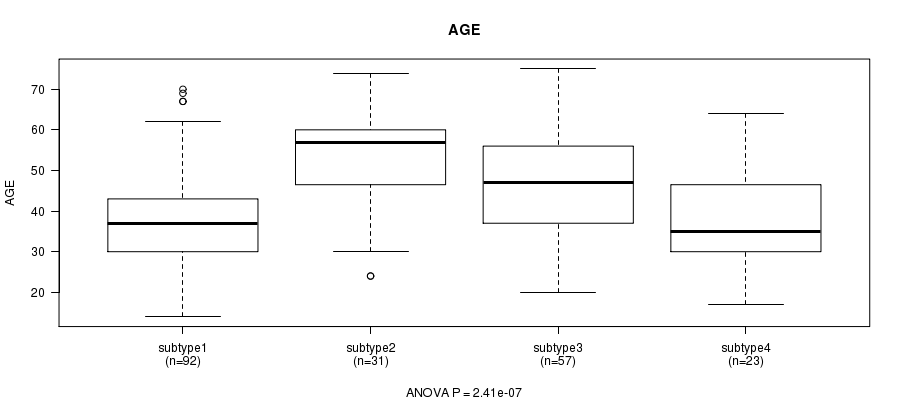
P value = 2.41e-07 (ANOVA), Q value = 1.2e-05
Table S27. Clustering Approach #4: 'METHLYATION CNMF' versus Clinical Feature #2: 'AGE'
| nPatients | Mean (Std.Dev) | |
|---|---|---|
| ALL | 203 | 43.0 (13.4) |
| subtype1 | 92 | 38.9 (11.8) |
| subtype2 | 31 | 52.6 (12.8) |
| subtype3 | 57 | 46.5 (12.7) |
| subtype4 | 23 | 38.3 (13.8) |
Figure S23. Get High-res Image Clustering Approach #4: 'METHLYATION CNMF' versus Clinical Feature #2: 'AGE'
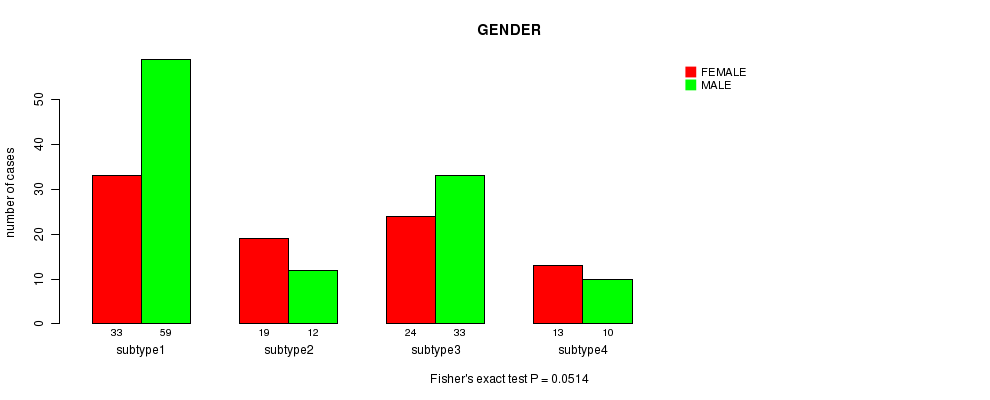
P value = 0.0514 (Fisher's exact test), Q value = 1
Table S28. Clustering Approach #4: 'METHLYATION CNMF' versus Clinical Feature #3: 'GENDER'
| nPatients | FEMALE | MALE |
|---|---|---|
| ALL | 89 | 114 |
| subtype1 | 33 | 59 |
| subtype2 | 19 | 12 |
| subtype3 | 24 | 33 |
| subtype4 | 13 | 10 |
Figure S24. Get High-res Image Clustering Approach #4: 'METHLYATION CNMF' versus Clinical Feature #3: 'GENDER'
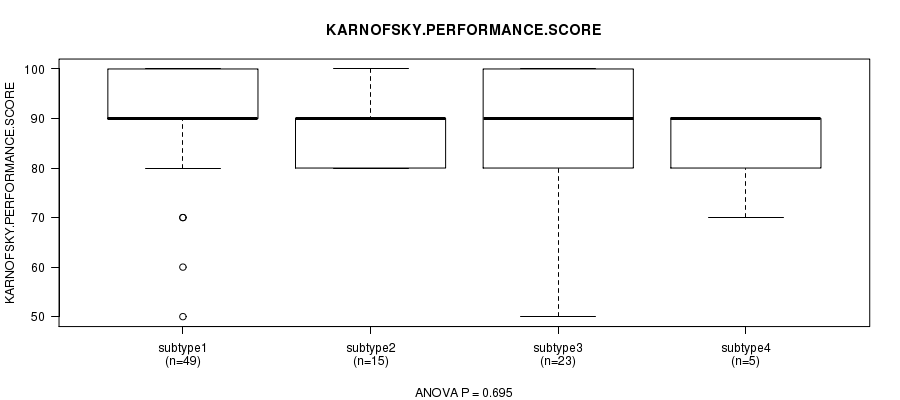
P value = 0.695 (ANOVA), Q value = 1
Table S29. Clustering Approach #4: 'METHLYATION CNMF' versus Clinical Feature #4: 'KARNOFSKY.PERFORMANCE.SCORE'
| nPatients | Mean (Std.Dev) | |
|---|---|---|
| ALL | 92 | 88.5 (10.5) |
| subtype1 | 49 | 89.4 (10.3) |
| subtype2 | 15 | 87.3 (5.9) |
| subtype3 | 23 | 88.3 (13.4) |
| subtype4 | 5 | 84.0 (8.9) |
Figure S25. Get High-res Image Clustering Approach #4: 'METHLYATION CNMF' versus Clinical Feature #4: 'KARNOFSKY.PERFORMANCE.SCORE'
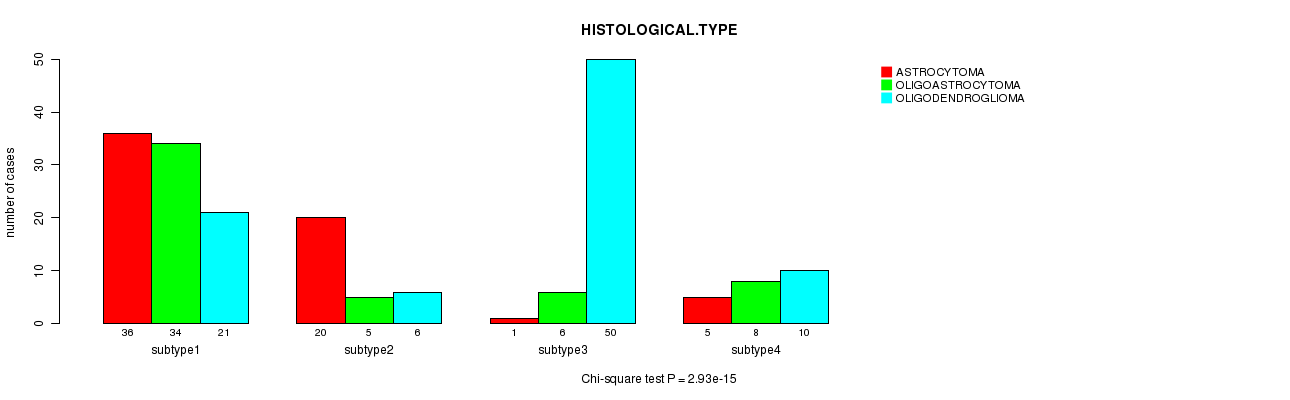
P value = 2.93e-15 (Chi-square test), Q value = 1.6e-13
Table S30. Clustering Approach #4: 'METHLYATION CNMF' versus Clinical Feature #5: 'HISTOLOGICAL.TYPE'
| nPatients | ASTROCYTOMA | OLIGOASTROCYTOMA | OLIGODENDROGLIOMA |
|---|---|---|---|
| ALL | 62 | 53 | 87 |
| subtype1 | 36 | 34 | 21 |
| subtype2 | 20 | 5 | 6 |
| subtype3 | 1 | 6 | 50 |
| subtype4 | 5 | 8 | 10 |
Figure S26. Get High-res Image Clustering Approach #4: 'METHLYATION CNMF' versus Clinical Feature #5: 'HISTOLOGICAL.TYPE'
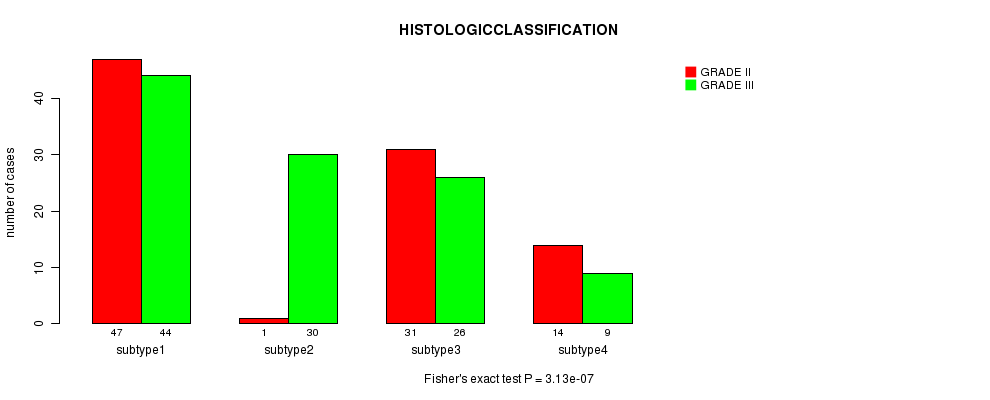
P value = 3.13e-07 (Fisher's exact test), Q value = 1.6e-05
Table S31. Clustering Approach #4: 'METHLYATION CNMF' versus Clinical Feature #6: 'HISTOLOGICCLASSIFICATION'
| nPatients | GRADE II | GRADE III |
|---|---|---|
| ALL | 93 | 109 |
| subtype1 | 47 | 44 |
| subtype2 | 1 | 30 |
| subtype3 | 31 | 26 |
| subtype4 | 14 | 9 |
Figure S27. Get High-res Image Clustering Approach #4: 'METHLYATION CNMF' versus Clinical Feature #6: 'HISTOLOGICCLASSIFICATION'
P value = 3.67e-05 (Fisher's exact test), Q value = 0.0016
Table S32. Clustering Approach #4: 'METHLYATION CNMF' versus Clinical Feature #7: 'RADIATIONS.RADIATION.REGIMENINDICATION'
| nPatients | NO | YES |
|---|---|---|
| ALL | 101 | 102 |
| subtype1 | 61 | 31 |
| subtype2 | 16 | 15 |
| subtype3 | 18 | 39 |
| subtype4 | 6 | 17 |
Figure S28. Get High-res Image Clustering Approach #4: 'METHLYATION CNMF' versus Clinical Feature #7: 'RADIATIONS.RADIATION.REGIMENINDICATION'
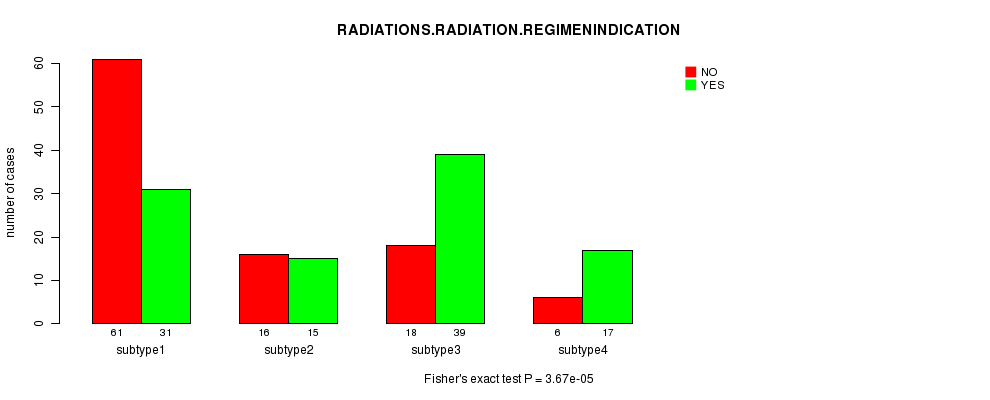
Table S33. Get Full Table Description of clustering approach #5: 'RNAseq CNMF subtypes'
| Cluster Labels | 1 | 2 | 3 | 4 | 5 |
|---|---|---|---|---|---|
| Number of samples | 55 | 40 | 35 | 67 | 9 |
P value = 1.74e-05 (logrank test), Q value = 0.00078
Table S34. Clustering Approach #5: 'RNAseq CNMF subtypes' versus Clinical Feature #1: 'Time to Death'
| nPatients | nDeath | Duration Range (Median), Month | |
|---|---|---|---|
| ALL | 205 | 51 | 0.0 - 211.2 (13.4) |
| subtype1 | 55 | 14 | 0.0 - 130.8 (16.5) |
| subtype2 | 40 | 20 | 0.1 - 211.2 (9.6) |
| subtype3 | 34 | 8 | 0.1 - 182.3 (15.8) |
| subtype4 | 67 | 8 | 0.1 - 156.2 (14.5) |
| subtype5 | 9 | 1 | 0.2 - 44.0 (14.3) |
Figure S29. Get High-res Image Clustering Approach #5: 'RNAseq CNMF subtypes' versus Clinical Feature #1: 'Time to Death'
P value = 0.00125 (ANOVA), Q value = 0.054
Table S35. Clustering Approach #5: 'RNAseq CNMF subtypes' versus Clinical Feature #2: 'AGE'
| nPatients | Mean (Std.Dev) | |
|---|---|---|
| ALL | 206 | 43.2 (13.4) |
| subtype1 | 55 | 38.8 (11.7) |
| subtype2 | 40 | 48.1 (14.0) |
| subtype3 | 35 | 47.5 (12.5) |
| subtype4 | 67 | 42.5 (13.8) |
| subtype5 | 9 | 36.2 (10.5) |
Figure S30. Get High-res Image Clustering Approach #5: 'RNAseq CNMF subtypes' versus Clinical Feature #2: 'AGE'
P value = 0.0091 (Chi-square test), Q value = 0.36
Table S36. Clustering Approach #5: 'RNAseq CNMF subtypes' versus Clinical Feature #3: 'GENDER'
| nPatients | FEMALE | MALE |
|---|---|---|
| ALL | 89 | 117 |
| subtype1 | 19 | 36 |
| subtype2 | 26 | 14 |
| subtype3 | 18 | 17 |
| subtype4 | 24 | 43 |
| subtype5 | 2 | 7 |
Figure S31. Get High-res Image Clustering Approach #5: 'RNAseq CNMF subtypes' versus Clinical Feature #3: 'GENDER'
P value = 0.327 (ANOVA), Q value = 1
Table S37. Clustering Approach #5: 'RNAseq CNMF subtypes' versus Clinical Feature #4: 'KARNOFSKY.PERFORMANCE.SCORE'
| nPatients | Mean (Std.Dev) | |
|---|---|---|
| ALL | 91 | 88.2 (10.5) |
| subtype1 | 32 | 90.9 (9.3) |
| subtype2 | 18 | 87.8 (5.5) |
| subtype3 | 16 | 86.9 (15.4) |
| subtype4 | 22 | 86.8 (9.9) |
| subtype5 | 3 | 80.0 (17.3) |
Figure S32. Get High-res Image Clustering Approach #5: 'RNAseq CNMF subtypes' versus Clinical Feature #4: 'KARNOFSKY.PERFORMANCE.SCORE'
P value = 8.84e-11 (Chi-square test), Q value = 4.8e-09
Table S38. Clustering Approach #5: 'RNAseq CNMF subtypes' versus Clinical Feature #5: 'HISTOLOGICAL.TYPE'
| nPatients | ASTROCYTOMA | OLIGOASTROCYTOMA | OLIGODENDROGLIOMA |
|---|---|---|---|
| ALL | 62 | 54 | 89 |
| subtype1 | 20 | 20 | 15 |
| subtype2 | 28 | 6 | 6 |
| subtype3 | 2 | 5 | 28 |
| subtype4 | 10 | 20 | 36 |
| subtype5 | 2 | 3 | 4 |
Figure S33. Get High-res Image Clustering Approach #5: 'RNAseq CNMF subtypes' versus Clinical Feature #5: 'HISTOLOGICAL.TYPE'
P value = 8.16e-06 (Chi-square test), Q value = 0.00038
Table S39. Clustering Approach #5: 'RNAseq CNMF subtypes' versus Clinical Feature #6: 'HISTOLOGICCLASSIFICATION'
| nPatients | GRADE II | GRADE III |
|---|---|---|
| ALL | 94 | 111 |
| subtype1 | 35 | 20 |
| subtype2 | 4 | 36 |
| subtype3 | 16 | 19 |
| subtype4 | 34 | 32 |
| subtype5 | 5 | 4 |
Figure S34. Get High-res Image Clustering Approach #5: 'RNAseq CNMF subtypes' versus Clinical Feature #6: 'HISTOLOGICCLASSIFICATION'
P value = 0.0465 (Chi-square test), Q value = 1
Table S40. Clustering Approach #5: 'RNAseq CNMF subtypes' versus Clinical Feature #7: 'RADIATIONS.RADIATION.REGIMENINDICATION'
| nPatients | NO | YES |
|---|---|---|
| ALL | 102 | 104 |
| subtype1 | 35 | 20 |
| subtype2 | 22 | 18 |
| subtype3 | 12 | 23 |
| subtype4 | 30 | 37 |
| subtype5 | 3 | 6 |
Figure S35. Get High-res Image Clustering Approach #5: 'RNAseq CNMF subtypes' versus Clinical Feature #7: 'RADIATIONS.RADIATION.REGIMENINDICATION'
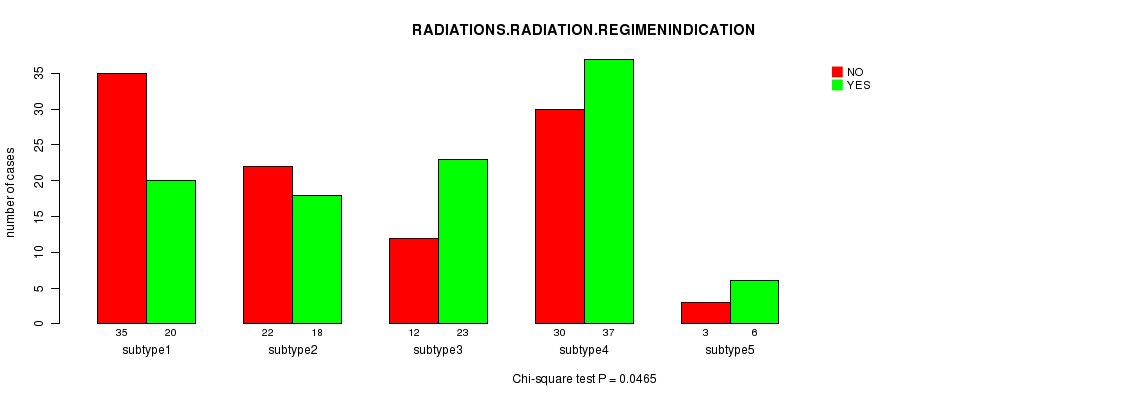
Table S41. Get Full Table Description of clustering approach #6: 'RNAseq cHierClus subtypes'
| Cluster Labels | 1 | 2 | 3 |
|---|---|---|---|
| Number of samples | 32 | 108 | 66 |
P value = 0.0328 (logrank test), Q value = 1
Table S42. Clustering Approach #6: 'RNAseq cHierClus subtypes' versus Clinical Feature #1: 'Time to Death'
| nPatients | nDeath | Duration Range (Median), Month | |
|---|---|---|---|
| ALL | 205 | 51 | 0.0 - 211.2 (13.4) |
| subtype1 | 31 | 8 | 0.1 - 182.3 (15.1) |
| subtype2 | 108 | 33 | 0.0 - 211.2 (12.9) |
| subtype3 | 66 | 10 | 0.1 - 156.2 (14.5) |
Figure S36. Get High-res Image Clustering Approach #6: 'RNAseq cHierClus subtypes' versus Clinical Feature #1: 'Time to Death'
P value = 0.0419 (ANOVA), Q value = 1
Table S43. Clustering Approach #6: 'RNAseq cHierClus subtypes' versus Clinical Feature #2: 'AGE'
| nPatients | Mean (Std.Dev) | |
|---|---|---|
| ALL | 206 | 43.2 (13.4) |
| subtype1 | 32 | 48.6 (12.4) |
| subtype2 | 108 | 42.0 (13.2) |
| subtype3 | 66 | 42.5 (13.7) |
Figure S37. Get High-res Image Clustering Approach #6: 'RNAseq cHierClus subtypes' versus Clinical Feature #2: 'AGE'
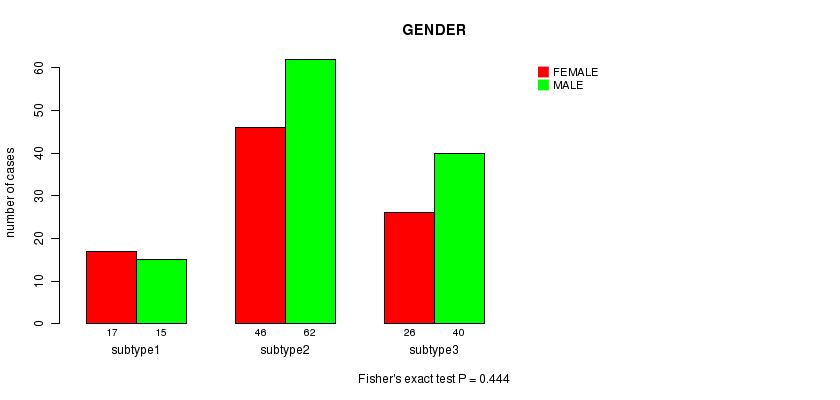
P value = 0.444 (Fisher's exact test), Q value = 1
Table S44. Clustering Approach #6: 'RNAseq cHierClus subtypes' versus Clinical Feature #3: 'GENDER'
| nPatients | FEMALE | MALE |
|---|---|---|
| ALL | 89 | 117 |
| subtype1 | 17 | 15 |
| subtype2 | 46 | 62 |
| subtype3 | 26 | 40 |
Figure S38. Get High-res Image Clustering Approach #6: 'RNAseq cHierClus subtypes' versus Clinical Feature #3: 'GENDER'
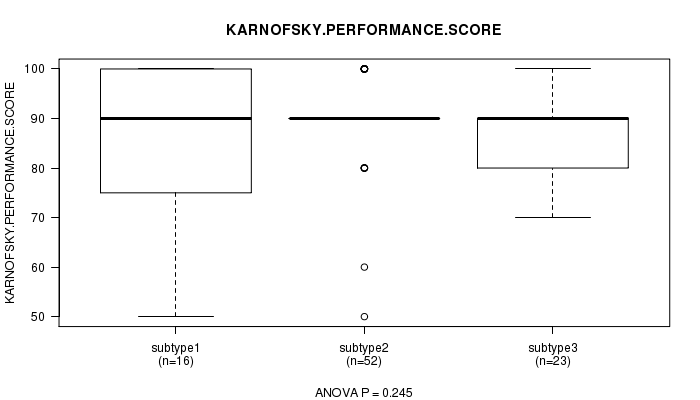
P value = 0.245 (ANOVA), Q value = 1
Table S45. Clustering Approach #6: 'RNAseq cHierClus subtypes' versus Clinical Feature #4: 'KARNOFSKY.PERFORMANCE.SCORE'
| nPatients | Mean (Std.Dev) | |
|---|---|---|
| ALL | 91 | 88.2 (10.5) |
| subtype1 | 16 | 86.9 (15.4) |
| subtype2 | 52 | 89.8 (9.0) |
| subtype3 | 23 | 85.7 (9.5) |
Figure S39. Get High-res Image Clustering Approach #6: 'RNAseq cHierClus subtypes' versus Clinical Feature #4: 'KARNOFSKY.PERFORMANCE.SCORE'
P value = 2.28e-10 (Chi-square test), Q value = 1.2e-08
Table S46. Clustering Approach #6: 'RNAseq cHierClus subtypes' versus Clinical Feature #5: 'HISTOLOGICAL.TYPE'
| nPatients | ASTROCYTOMA | OLIGOASTROCYTOMA | OLIGODENDROGLIOMA |
|---|---|---|---|
| ALL | 62 | 54 | 89 |
| subtype1 | 1 | 4 | 27 |
| subtype2 | 51 | 31 | 25 |
| subtype3 | 10 | 19 | 37 |
Figure S40. Get High-res Image Clustering Approach #6: 'RNAseq cHierClus subtypes' versus Clinical Feature #5: 'HISTOLOGICAL.TYPE'
P value = 0.22 (Fisher's exact test), Q value = 1
Table S47. Clustering Approach #6: 'RNAseq cHierClus subtypes' versus Clinical Feature #6: 'HISTOLOGICCLASSIFICATION'
| nPatients | GRADE II | GRADE III |
|---|---|---|
| ALL | 94 | 111 |
| subtype1 | 14 | 18 |
| subtype2 | 44 | 63 |
| subtype3 | 36 | 30 |
Figure S41. Get High-res Image Clustering Approach #6: 'RNAseq cHierClus subtypes' versus Clinical Feature #6: 'HISTOLOGICCLASSIFICATION'
P value = 0.0253 (Fisher's exact test), Q value = 0.91
Table S48. Clustering Approach #6: 'RNAseq cHierClus subtypes' versus Clinical Feature #7: 'RADIATIONS.RADIATION.REGIMENINDICATION'
| nPatients | NO | YES |
|---|---|---|
| ALL | 102 | 104 |
| subtype1 | 10 | 22 |
| subtype2 | 62 | 46 |
| subtype3 | 30 | 36 |
Figure S42. Get High-res Image Clustering Approach #6: 'RNAseq cHierClus subtypes' versus Clinical Feature #7: 'RADIATIONS.RADIATION.REGIMENINDICATION'
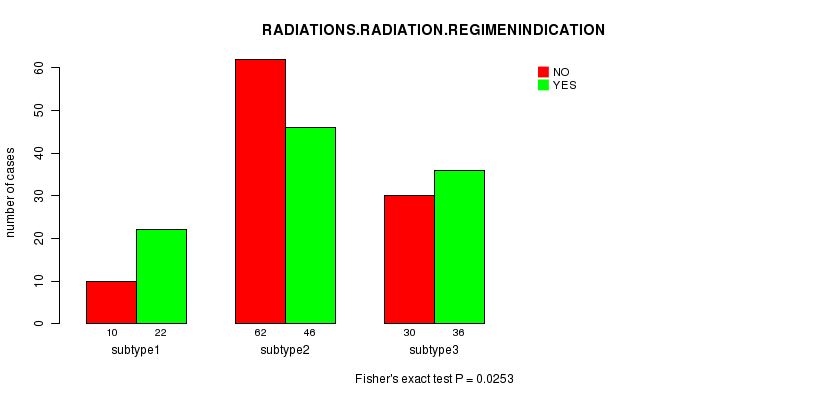
Table S49. Get Full Table Description of clustering approach #7: 'MIRSEQ CNMF'
| Cluster Labels | 1 | 2 | 3 | 4 |
|---|---|---|---|---|
| Number of samples | 47 | 46 | 32 | 82 |
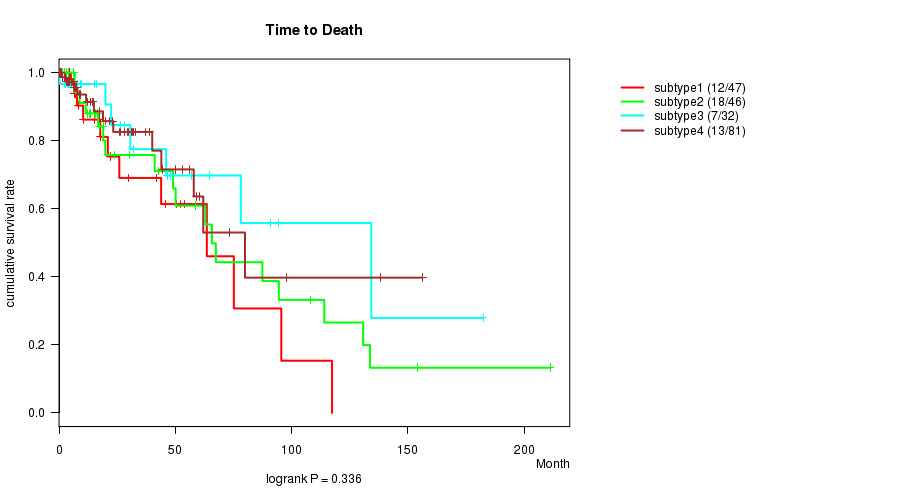
P value = 0.336 (logrank test), Q value = 1
Table S50. Clustering Approach #7: 'MIRSEQ CNMF' versus Clinical Feature #1: 'Time to Death'
| nPatients | nDeath | Duration Range (Median), Month | |
|---|---|---|---|
| ALL | 206 | 50 | 0.0 - 211.2 (13.4) |
| subtype1 | 47 | 12 | 0.0 - 117.4 (8.4) |
| subtype2 | 46 | 18 | 0.1 - 211.2 (16.7) |
| subtype3 | 32 | 7 | 0.1 - 182.3 (18.1) |
| subtype4 | 81 | 13 | 0.1 - 156.2 (12.4) |
Figure S43. Get High-res Image Clustering Approach #7: 'MIRSEQ CNMF' versus Clinical Feature #1: 'Time to Death'
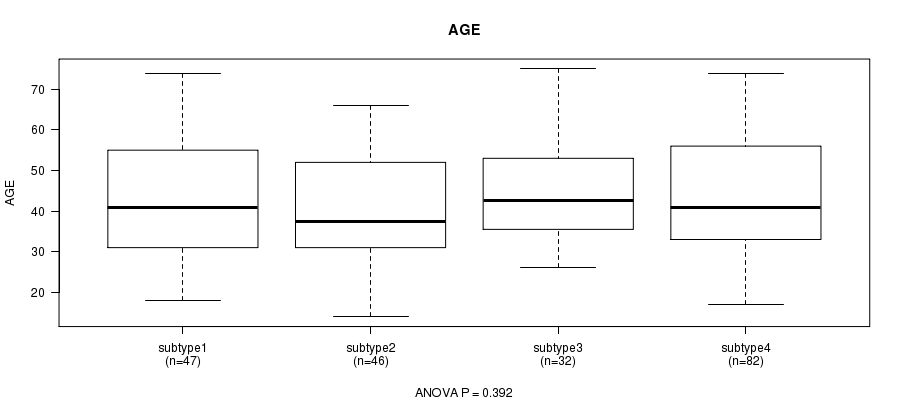
P value = 0.392 (ANOVA), Q value = 1
Table S51. Clustering Approach #7: 'MIRSEQ CNMF' versus Clinical Feature #2: 'AGE'
| nPatients | Mean (Std.Dev) | |
|---|---|---|
| ALL | 207 | 43.2 (13.4) |
| subtype1 | 47 | 41.8 (14.1) |
| subtype2 | 46 | 41.1 (13.0) |
| subtype3 | 32 | 44.9 (12.0) |
| subtype4 | 82 | 44.6 (13.7) |
Figure S44. Get High-res Image Clustering Approach #7: 'MIRSEQ CNMF' versus Clinical Feature #2: 'AGE'
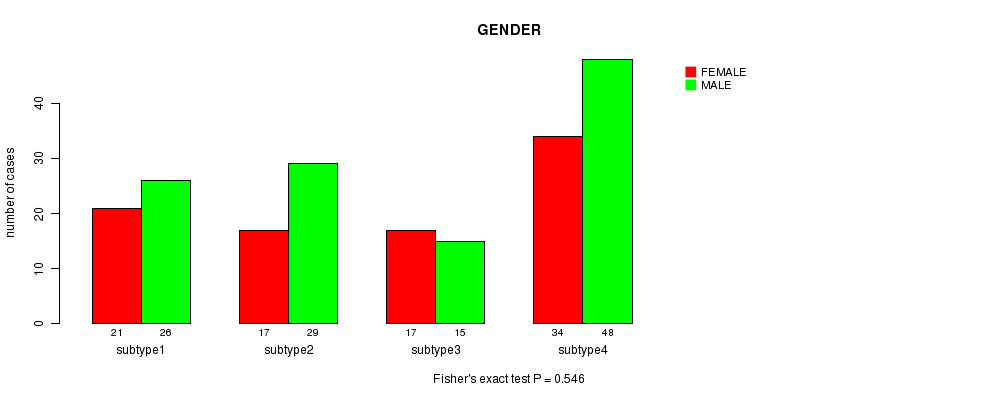
P value = 0.546 (Fisher's exact test), Q value = 1
Table S52. Clustering Approach #7: 'MIRSEQ CNMF' versus Clinical Feature #3: 'GENDER'
| nPatients | FEMALE | MALE |
|---|---|---|
| ALL | 89 | 118 |
| subtype1 | 21 | 26 |
| subtype2 | 17 | 29 |
| subtype3 | 17 | 15 |
| subtype4 | 34 | 48 |
Figure S45. Get High-res Image Clustering Approach #7: 'MIRSEQ CNMF' versus Clinical Feature #3: 'GENDER'
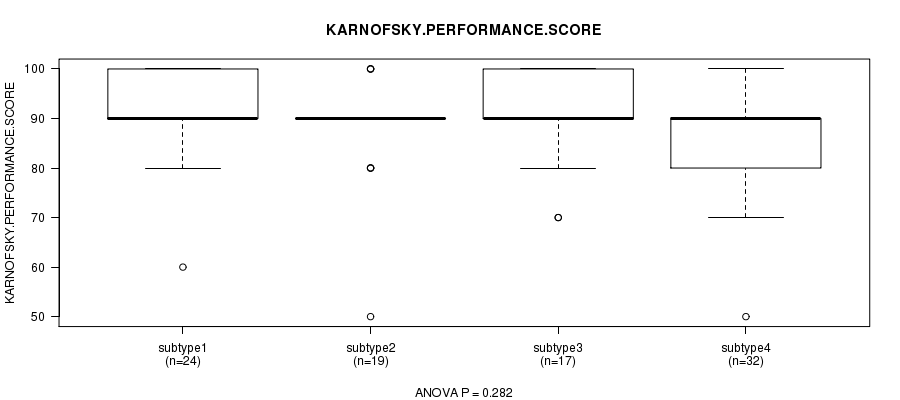
P value = 0.282 (ANOVA), Q value = 1
Table S53. Clustering Approach #7: 'MIRSEQ CNMF' versus Clinical Feature #4: 'KARNOFSKY.PERFORMANCE.SCORE'
| nPatients | Mean (Std.Dev) | |
|---|---|---|
| ALL | 92 | 88.5 (10.5) |
| subtype1 | 24 | 90.8 (8.8) |
| subtype2 | 19 | 87.9 (10.8) |
| subtype3 | 17 | 90.6 (10.3) |
| subtype4 | 32 | 85.9 (11.3) |
Figure S46. Get High-res Image Clustering Approach #7: 'MIRSEQ CNMF' versus Clinical Feature #4: 'KARNOFSKY.PERFORMANCE.SCORE'
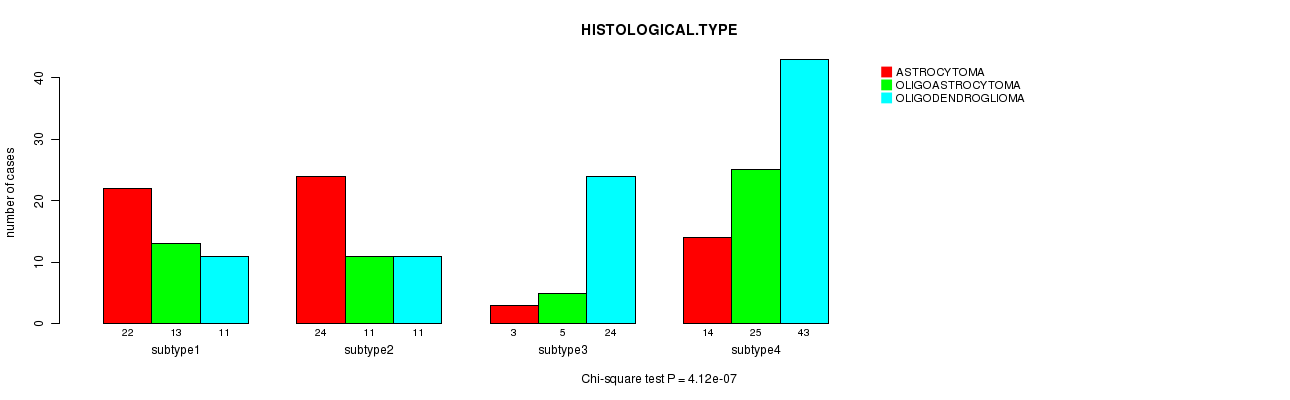
P value = 4.12e-07 (Chi-square test), Q value = 2e-05
Table S54. Clustering Approach #7: 'MIRSEQ CNMF' versus Clinical Feature #5: 'HISTOLOGICAL.TYPE'
| nPatients | ASTROCYTOMA | OLIGOASTROCYTOMA | OLIGODENDROGLIOMA |
|---|---|---|---|
| ALL | 63 | 54 | 89 |
| subtype1 | 22 | 13 | 11 |
| subtype2 | 24 | 11 | 11 |
| subtype3 | 3 | 5 | 24 |
| subtype4 | 14 | 25 | 43 |
Figure S47. Get High-res Image Clustering Approach #7: 'MIRSEQ CNMF' versus Clinical Feature #5: 'HISTOLOGICAL.TYPE'
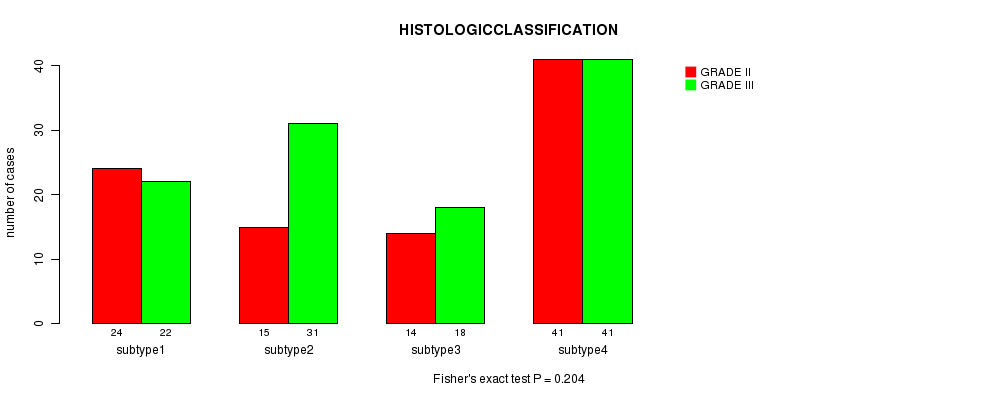
P value = 0.204 (Fisher's exact test), Q value = 1
Table S55. Clustering Approach #7: 'MIRSEQ CNMF' versus Clinical Feature #6: 'HISTOLOGICCLASSIFICATION'
| nPatients | GRADE II | GRADE III |
|---|---|---|
| ALL | 94 | 112 |
| subtype1 | 24 | 22 |
| subtype2 | 15 | 31 |
| subtype3 | 14 | 18 |
| subtype4 | 41 | 41 |
Figure S48. Get High-res Image Clustering Approach #7: 'MIRSEQ CNMF' versus Clinical Feature #6: 'HISTOLOGICCLASSIFICATION'
P value = 0.221 (Fisher's exact test), Q value = 1
Table S56. Clustering Approach #7: 'MIRSEQ CNMF' versus Clinical Feature #7: 'RADIATIONS.RADIATION.REGIMENINDICATION'
| nPatients | NO | YES |
|---|---|---|
| ALL | 103 | 104 |
| subtype1 | 23 | 24 |
| subtype2 | 29 | 17 |
| subtype3 | 14 | 18 |
| subtype4 | 37 | 45 |
Figure S49. Get High-res Image Clustering Approach #7: 'MIRSEQ CNMF' versus Clinical Feature #7: 'RADIATIONS.RADIATION.REGIMENINDICATION'
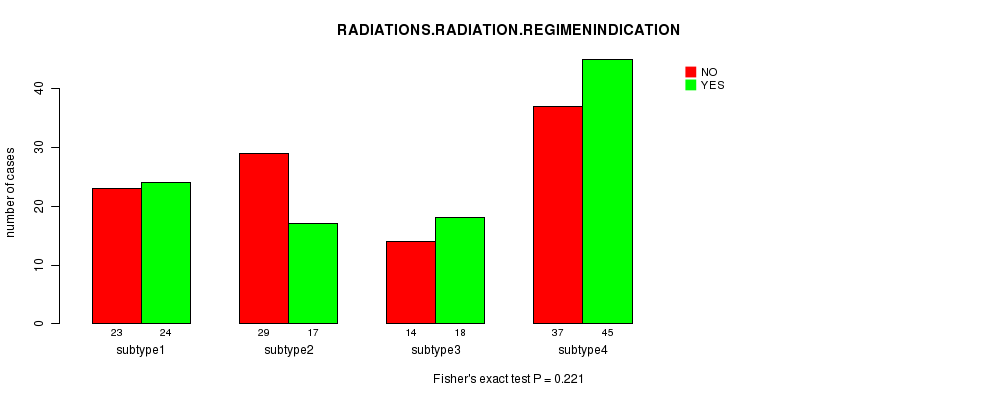
Table S57. Get Full Table Description of clustering approach #8: 'MIRSEQ CHIERARCHICAL'
| Cluster Labels | 1 | 2 | 3 |
|---|---|---|---|
| Number of samples | 83 | 12 | 112 |
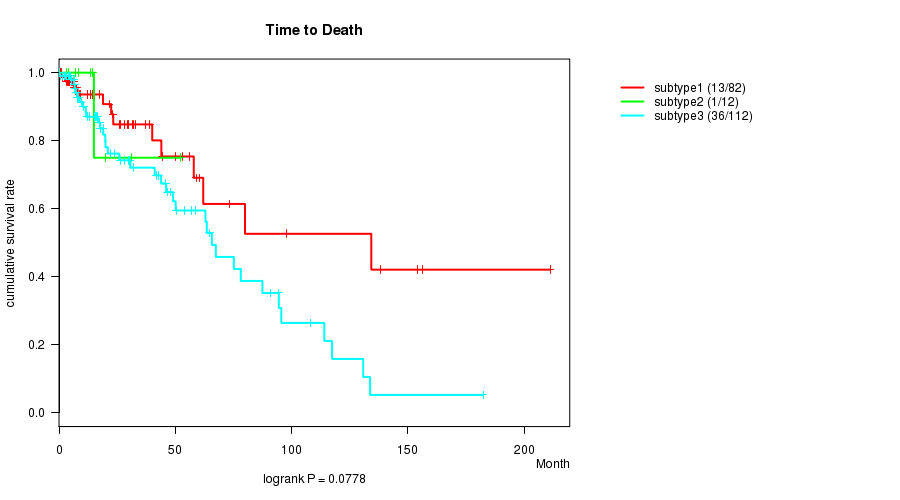
P value = 0.0778 (logrank test), Q value = 1
Table S58. Clustering Approach #8: 'MIRSEQ CHIERARCHICAL' versus Clinical Feature #1: 'Time to Death'
| nPatients | nDeath | Duration Range (Median), Month | |
|---|---|---|---|
| ALL | 206 | 50 | 0.0 - 211.2 (13.4) |
| subtype1 | 82 | 13 | 0.1 - 211.2 (12.9) |
| subtype2 | 12 | 1 | 0.2 - 52.4 (10.9) |
| subtype3 | 112 | 36 | 0.0 - 182.3 (15.6) |
Figure S50. Get High-res Image Clustering Approach #8: 'MIRSEQ CHIERARCHICAL' versus Clinical Feature #1: 'Time to Death'
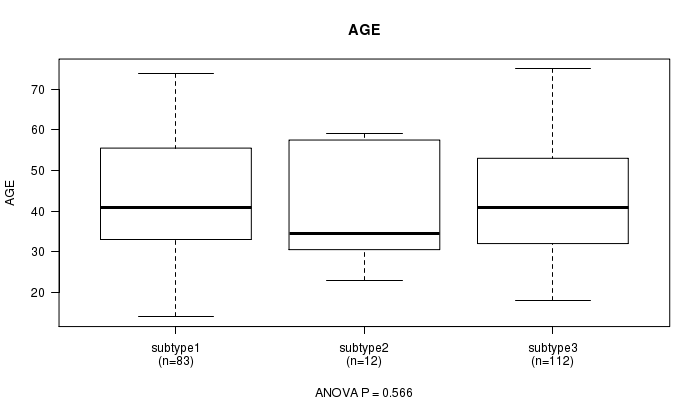
P value = 0.566 (ANOVA), Q value = 1
Table S59. Clustering Approach #8: 'MIRSEQ CHIERARCHICAL' versus Clinical Feature #2: 'AGE'
| nPatients | Mean (Std.Dev) | |
|---|---|---|
| ALL | 207 | 43.2 (13.4) |
| subtype1 | 83 | 44.3 (14.1) |
| subtype2 | 12 | 40.6 (13.5) |
| subtype3 | 112 | 42.7 (12.9) |
Figure S51. Get High-res Image Clustering Approach #8: 'MIRSEQ CHIERARCHICAL' versus Clinical Feature #2: 'AGE'
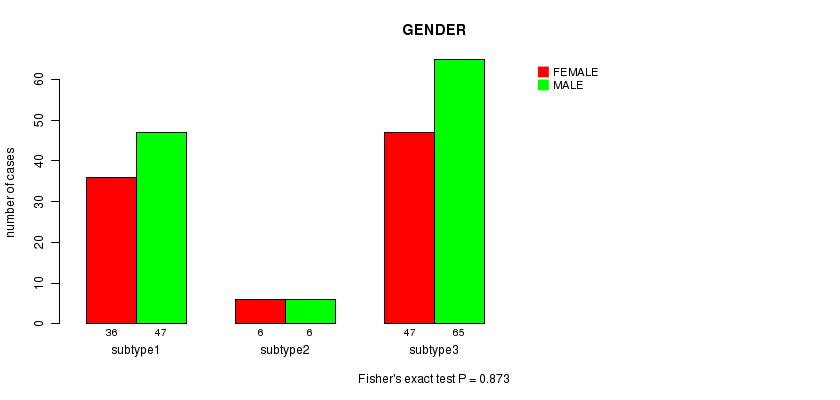
P value = 0.873 (Fisher's exact test), Q value = 1
Table S60. Clustering Approach #8: 'MIRSEQ CHIERARCHICAL' versus Clinical Feature #3: 'GENDER'
| nPatients | FEMALE | MALE |
|---|---|---|
| ALL | 89 | 118 |
| subtype1 | 36 | 47 |
| subtype2 | 6 | 6 |
| subtype3 | 47 | 65 |
Figure S52. Get High-res Image Clustering Approach #8: 'MIRSEQ CHIERARCHICAL' versus Clinical Feature #3: 'GENDER'
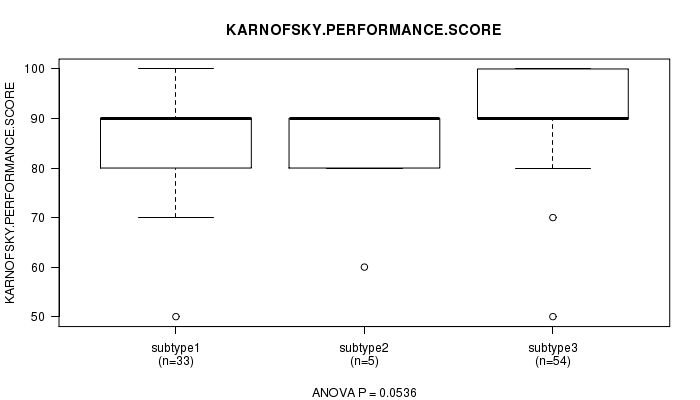
P value = 0.0536 (ANOVA), Q value = 1
Table S61. Clustering Approach #8: 'MIRSEQ CHIERARCHICAL' versus Clinical Feature #4: 'KARNOFSKY.PERFORMANCE.SCORE'
| nPatients | Mean (Std.Dev) | |
|---|---|---|
| ALL | 92 | 88.5 (10.5) |
| subtype1 | 33 | 86.1 (12.0) |
| subtype2 | 5 | 82.0 (13.0) |
| subtype3 | 54 | 90.6 (8.8) |
Figure S53. Get High-res Image Clustering Approach #8: 'MIRSEQ CHIERARCHICAL' versus Clinical Feature #4: 'KARNOFSKY.PERFORMANCE.SCORE'
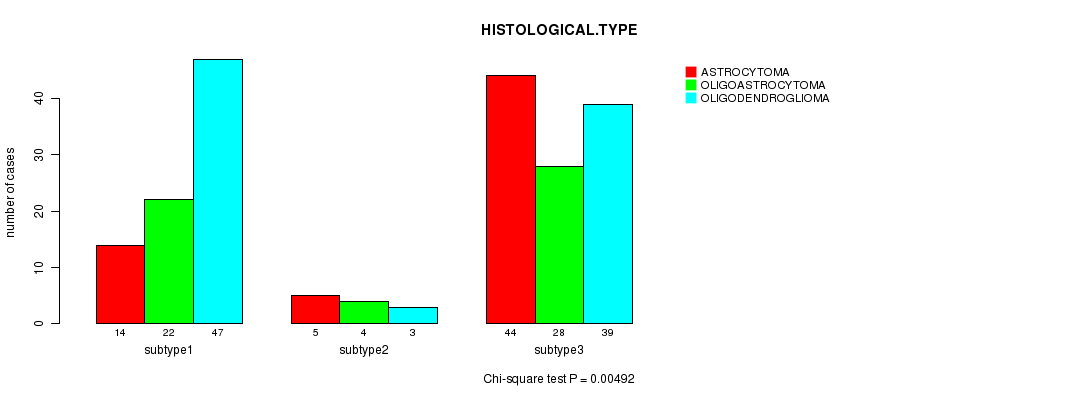
P value = 0.00492 (Chi-square test), Q value = 0.2
Table S62. Clustering Approach #8: 'MIRSEQ CHIERARCHICAL' versus Clinical Feature #5: 'HISTOLOGICAL.TYPE'
| nPatients | ASTROCYTOMA | OLIGOASTROCYTOMA | OLIGODENDROGLIOMA |
|---|---|---|---|
| ALL | 63 | 54 | 89 |
| subtype1 | 14 | 22 | 47 |
| subtype2 | 5 | 4 | 3 |
| subtype3 | 44 | 28 | 39 |
Figure S54. Get High-res Image Clustering Approach #8: 'MIRSEQ CHIERARCHICAL' versus Clinical Feature #5: 'HISTOLOGICAL.TYPE'
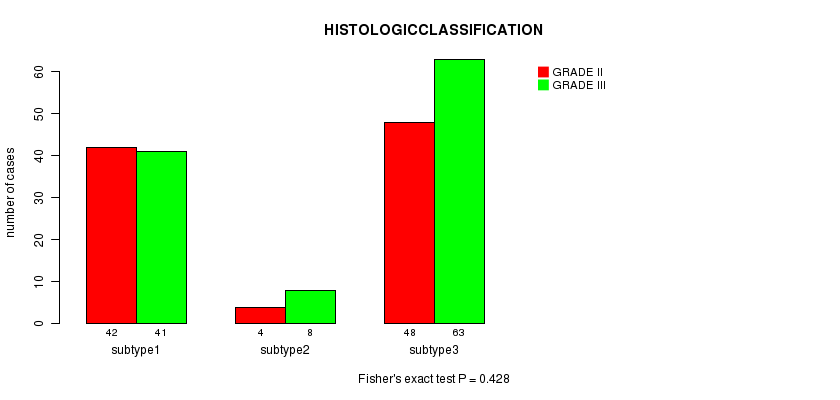
P value = 0.428 (Fisher's exact test), Q value = 1
Table S63. Clustering Approach #8: 'MIRSEQ CHIERARCHICAL' versus Clinical Feature #6: 'HISTOLOGICCLASSIFICATION'
| nPatients | GRADE II | GRADE III |
|---|---|---|
| ALL | 94 | 112 |
| subtype1 | 42 | 41 |
| subtype2 | 4 | 8 |
| subtype3 | 48 | 63 |
Figure S55. Get High-res Image Clustering Approach #8: 'MIRSEQ CHIERARCHICAL' versus Clinical Feature #6: 'HISTOLOGICCLASSIFICATION'
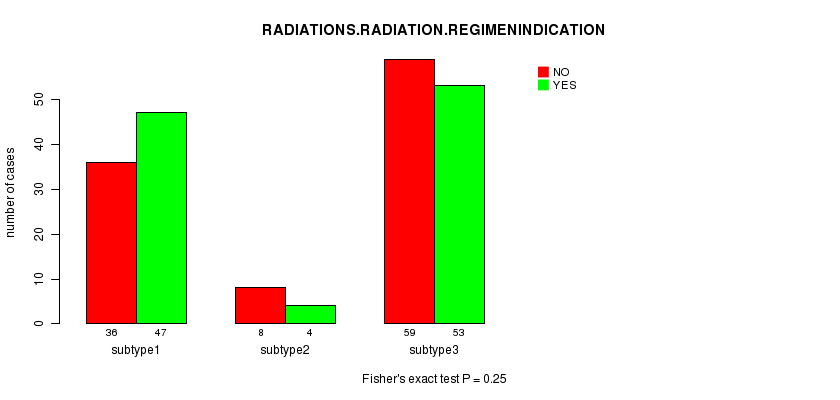
P value = 0.25 (Fisher's exact test), Q value = 1
Table S64. Clustering Approach #8: 'MIRSEQ CHIERARCHICAL' versus Clinical Feature #7: 'RADIATIONS.RADIATION.REGIMENINDICATION'
| nPatients | NO | YES |
|---|---|---|
| ALL | 103 | 104 |
| subtype1 | 36 | 47 |
| subtype2 | 8 | 4 |
| subtype3 | 59 | 53 |
Figure S56. Get High-res Image Clustering Approach #8: 'MIRSEQ CHIERARCHICAL' versus Clinical Feature #7: 'RADIATIONS.RADIATION.REGIMENINDICATION'
-
Cluster data file = LGG-TP.mergedcluster.txt
-
Clinical data file = LGG-TP.clin.merged.picked.txt
-
Number of patients = 208
-
Number of clustering approaches = 8
-
Number of selected clinical features = 7
-
Exclude small clusters that include fewer than K patients, K = 3
consensus non-negative matrix factorization clustering approach (Brunet et al. 2004)
Resampling-based clustering method (Monti et al. 2003)
For survival clinical features, the Kaplan-Meier survival curves of tumors with and without gene mutations were plotted and the statistical significance P values were estimated by logrank test (Bland and Altman 2004) using the 'survdiff' function in R
For continuous numerical clinical features, one-way analysis of variance (Howell 2002) was applied to compare the clinical values between tumor subtypes using 'anova' function in R
For binary clinical features, two-tailed Fisher's exact tests (Fisher 1922) were used to estimate the P values using the 'fisher.test' function in R
For multi-class clinical features (nominal or ordinal), Chi-square tests (Greenwood and Nikulin 1996) were used to estimate the P values using the 'chisq.test' function in R
For multiple hypothesis correction, Q value is the False Discovery Rate (FDR) analogue of the P value (Benjamini and Hochberg 1995), defined as the minimum FDR at which the test may be called significant. We used the 'Benjamini and Hochberg' method of 'p.adjust' function in R to convert P values into Q values.
This is an experimental feature. The full results of the analysis summarized in this report can be downloaded from the TCGA Data Coordination Center.