(primary solid tumor cohort)
This pipeline uses various statistical tests to identify genes whose promoter methylation levels correlated to selected clinical features.
Testing the association between 16900 genes and 7 clinical features across 54 samples, statistically thresholded by Q value < 0.05, 6 clinical features related to at least one genes.
-
3 genes correlated to 'AGE'.
-
HSD17B6 , HGF , PPTC7
-
1 gene correlated to 'GENDER'.
-
UTP14C
-
10 genes correlated to 'DISTANT.METASTASIS'.
-
SEPSECS , C5ORF42 , KDELC1 , GOLGA7 , SEPT2 , ...
-
45 genes correlated to 'LYMPH.NODE.METASTASIS'.
-
LDHAL6B , MORC1 , RAB20 , HECA , RFX2 , ...
-
9 genes correlated to 'COMPLETENESS.OF.RESECTION'.
-
SEPSECS , C5ORF42 , KDELC1 , GOLGA7 , BIK , ...
-
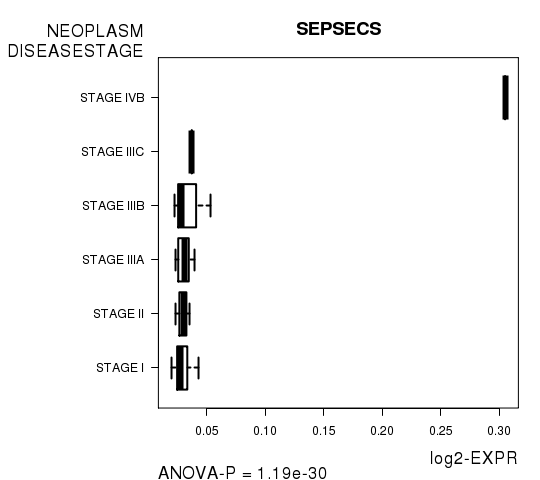
38 genes correlated to 'NEOPLASM.DISEASESTAGE'.
-
SEPSECS , MORC1 , LDHAL6B , RAB20 , HECA , ...
-
No genes correlated to 'Time to Death'
Complete statistical result table is provided in Supplement Table 1
Table 1. Get Full Table This table shows the clinical features, statistical methods used, and the number of genes that are significantly associated with each clinical feature at Q value < 0.05.
| Clinical feature | Statistical test | Significant genes | Associated with | Associated with | ||
|---|---|---|---|---|---|---|
| Time to Death | Cox regression test | N=0 | ||||
| AGE | Spearman correlation test | N=3 | older | N=0 | younger | N=3 |
| GENDER | t test | N=1 | male | N=1 | female | N=0 |
| DISTANT METASTASIS | ANOVA test | N=10 | ||||
| LYMPH NODE METASTASIS | ANOVA test | N=45 | ||||
| COMPLETENESS OF RESECTION | ANOVA test | N=9 | ||||
| NEOPLASM DISEASESTAGE | ANOVA test | N=38 |
Table S1. Basic characteristics of clinical feature: 'Time to Death'
| Time to Death | Duration (Months) | 0.1-83.6 (median=14.3) |
| censored | N = 29 | |
| death | N = 20 | |
| Significant markers | N = 0 |
Table S2. Basic characteristics of clinical feature: 'AGE'
| AGE | Mean (SD) | 59.38 (14) |
| Significant markers | N = 3 | |
| pos. correlated | 0 | |
| neg. correlated | 3 |
Table S3. Get Full Table List of 3 genes significantly correlated to 'AGE' by Spearman correlation test
| SpearmanCorr | corrP | Q | |
|---|---|---|---|
| HSD17B6 | -0.614 | 1.009e-06 | 0.0171 |
| HGF | -0.6121 | 1.117e-06 | 0.0189 |
| PPTC7 | -0.6 | 2.047e-06 | 0.0346 |
Figure S1. Get High-res Image As an example, this figure shows the association of HSD17B6 to 'AGE'. P value = 1.01e-06 with Spearman correlation analysis. The straight line presents the best linear regression.
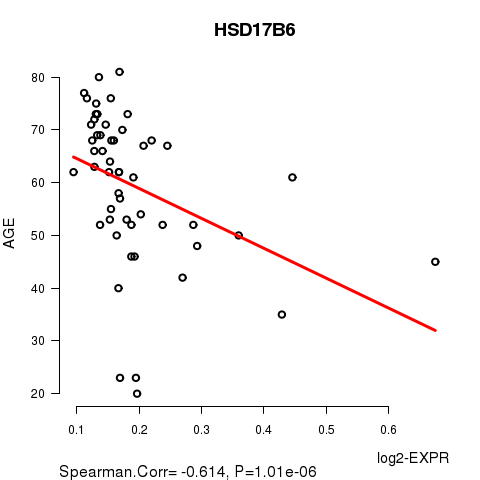
Table S4. Basic characteristics of clinical feature: 'GENDER'
| GENDER | Labels | N |
| FEMALE | 20 | |
| MALE | 34 | |
| Significant markers | N = 1 | |
| Higher in MALE | 1 | |
| Higher in FEMALE | 0 |
Table S5. Get Full Table List of one gene differentially expressed by 'GENDER'
| T(pos if higher in 'MALE') | ttestP | Q | AUC | |
|---|---|---|---|---|
| UTP14C | 7.81 | 7.07e-08 | 0.00119 | 0.9441 |
Figure S2. Get High-res Image As an example, this figure shows the association of UTP14C to 'GENDER'. P value = 7.07e-08 with T-test analysis.

Table S6. Basic characteristics of clinical feature: 'DISTANT.METASTASIS'
| DISTANT.METASTASIS | Labels | N |
| M0 | 37 | |
| M1 | 1 | |
| MX | 16 | |
| Significant markers | N = 10 |
Table S7. Get Full Table List of 10 genes differentially expressed by 'DISTANT.METASTASIS'
| ANOVA_P | Q | |
|---|---|---|
| SEPSECS | 4.423e-39 | 7.47e-35 |
| C5ORF42 | 6.831e-13 | 1.15e-08 |
| KDELC1 | 6.794e-11 | 1.15e-06 |
| GOLGA7 | 2.405e-10 | 4.06e-06 |
| SEPT2 | 9.037e-08 | 0.00153 |
| C4ORF12 | 1.042e-07 | 0.00176 |
| MGMT | 2.375e-07 | 0.00401 |
| FBXL22 | 1.246e-06 | 0.021 |
| FOLH1 | 1.944e-06 | 0.0328 |
| VPS37B | 2.569e-06 | 0.0434 |
Figure S3. Get High-res Image As an example, this figure shows the association of SEPSECS to 'DISTANT.METASTASIS'. P value = 4.42e-39 with ANOVA analysis.

Table S8. Basic characteristics of clinical feature: 'LYMPH.NODE.METASTASIS'
| LYMPH.NODE.METASTASIS | Labels | N |
| N0 | 37 | |
| N1 | 1 | |
| NX | 15 | |
| Significant markers | N = 45 |
Table S9. Get Full Table List of top 10 genes differentially expressed by 'LYMPH.NODE.METASTASIS'
| ANOVA_P | Q | |
|---|---|---|
| LDHAL6B | 7.946e-31 | 1.34e-26 |
| MORC1 | 1.776e-30 | 3e-26 |
| RAB20 | 2.368e-26 | 4e-22 |
| HECA | 5.923e-25 | 1e-20 |
| RFX2 | 9.803e-24 | 1.66e-19 |
| SYTL3 | 6.206e-23 | 1.05e-18 |
| MOBKL1A | 1.186e-20 | 2e-16 |
| FGF22 | 1.352e-19 | 2.28e-15 |
| MAEL | 4.573e-18 | 7.72e-14 |
| ASB14 | 2.287e-14 | 3.86e-10 |
Figure S4. Get High-res Image As an example, this figure shows the association of LDHAL6B to 'LYMPH.NODE.METASTASIS'. P value = 7.95e-31 with ANOVA analysis.

Table S10. Basic characteristics of clinical feature: 'COMPLETENESS.OF.RESECTION'
| COMPLETENESS.OF.RESECTION | Labels | N |
| R0 | 40 | |
| R1 | 4 | |
| R2 | 1 | |
| RX | 6 | |
| Significant markers | N = 9 |
Table S11. Get Full Table List of 9 genes differentially expressed by 'COMPLETENESS.OF.RESECTION'
| ANOVA_P | Q | |
|---|---|---|
| SEPSECS | 7.139e-36 | 1.21e-31 |
| C5ORF42 | 1.186e-12 | 2e-08 |
| KDELC1 | 1.33e-09 | 2.25e-05 |
| GOLGA7 | 5.505e-09 | 9.3e-05 |
| BIK | 9.031e-09 | 0.000153 |
| IREB2 | 9.32e-08 | 0.00157 |
| C4ORF12 | 2.445e-07 | 0.00413 |
| MGMT | 5.602e-07 | 0.00946 |
| SEPT2 | 2.129e-06 | 0.036 |
Figure S5. Get High-res Image As an example, this figure shows the association of SEPSECS to 'COMPLETENESS.OF.RESECTION'. P value = 7.14e-36 with ANOVA analysis.

Table S12. Basic characteristics of clinical feature: 'NEOPLASM.DISEASESTAGE'
| NEOPLASM.DISEASESTAGE | Labels | N |
| STAGE I | 21 | |
| STAGE II | 11 | |
| STAGE IIIA | 10 | |
| STAGE IIIB | 3 | |
| STAGE IIIC | 1 | |
| STAGE IVB | 1 | |
| Significant markers | N = 38 |
Table S13. Get Full Table List of top 10 genes differentially expressed by 'NEOPLASM.DISEASESTAGE'
| ANOVA_P | Q | |
|---|---|---|
| SEPSECS | 1.192e-30 | 2.02e-26 |
| MORC1 | 9.705e-25 | 1.64e-20 |
| LDHAL6B | 1.165e-23 | 1.97e-19 |
| RAB20 | 2.02e-20 | 3.41e-16 |
| HECA | 8.82e-20 | 1.49e-15 |
| SYTL3 | 2.567e-18 | 4.34e-14 |
| RFX2 | 2.83e-18 | 4.78e-14 |
| MAEL | 8.132e-17 | 1.37e-12 |
| MOBKL1A | 2.685e-16 | 4.54e-12 |
| DHX58 | 6.418e-15 | 1.08e-10 |
Figure S6. Get High-res Image As an example, this figure shows the association of SEPSECS to 'NEOPLASM.DISEASESTAGE'. P value = 1.19e-30 with ANOVA analysis.
-
Expresson data file = LIHC-TP.meth.for_correlation.filtered_data.txt
-
Clinical data file = LIHC-TP.clin.merged.picked.txt
-
Number of patients = 54
-
Number of genes = 16900
-
Number of clinical features = 7
For survival clinical features, Wald's test in univariate Cox regression analysis with proportional hazards model (Andersen and Gill 1982) was used to estimate the P values using the 'coxph' function in R. Kaplan-Meier survival curves were plot using the four quartile subgroups of patients based on expression levels
For continuous numerical clinical features, Spearman's rank correlation coefficients (Spearman 1904) and two-tailed P values were estimated using 'cor.test' function in R
For two-class clinical features, two-tailed Student's t test with unequal variance (Lehmann and Romano 2005) was applied to compare the log2-expression levels between the two clinical classes using 't.test' function in R
For multi-class clinical features (ordinal or nominal), one-way analysis of variance (Howell 2002) was applied to compare the log2-expression levels between different clinical classes using 'anova' function in R
For multiple hypothesis correction, Q value is the False Discovery Rate (FDR) analogue of the P value (Benjamini and Hochberg 1995), defined as the minimum FDR at which the test may be called significant. We used the 'Benjamini and Hochberg' method of 'p.adjust' function in R to convert P values into Q values.
This is an experimental feature. The full results of the analysis summarized in this report can be downloaded from the TCGA Data Coordination Center.