(primary solid tumor cohort)
This pipeline computes the correlation between cancer subtypes identified by different molecular patterns and selected clinical features.
Testing the association between subtypes identified by 6 different clustering approaches and 8 clinical features across 69 patients, one significant finding detected with P value < 0.05 and Q value < 0.25.
-
3 subtypes identified in current cancer cohort by 'Copy Number Ratio CNMF subtypes'. These subtypes do not correlate to any clinical features.
-
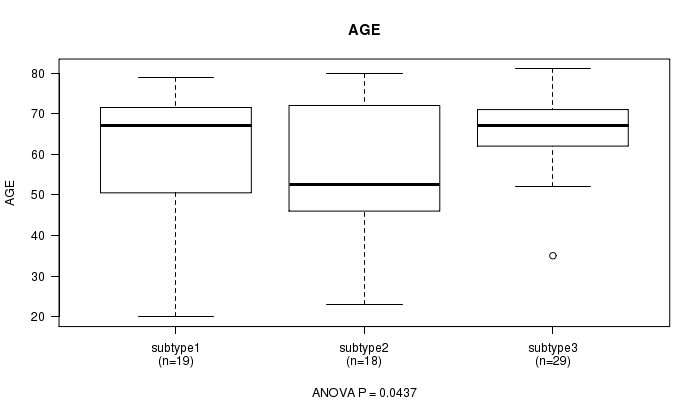
3 subtypes identified in current cancer cohort by 'METHLYATION CNMF'. These subtypes do not correlate to any clinical features.
-
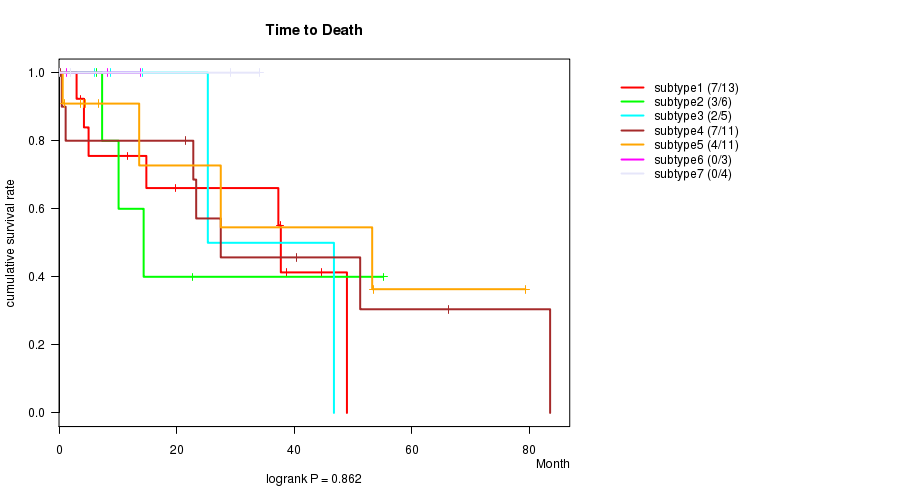
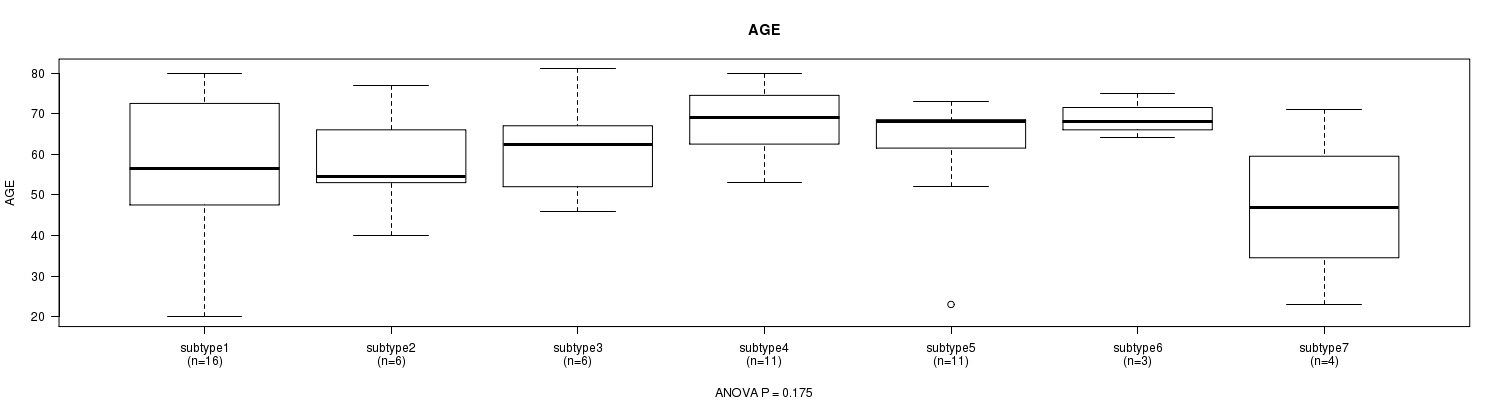
CNMF clustering analysis on sequencing-based mRNA expression data identified 7 subtypes that do not correlate to any clinical features.
-
Consensus hierarchical clustering analysis on sequencing-based mRNA expression data identified 2 subtypes that do not correlate to any clinical features.
-
3 subtypes identified in current cancer cohort by 'MIRSEQ CNMF'. These subtypes do not correlate to any clinical features.
-
4 subtypes identified in current cancer cohort by 'MIRSEQ CHIERARCHICAL'. These subtypes correlate to 'AGE'.
Table 1. Get Full Table Overview of the association between subtypes identified by 6 different clustering approaches and 8 clinical features. Shown in the table are P values (Q values). Thresholded by P value < 0.05 and Q value < 0.25, one significant finding detected.
|
Clinical Features |
Statistical Tests |
Copy Number Ratio CNMF subtypes |
METHLYATION CNMF |
RNAseq CNMF subtypes |
RNAseq cHierClus subtypes |
MIRSEQ CNMF |
MIRSEQ CHIERARCHICAL |
| Time to Death | logrank test |
0.434 (1.00) |
0.729 (1.00) |
0.862 (1.00) |
0.838 (1.00) |
0.676 (1.00) |
0.74 (1.00) |
| AGE | ANOVA |
0.896 (1.00) |
0.0437 (1.00) |
0.175 (1.00) |
0.058 (1.00) |
0.0671 (1.00) |
0.00482 (0.202) |
| GENDER | Fisher's exact test |
0.404 (1.00) |
0.502 (1.00) |
0.0916 (1.00) |
0.0536 (1.00) |
0.3 (1.00) |
0.141 (1.00) |
| DISTANT METASTASIS | Chi-square test |
0.516 (1.00) |
0.483 (1.00) |
0.572 (1.00) |
0.593 (1.00) |
0.781 (1.00) |
0.879 (1.00) |
| LYMPH NODE METASTASIS | Chi-square test |
0.444 (1.00) |
0.5 (1.00) |
0.293 (1.00) |
0.463 (1.00) |
0.259 (1.00) |
0.671 (1.00) |
| COMPLETENESS OF RESECTION | Chi-square test |
0.49 (1.00) |
0.499 (1.00) |
0.335 (1.00) |
0.337 (1.00) |
0.418 (1.00) |
0.132 (1.00) |
| TUMOR STAGECODE | ANOVA | ||||||
| NEOPLASM DISEASESTAGE | Chi-square test |
0.464 (1.00) |
0.362 (1.00) |
0.0279 (1.00) |
0.179 (1.00) |
0.412 (1.00) |
0.865 (1.00) |
Table S1. Get Full Table Description of clustering approach #1: 'Copy Number Ratio CNMF subtypes'
| Cluster Labels | 1 | 2 | 3 |
|---|---|---|---|
| Number of samples | 17 | 25 | 26 |
P value = 0.434 (logrank test), Q value = 1
Table S2. Clustering Approach #1: 'Copy Number Ratio CNMF subtypes' versus Clinical Feature #1: 'Time to Death'
| nPatients | nDeath | Duration Range (Median), Month | |
|---|---|---|---|
| ALL | 62 | 26 | 0.1 - 90.7 (14.0) |
| subtype1 | 16 | 7 | 0.1 - 90.7 (7.8) |
| subtype2 | 22 | 8 | 0.4 - 79.4 (22.5) |
| subtype3 | 24 | 11 | 0.3 - 83.6 (14.3) |
Figure S1. Get High-res Image Clustering Approach #1: 'Copy Number Ratio CNMF subtypes' versus Clinical Feature #1: 'Time to Death'

P value = 0.896 (ANOVA), Q value = 1
Table S3. Clustering Approach #1: 'Copy Number Ratio CNMF subtypes' versus Clinical Feature #2: 'AGE'
| nPatients | Mean (Std.Dev) | |
|---|---|---|
| ALL | 66 | 61.5 (14.2) |
| subtype1 | 16 | 60.1 (15.8) |
| subtype2 | 25 | 62.2 (13.6) |
| subtype3 | 25 | 61.6 (14.3) |
Figure S2. Get High-res Image Clustering Approach #1: 'Copy Number Ratio CNMF subtypes' versus Clinical Feature #2: 'AGE'

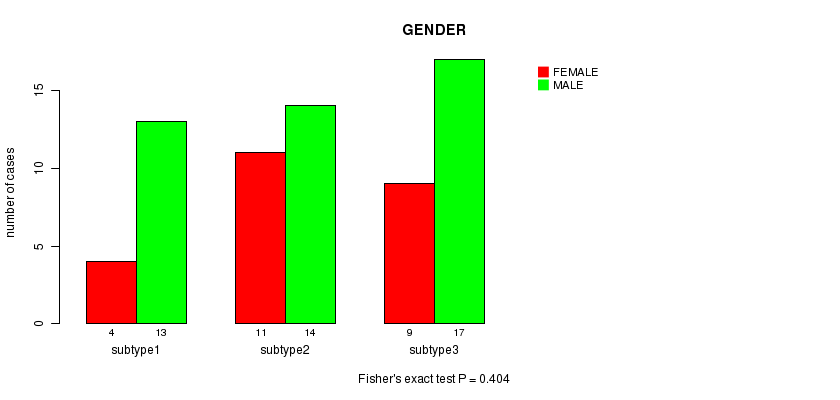
P value = 0.404 (Fisher's exact test), Q value = 1
Table S4. Clustering Approach #1: 'Copy Number Ratio CNMF subtypes' versus Clinical Feature #3: 'GENDER'
| nPatients | FEMALE | MALE |
|---|---|---|
| ALL | 24 | 44 |
| subtype1 | 4 | 13 |
| subtype2 | 11 | 14 |
| subtype3 | 9 | 17 |
Figure S3. Get High-res Image Clustering Approach #1: 'Copy Number Ratio CNMF subtypes' versus Clinical Feature #3: 'GENDER'
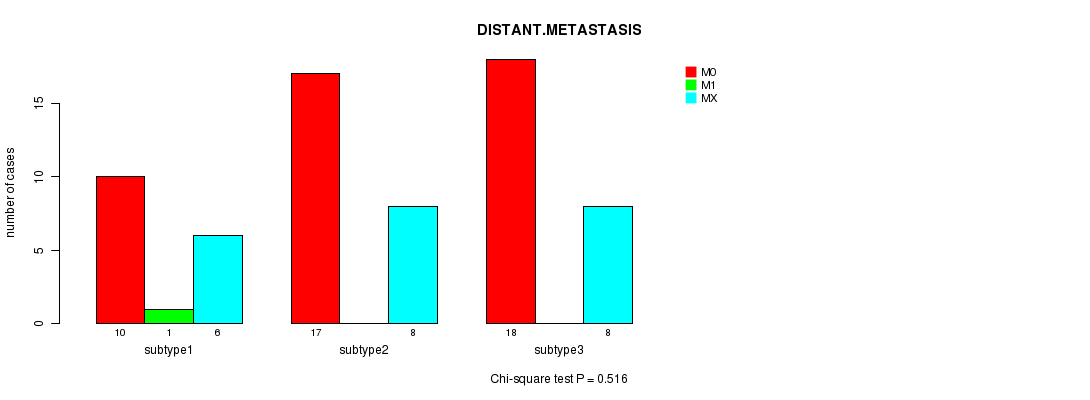
P value = 0.516 (Chi-square test), Q value = 1
Table S5. Clustering Approach #1: 'Copy Number Ratio CNMF subtypes' versus Clinical Feature #4: 'DISTANT.METASTASIS'
| nPatients | M0 | M1 | MX |
|---|---|---|---|
| ALL | 45 | 1 | 22 |
| subtype1 | 10 | 1 | 6 |
| subtype2 | 17 | 0 | 8 |
| subtype3 | 18 | 0 | 8 |
Figure S4. Get High-res Image Clustering Approach #1: 'Copy Number Ratio CNMF subtypes' versus Clinical Feature #4: 'DISTANT.METASTASIS'
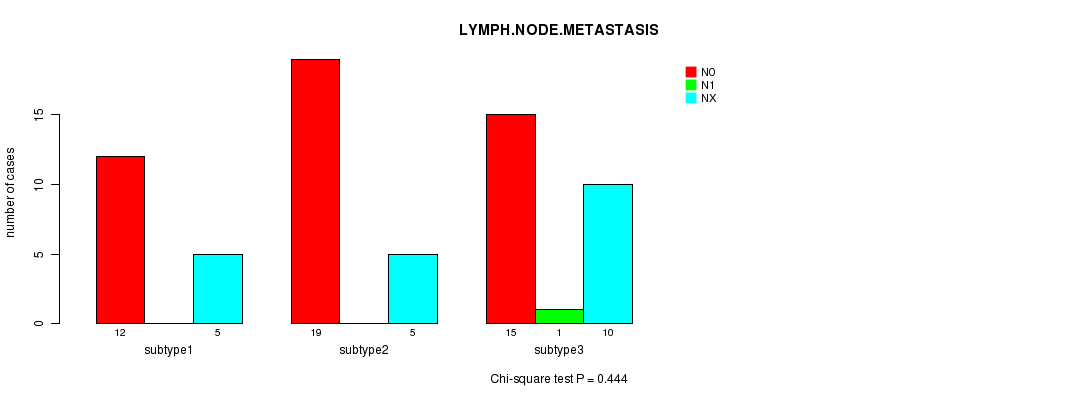
P value = 0.444 (Chi-square test), Q value = 1
Table S6. Clustering Approach #1: 'Copy Number Ratio CNMF subtypes' versus Clinical Feature #5: 'LYMPH.NODE.METASTASIS'
| nPatients | N0 | N1 | NX |
|---|---|---|---|
| ALL | 46 | 1 | 20 |
| subtype1 | 12 | 0 | 5 |
| subtype2 | 19 | 0 | 5 |
| subtype3 | 15 | 1 | 10 |
Figure S5. Get High-res Image Clustering Approach #1: 'Copy Number Ratio CNMF subtypes' versus Clinical Feature #5: 'LYMPH.NODE.METASTASIS'
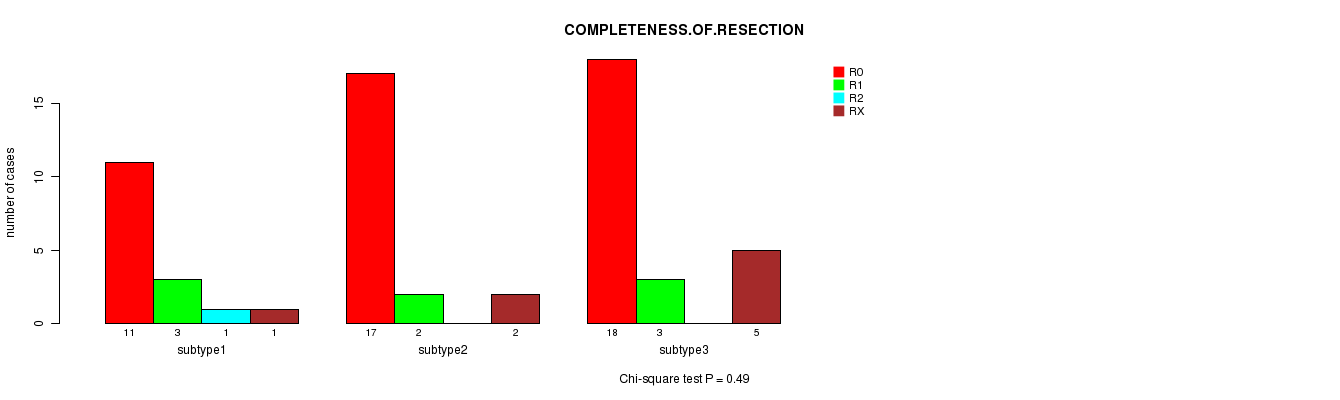
P value = 0.49 (Chi-square test), Q value = 1
Table S7. Clustering Approach #1: 'Copy Number Ratio CNMF subtypes' versus Clinical Feature #6: 'COMPLETENESS.OF.RESECTION'
| nPatients | R0 | R1 | R2 | RX |
|---|---|---|---|---|
| ALL | 46 | 8 | 1 | 8 |
| subtype1 | 11 | 3 | 1 | 1 |
| subtype2 | 17 | 2 | 0 | 2 |
| subtype3 | 18 | 3 | 0 | 5 |
Figure S6. Get High-res Image Clustering Approach #1: 'Copy Number Ratio CNMF subtypes' versus Clinical Feature #6: 'COMPLETENESS.OF.RESECTION'
P value = 0.464 (Chi-square test), Q value = 1
Table S8. Clustering Approach #1: 'Copy Number Ratio CNMF subtypes' versus Clinical Feature #8: 'NEOPLASM.DISEASESTAGE'
| nPatients | STAGE I | STAGE II | STAGE IIIA | STAGE IIIB | STAGE IIIC | STAGE IVB |
|---|---|---|---|---|---|---|
| ALL | 28 | 12 | 13 | 4 | 1 | 1 |
| subtype1 | 8 | 5 | 2 | 0 | 0 | 1 |
| subtype2 | 10 | 3 | 5 | 3 | 0 | 0 |
| subtype3 | 10 | 4 | 6 | 1 | 1 | 0 |
Figure S7. Get High-res Image Clustering Approach #1: 'Copy Number Ratio CNMF subtypes' versus Clinical Feature #8: 'NEOPLASM.DISEASESTAGE'

Table S9. Get Full Table Description of clustering approach #2: 'METHLYATION CNMF'
| Cluster Labels | 1 | 2 | 3 |
|---|---|---|---|
| Number of samples | 20 | 18 | 30 |
P value = 0.729 (logrank test), Q value = 1
Table S10. Clustering Approach #2: 'METHLYATION CNMF' versus Clinical Feature #1: 'Time to Death'
| nPatients | nDeath | Duration Range (Median), Month | |
|---|---|---|---|
| ALL | 61 | 25 | 0.1 - 90.7 (13.8) |
| subtype1 | 16 | 8 | 0.4 - 90.7 (22.5) |
| subtype2 | 16 | 7 | 0.1 - 66.3 (8.7) |
| subtype3 | 29 | 10 | 0.3 - 83.6 (8.3) |
Figure S8. Get High-res Image Clustering Approach #2: 'METHLYATION CNMF' versus Clinical Feature #1: 'Time to Death'

P value = 0.0437 (ANOVA), Q value = 1
Table S11. Clustering Approach #2: 'METHLYATION CNMF' versus Clinical Feature #2: 'AGE'
| nPatients | Mean (Std.Dev) | |
|---|---|---|
| ALL | 66 | 60.6 (14.7) |
| subtype1 | 19 | 58.5 (17.0) |
| subtype2 | 18 | 55.0 (17.0) |
| subtype3 | 29 | 65.5 (9.8) |
Figure S9. Get High-res Image Clustering Approach #2: 'METHLYATION CNMF' versus Clinical Feature #2: 'AGE'
P value = 0.502 (Fisher's exact test), Q value = 1
Table S12. Clustering Approach #2: 'METHLYATION CNMF' versus Clinical Feature #3: 'GENDER'
| nPatients | FEMALE | MALE |
|---|---|---|
| ALL | 25 | 43 |
| subtype1 | 9 | 11 |
| subtype2 | 7 | 11 |
| subtype3 | 9 | 21 |
Figure S10. Get High-res Image Clustering Approach #2: 'METHLYATION CNMF' versus Clinical Feature #3: 'GENDER'

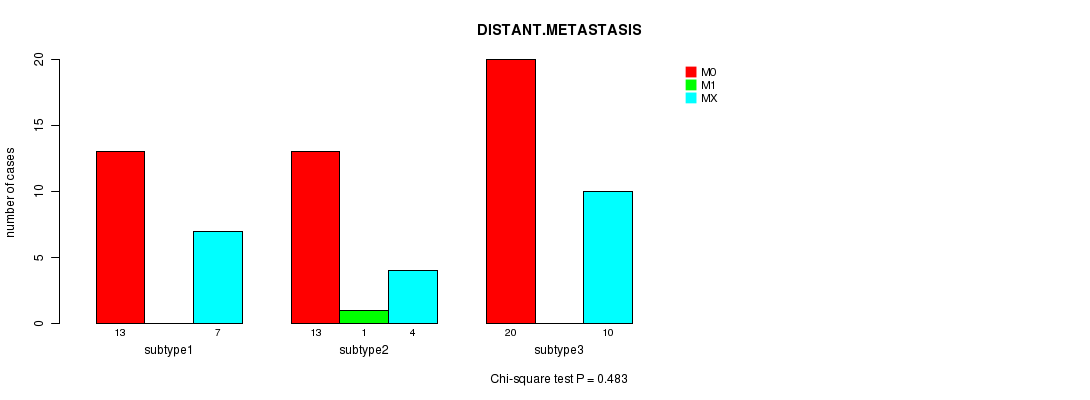
P value = 0.483 (Chi-square test), Q value = 1
Table S13. Clustering Approach #2: 'METHLYATION CNMF' versus Clinical Feature #4: 'DISTANT.METASTASIS'
| nPatients | M0 | M1 | MX |
|---|---|---|---|
| ALL | 46 | 1 | 21 |
| subtype1 | 13 | 0 | 7 |
| subtype2 | 13 | 1 | 4 |
| subtype3 | 20 | 0 | 10 |
Figure S11. Get High-res Image Clustering Approach #2: 'METHLYATION CNMF' versus Clinical Feature #4: 'DISTANT.METASTASIS'
P value = 0.5 (Chi-square test), Q value = 1
Table S14. Clustering Approach #2: 'METHLYATION CNMF' versus Clinical Feature #5: 'LYMPH.NODE.METASTASIS'
| nPatients | N0 | N1 | NX |
|---|---|---|---|
| ALL | 47 | 1 | 19 |
| subtype1 | 15 | 0 | 4 |
| subtype2 | 14 | 0 | 4 |
| subtype3 | 18 | 1 | 11 |
Figure S12. Get High-res Image Clustering Approach #2: 'METHLYATION CNMF' versus Clinical Feature #5: 'LYMPH.NODE.METASTASIS'

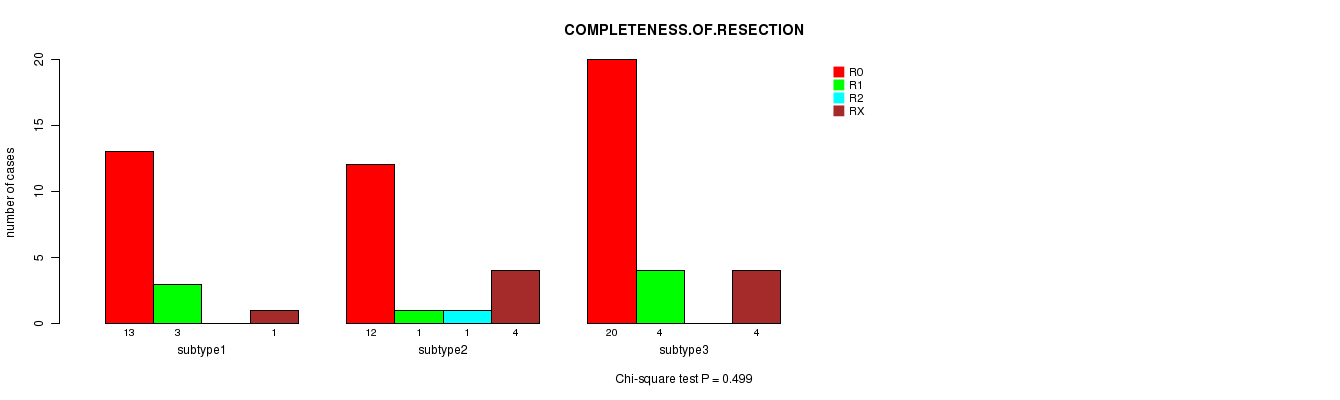
P value = 0.499 (Chi-square test), Q value = 1
Table S15. Clustering Approach #2: 'METHLYATION CNMF' versus Clinical Feature #6: 'COMPLETENESS.OF.RESECTION'
| nPatients | R0 | R1 | R2 | RX |
|---|---|---|---|---|
| ALL | 45 | 8 | 1 | 9 |
| subtype1 | 13 | 3 | 0 | 1 |
| subtype2 | 12 | 1 | 1 | 4 |
| subtype3 | 20 | 4 | 0 | 4 |
Figure S13. Get High-res Image Clustering Approach #2: 'METHLYATION CNMF' versus Clinical Feature #6: 'COMPLETENESS.OF.RESECTION'
P value = 0.362 (Chi-square test), Q value = 1
Table S16. Clustering Approach #2: 'METHLYATION CNMF' versus Clinical Feature #8: 'NEOPLASM.DISEASESTAGE'
| nPatients | STAGE I | STAGE II | STAGE IIIA | STAGE IIIB | STAGE IIIC | STAGE IVB |
|---|---|---|---|---|---|---|
| ALL | 27 | 12 | 14 | 4 | 1 | 1 |
| subtype1 | 6 | 4 | 5 | 3 | 0 | 0 |
| subtype2 | 6 | 4 | 3 | 1 | 0 | 1 |
| subtype3 | 15 | 4 | 6 | 0 | 1 | 0 |
Figure S14. Get High-res Image Clustering Approach #2: 'METHLYATION CNMF' versus Clinical Feature #8: 'NEOPLASM.DISEASESTAGE'

Table S17. Get Full Table Description of clustering approach #3: 'RNAseq CNMF subtypes'
| Cluster Labels | 1 | 2 | 3 | 4 | 5 | 6 | 7 | 9 |
|---|---|---|---|---|---|---|---|---|
| Number of samples | 16 | 6 | 6 | 11 | 11 | 3 | 4 | 1 |
P value = 0.862 (logrank test), Q value = 1
Table S18. Clustering Approach #3: 'RNAseq CNMF subtypes' versus Clinical Feature #1: 'Time to Death'
| nPatients | nDeath | Duration Range (Median), Month | |
|---|---|---|---|
| ALL | 53 | 23 | 0.1 - 83.6 (14.4) |
| subtype1 | 13 | 7 | 3.0 - 49.0 (19.8) |
| subtype2 | 6 | 3 | 6.3 - 55.2 (12.3) |
| subtype3 | 5 | 2 | 6.0 - 46.8 (14.3) |
| subtype4 | 11 | 7 | 0.3 - 83.6 (23.3) |
| subtype5 | 11 | 4 | 0.6 - 79.4 (6.7) |
| subtype6 | 3 | 0 | 1.2 - 13.8 (8.3) |
| subtype7 | 4 | 0 | 0.1 - 34.1 (15.6) |
Figure S15. Get High-res Image Clustering Approach #3: 'RNAseq CNMF subtypes' versus Clinical Feature #1: 'Time to Death'
P value = 0.175 (ANOVA), Q value = 1
Table S19. Clustering Approach #3: 'RNAseq CNMF subtypes' versus Clinical Feature #2: 'AGE'
| nPatients | Mean (Std.Dev) | |
|---|---|---|
| ALL | 57 | 60.5 (14.3) |
| subtype1 | 16 | 57.0 (16.7) |
| subtype2 | 6 | 57.5 (12.6) |
| subtype3 | 6 | 61.8 (12.5) |
| subtype4 | 11 | 67.9 (8.5) |
| subtype5 | 11 | 61.5 (14.0) |
| subtype6 | 3 | 69.0 (5.6) |
| subtype7 | 4 | 47.0 (19.6) |
Figure S16. Get High-res Image Clustering Approach #3: 'RNAseq CNMF subtypes' versus Clinical Feature #2: 'AGE'
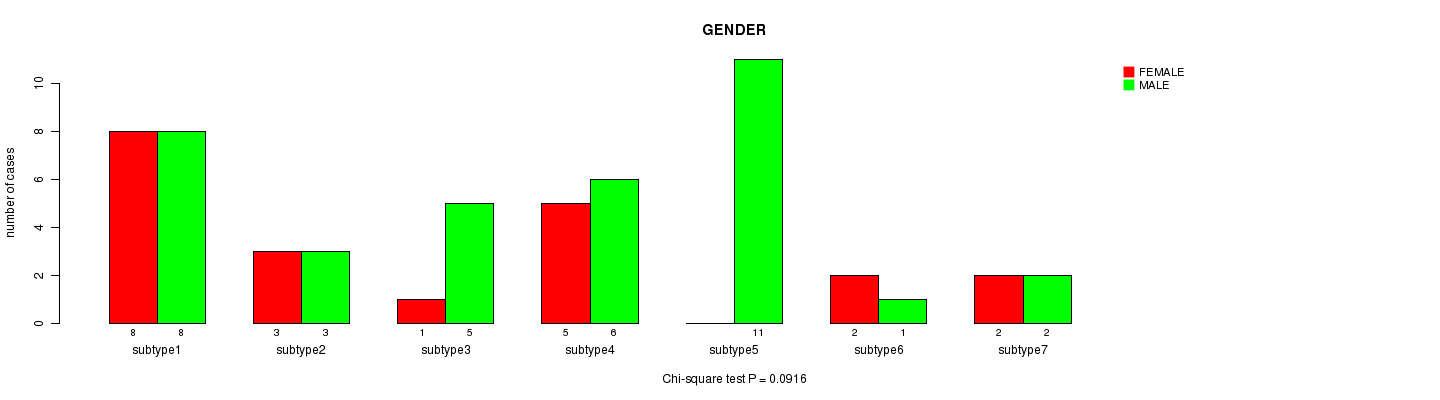
P value = 0.0916 (Chi-square test), Q value = 1
Table S20. Clustering Approach #3: 'RNAseq CNMF subtypes' versus Clinical Feature #3: 'GENDER'
| nPatients | FEMALE | MALE |
|---|---|---|
| ALL | 21 | 36 |
| subtype1 | 8 | 8 |
| subtype2 | 3 | 3 |
| subtype3 | 1 | 5 |
| subtype4 | 5 | 6 |
| subtype5 | 0 | 11 |
| subtype6 | 2 | 1 |
| subtype7 | 2 | 2 |
Figure S17. Get High-res Image Clustering Approach #3: 'RNAseq CNMF subtypes' versus Clinical Feature #3: 'GENDER'
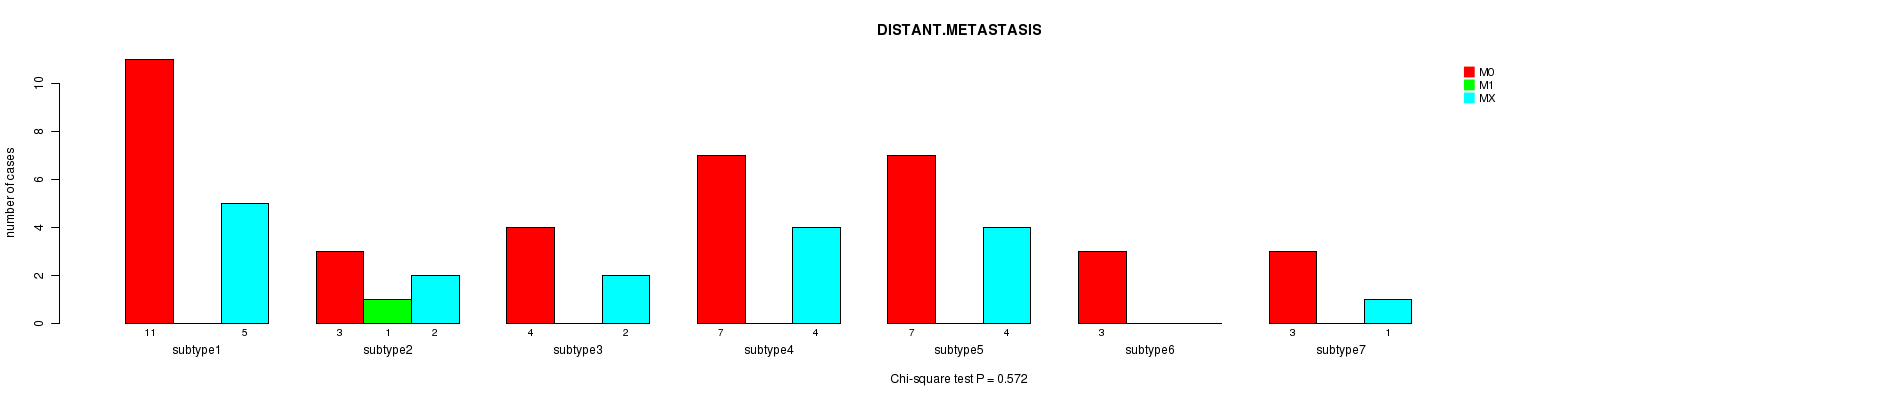
P value = 0.572 (Chi-square test), Q value = 1
Table S21. Clustering Approach #3: 'RNAseq CNMF subtypes' versus Clinical Feature #4: 'DISTANT.METASTASIS'
| nPatients | M0 | M1 | MX |
|---|---|---|---|
| ALL | 38 | 1 | 18 |
| subtype1 | 11 | 0 | 5 |
| subtype2 | 3 | 1 | 2 |
| subtype3 | 4 | 0 | 2 |
| subtype4 | 7 | 0 | 4 |
| subtype5 | 7 | 0 | 4 |
| subtype6 | 3 | 0 | 0 |
| subtype7 | 3 | 0 | 1 |
Figure S18. Get High-res Image Clustering Approach #3: 'RNAseq CNMF subtypes' versus Clinical Feature #4: 'DISTANT.METASTASIS'
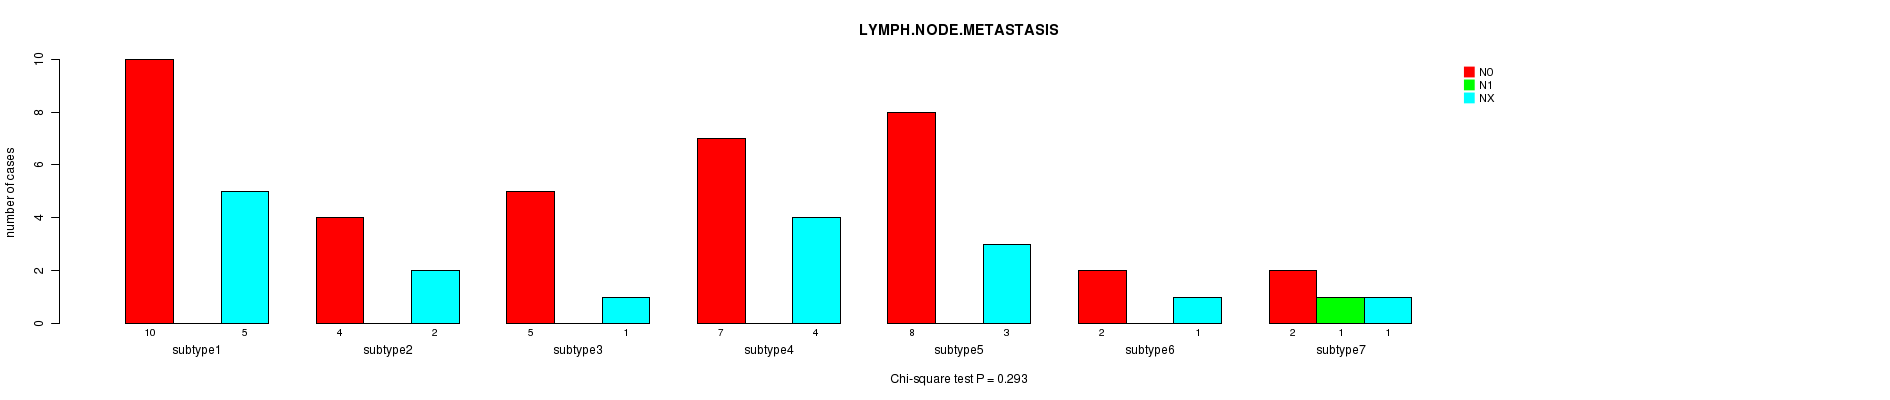
P value = 0.293 (Chi-square test), Q value = 1
Table S22. Clustering Approach #3: 'RNAseq CNMF subtypes' versus Clinical Feature #5: 'LYMPH.NODE.METASTASIS'
| nPatients | N0 | N1 | NX |
|---|---|---|---|
| ALL | 38 | 1 | 17 |
| subtype1 | 10 | 0 | 5 |
| subtype2 | 4 | 0 | 2 |
| subtype3 | 5 | 0 | 1 |
| subtype4 | 7 | 0 | 4 |
| subtype5 | 8 | 0 | 3 |
| subtype6 | 2 | 0 | 1 |
| subtype7 | 2 | 1 | 1 |
Figure S19. Get High-res Image Clustering Approach #3: 'RNAseq CNMF subtypes' versus Clinical Feature #5: 'LYMPH.NODE.METASTASIS'
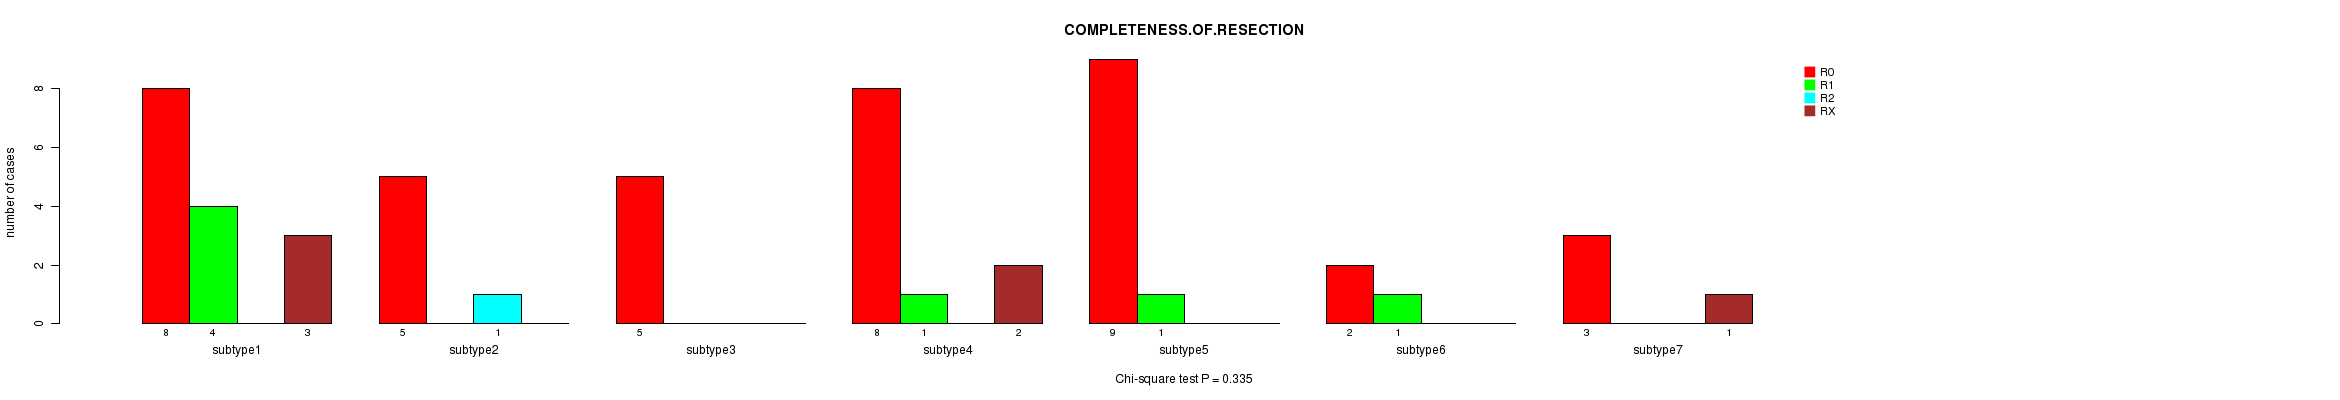
P value = 0.335 (Chi-square test), Q value = 1
Table S23. Clustering Approach #3: 'RNAseq CNMF subtypes' versus Clinical Feature #6: 'COMPLETENESS.OF.RESECTION'
| nPatients | R0 | R1 | R2 | RX |
|---|---|---|---|---|
| ALL | 40 | 7 | 1 | 6 |
| subtype1 | 8 | 4 | 0 | 3 |
| subtype2 | 5 | 0 | 1 | 0 |
| subtype3 | 5 | 0 | 0 | 0 |
| subtype4 | 8 | 1 | 0 | 2 |
| subtype5 | 9 | 1 | 0 | 0 |
| subtype6 | 2 | 1 | 0 | 0 |
| subtype7 | 3 | 0 | 0 | 1 |
Figure S20. Get High-res Image Clustering Approach #3: 'RNAseq CNMF subtypes' versus Clinical Feature #6: 'COMPLETENESS.OF.RESECTION'
P value = 0.0279 (Chi-square test), Q value = 1
Table S24. Clustering Approach #3: 'RNAseq CNMF subtypes' versus Clinical Feature #8: 'NEOPLASM.DISEASESTAGE'
| nPatients | STAGE I | STAGE II | STAGE IIIA | STAGE IIIB | STAGE IIIC | STAGE IVB |
|---|---|---|---|---|---|---|
| ALL | 22 | 10 | 12 | 3 | 1 | 1 |
| subtype1 | 2 | 3 | 7 | 1 | 0 | 0 |
| subtype2 | 2 | 1 | 1 | 0 | 0 | 1 |
| subtype3 | 3 | 0 | 1 | 1 | 0 | 0 |
| subtype4 | 8 | 0 | 1 | 0 | 0 | 0 |
| subtype5 | 5 | 3 | 2 | 0 | 0 | 0 |
| subtype6 | 1 | 2 | 0 | 0 | 0 | 0 |
| subtype7 | 1 | 1 | 0 | 1 | 1 | 0 |
Figure S21. Get High-res Image Clustering Approach #3: 'RNAseq CNMF subtypes' versus Clinical Feature #8: 'NEOPLASM.DISEASESTAGE'

Table S25. Get Full Table Description of clustering approach #4: 'RNAseq cHierClus subtypes'
| Cluster Labels | 1 | 2 |
|---|---|---|
| Number of samples | 24 | 34 |
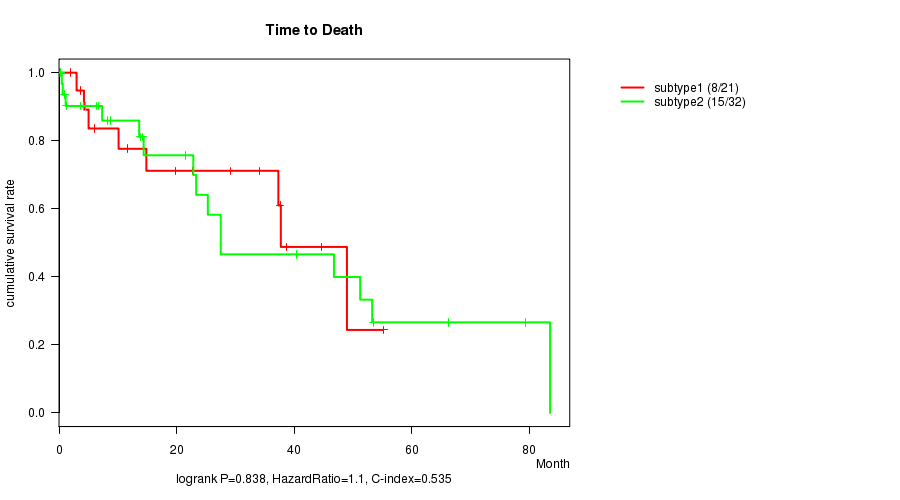
P value = 0.838 (logrank test), Q value = 1
Table S26. Clustering Approach #4: 'RNAseq cHierClus subtypes' versus Clinical Feature #1: 'Time to Death'
| nPatients | nDeath | Duration Range (Median), Month | |
|---|---|---|---|
| ALL | 53 | 23 | 0.1 - 83.6 (14.4) |
| subtype1 | 21 | 8 | 0.1 - 55.2 (19.8) |
| subtype2 | 32 | 15 | 0.3 - 83.6 (14.0) |
Figure S22. Get High-res Image Clustering Approach #4: 'RNAseq cHierClus subtypes' versus Clinical Feature #1: 'Time to Death'
P value = 0.058 (t-test), Q value = 1
Table S27. Clustering Approach #4: 'RNAseq cHierClus subtypes' versus Clinical Feature #2: 'AGE'
| nPatients | Mean (Std.Dev) | |
|---|---|---|
| ALL | 57 | 60.5 (14.3) |
| subtype1 | 24 | 56.0 (16.5) |
| subtype2 | 33 | 63.7 (11.6) |
Figure S23. Get High-res Image Clustering Approach #4: 'RNAseq cHierClus subtypes' versus Clinical Feature #2: 'AGE'

P value = 0.0536 (Fisher's exact test), Q value = 1
Table S28. Clustering Approach #4: 'RNAseq cHierClus subtypes' versus Clinical Feature #3: 'GENDER'
| nPatients | FEMALE | MALE |
|---|---|---|
| ALL | 22 | 36 |
| subtype1 | 13 | 11 |
| subtype2 | 9 | 25 |
Figure S24. Get High-res Image Clustering Approach #4: 'RNAseq cHierClus subtypes' versus Clinical Feature #3: 'GENDER'

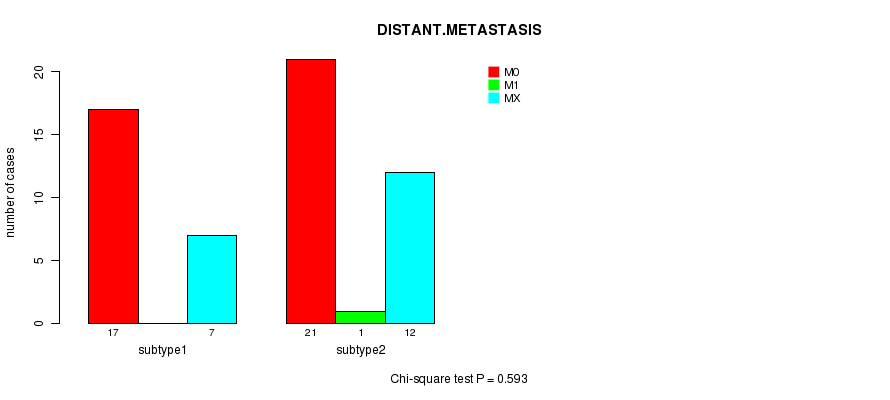
P value = 0.593 (Chi-square test), Q value = 1
Table S29. Clustering Approach #4: 'RNAseq cHierClus subtypes' versus Clinical Feature #4: 'DISTANT.METASTASIS'
| nPatients | M0 | M1 | MX |
|---|---|---|---|
| ALL | 38 | 1 | 19 |
| subtype1 | 17 | 0 | 7 |
| subtype2 | 21 | 1 | 12 |
Figure S25. Get High-res Image Clustering Approach #4: 'RNAseq cHierClus subtypes' versus Clinical Feature #4: 'DISTANT.METASTASIS'
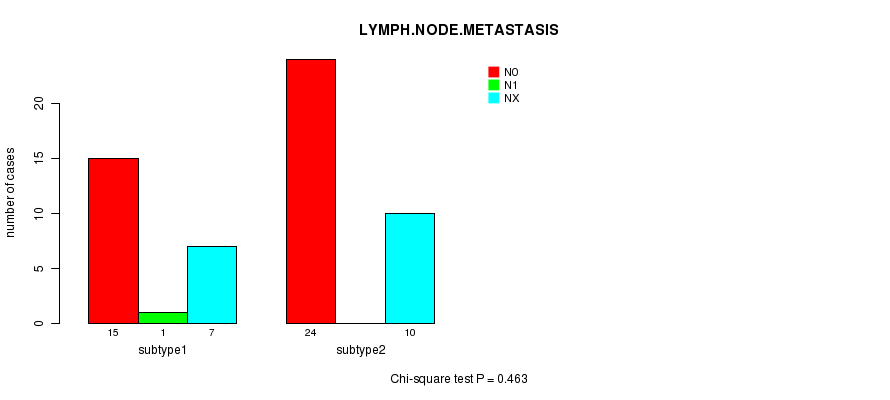
P value = 0.463 (Chi-square test), Q value = 1
Table S30. Clustering Approach #4: 'RNAseq cHierClus subtypes' versus Clinical Feature #5: 'LYMPH.NODE.METASTASIS'
| nPatients | N0 | N1 | NX |
|---|---|---|---|
| ALL | 39 | 1 | 17 |
| subtype1 | 15 | 1 | 7 |
| subtype2 | 24 | 0 | 10 |
Figure S26. Get High-res Image Clustering Approach #4: 'RNAseq cHierClus subtypes' versus Clinical Feature #5: 'LYMPH.NODE.METASTASIS'
P value = 0.337 (Chi-square test), Q value = 1
Table S31. Clustering Approach #4: 'RNAseq cHierClus subtypes' versus Clinical Feature #6: 'COMPLETENESS.OF.RESECTION'
| nPatients | R0 | R1 | R2 | RX |
|---|---|---|---|---|
| ALL | 41 | 7 | 1 | 6 |
| subtype1 | 15 | 4 | 0 | 4 |
| subtype2 | 26 | 3 | 1 | 2 |
Figure S27. Get High-res Image Clustering Approach #4: 'RNAseq cHierClus subtypes' versus Clinical Feature #6: 'COMPLETENESS.OF.RESECTION'

P value = 0.179 (Chi-square test), Q value = 1
Table S32. Clustering Approach #4: 'RNAseq cHierClus subtypes' versus Clinical Feature #8: 'NEOPLASM.DISEASESTAGE'
| nPatients | STAGE I | STAGE II | STAGE IIIA | STAGE IIIB | STAGE IIIC | STAGE IVB |
|---|---|---|---|---|---|---|
| ALL | 22 | 11 | 12 | 3 | 1 | 1 |
| subtype1 | 5 | 5 | 7 | 2 | 1 | 0 |
| subtype2 | 17 | 6 | 5 | 1 | 0 | 1 |
Figure S28. Get High-res Image Clustering Approach #4: 'RNAseq cHierClus subtypes' versus Clinical Feature #8: 'NEOPLASM.DISEASESTAGE'
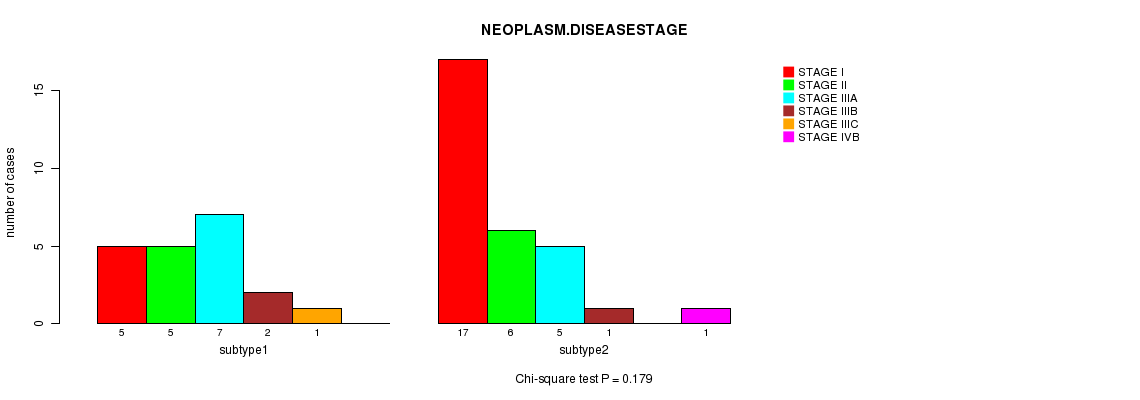
Table S33. Get Full Table Description of clustering approach #5: 'MIRSEQ CNMF'
| Cluster Labels | 1 | 2 | 3 |
|---|---|---|---|
| Number of samples | 25 | 12 | 31 |
P value = 0.676 (logrank test), Q value = 1
Table S34. Clustering Approach #5: 'MIRSEQ CNMF' versus Clinical Feature #1: 'Time to Death'
| nPatients | nDeath | Duration Range (Median), Month | |
|---|---|---|---|
| ALL | 61 | 25 | 0.1 - 83.6 (13.8) |
| subtype1 | 22 | 11 | 0.1 - 69.6 (14.6) |
| subtype2 | 9 | 4 | 1.1 - 83.6 (5.9) |
| subtype3 | 30 | 10 | 0.3 - 79.4 (19.4) |
Figure S29. Get High-res Image Clustering Approach #5: 'MIRSEQ CNMF' versus Clinical Feature #1: 'Time to Death'

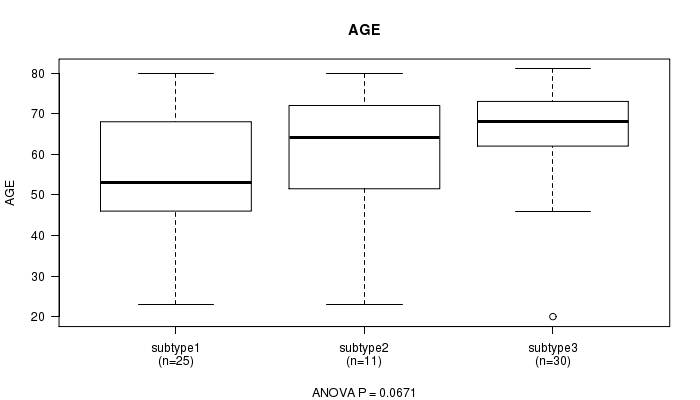
P value = 0.0671 (ANOVA), Q value = 1
Table S35. Clustering Approach #5: 'MIRSEQ CNMF' versus Clinical Feature #2: 'AGE'
| nPatients | Mean (Std.Dev) | |
|---|---|---|
| ALL | 66 | 60.8 (14.9) |
| subtype1 | 25 | 56.0 (15.6) |
| subtype2 | 11 | 59.5 (17.8) |
| subtype3 | 30 | 65.2 (12.1) |
Figure S30. Get High-res Image Clustering Approach #5: 'MIRSEQ CNMF' versus Clinical Feature #2: 'AGE'
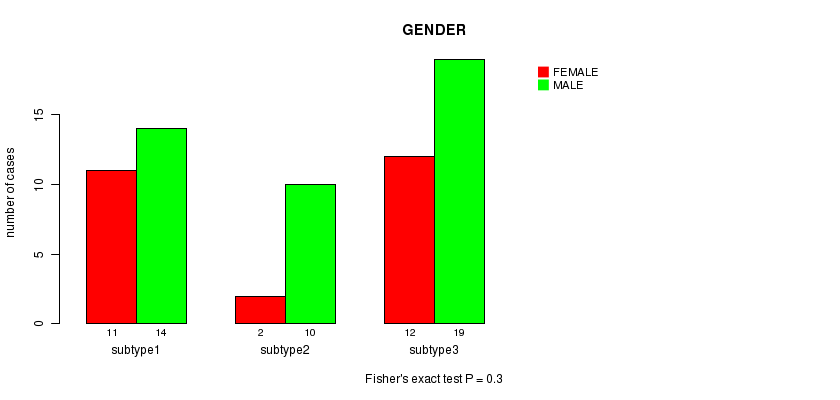
P value = 0.3 (Fisher's exact test), Q value = 1
Table S36. Clustering Approach #5: 'MIRSEQ CNMF' versus Clinical Feature #3: 'GENDER'
| nPatients | FEMALE | MALE |
|---|---|---|
| ALL | 25 | 43 |
| subtype1 | 11 | 14 |
| subtype2 | 2 | 10 |
| subtype3 | 12 | 19 |
Figure S31. Get High-res Image Clustering Approach #5: 'MIRSEQ CNMF' versus Clinical Feature #3: 'GENDER'
P value = 0.781 (Chi-square test), Q value = 1
Table S37. Clustering Approach #5: 'MIRSEQ CNMF' versus Clinical Feature #4: 'DISTANT.METASTASIS'
| nPatients | M0 | M1 | MX |
|---|---|---|---|
| ALL | 45 | 1 | 22 |
| subtype1 | 16 | 1 | 8 |
| subtype2 | 8 | 0 | 4 |
| subtype3 | 21 | 0 | 10 |
Figure S32. Get High-res Image Clustering Approach #5: 'MIRSEQ CNMF' versus Clinical Feature #4: 'DISTANT.METASTASIS'

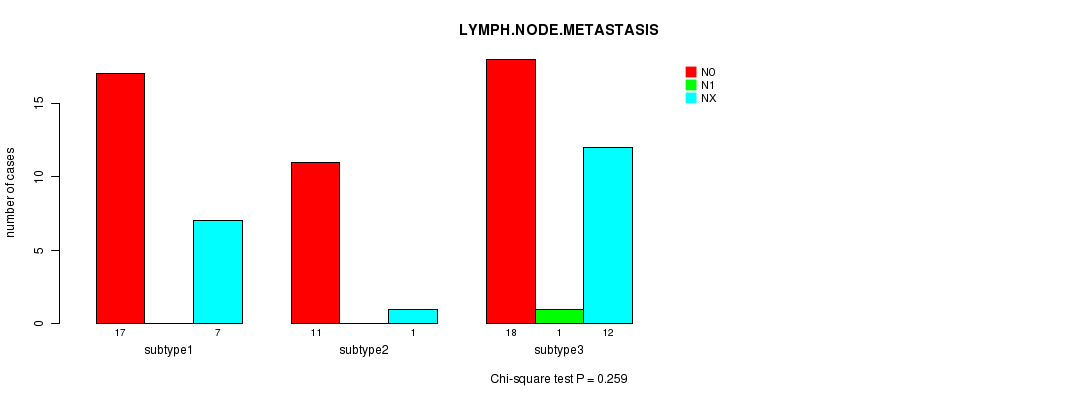
P value = 0.259 (Chi-square test), Q value = 1
Table S38. Clustering Approach #5: 'MIRSEQ CNMF' versus Clinical Feature #5: 'LYMPH.NODE.METASTASIS'
| nPatients | N0 | N1 | NX |
|---|---|---|---|
| ALL | 46 | 1 | 20 |
| subtype1 | 17 | 0 | 7 |
| subtype2 | 11 | 0 | 1 |
| subtype3 | 18 | 1 | 12 |
Figure S33. Get High-res Image Clustering Approach #5: 'MIRSEQ CNMF' versus Clinical Feature #5: 'LYMPH.NODE.METASTASIS'
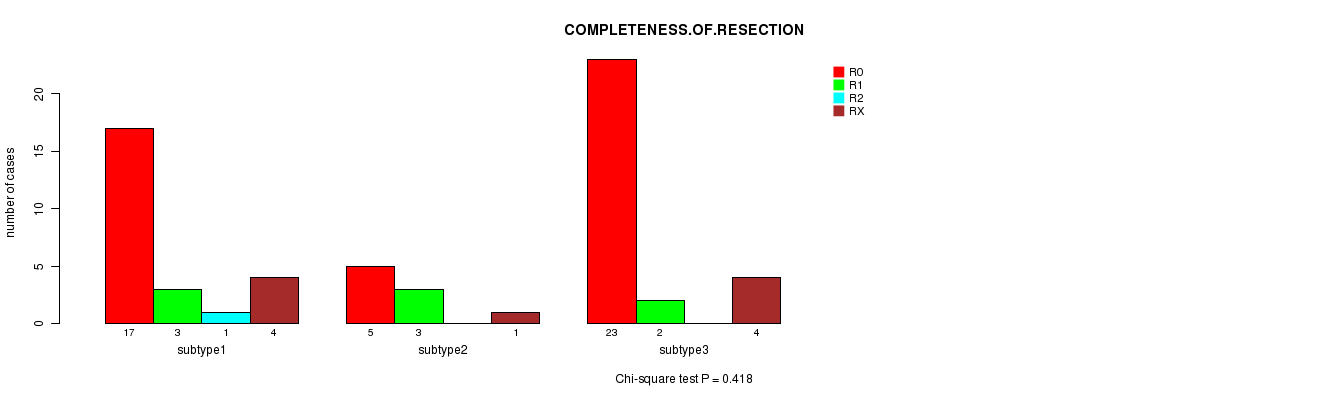
P value = 0.418 (Chi-square test), Q value = 1
Table S39. Clustering Approach #5: 'MIRSEQ CNMF' versus Clinical Feature #6: 'COMPLETENESS.OF.RESECTION'
| nPatients | R0 | R1 | R2 | RX |
|---|---|---|---|---|
| ALL | 45 | 8 | 1 | 9 |
| subtype1 | 17 | 3 | 1 | 4 |
| subtype2 | 5 | 3 | 0 | 1 |
| subtype3 | 23 | 2 | 0 | 4 |
Figure S34. Get High-res Image Clustering Approach #5: 'MIRSEQ CNMF' versus Clinical Feature #6: 'COMPLETENESS.OF.RESECTION'
P value = 0.412 (Chi-square test), Q value = 1
Table S40. Clustering Approach #5: 'MIRSEQ CNMF' versus Clinical Feature #8: 'NEOPLASM.DISEASESTAGE'
| nPatients | STAGE I | STAGE II | STAGE IIIA | STAGE IIIB | STAGE IIIC | STAGE IVB |
|---|---|---|---|---|---|---|
| ALL | 27 | 12 | 14 | 4 | 1 | 1 |
| subtype1 | 6 | 5 | 5 | 3 | 0 | 1 |
| subtype2 | 5 | 2 | 4 | 1 | 0 | 0 |
| subtype3 | 16 | 5 | 5 | 0 | 1 | 0 |
Figure S35. Get High-res Image Clustering Approach #5: 'MIRSEQ CNMF' versus Clinical Feature #8: 'NEOPLASM.DISEASESTAGE'
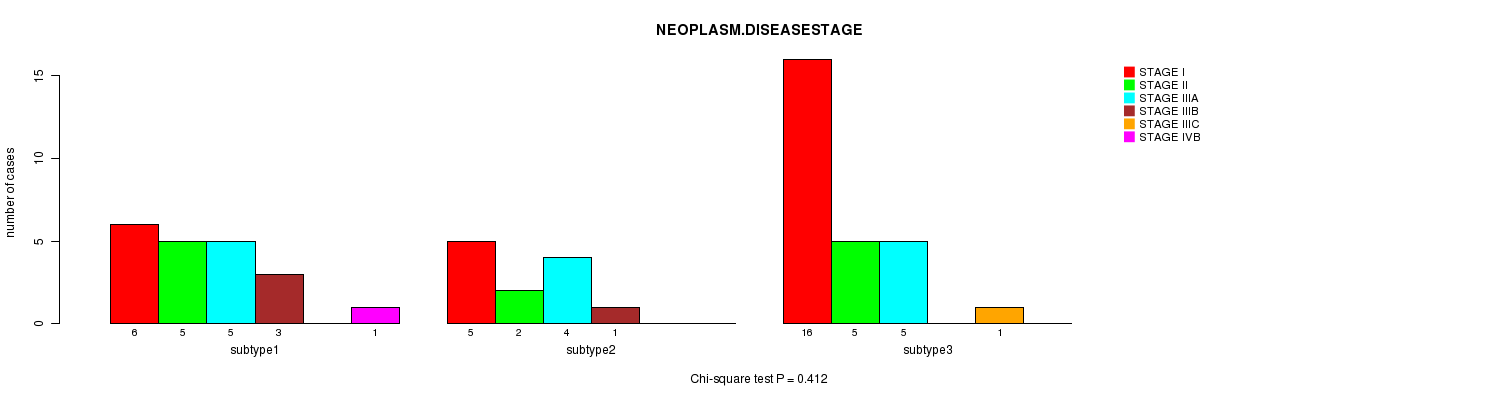
Table S41. Get Full Table Description of clustering approach #6: 'MIRSEQ CHIERARCHICAL'
| Cluster Labels | 1 | 2 | 3 | 4 |
|---|---|---|---|---|
| Number of samples | 10 | 9 | 24 | 25 |
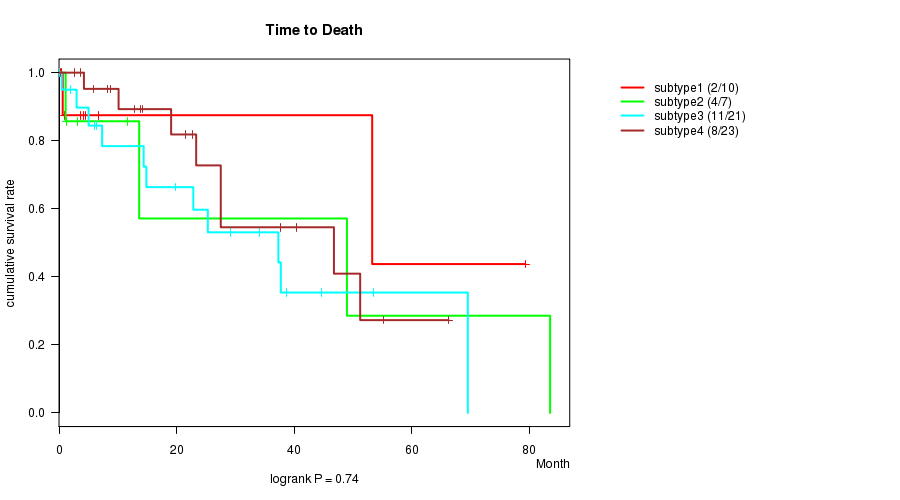
P value = 0.74 (logrank test), Q value = 1
Table S42. Clustering Approach #6: 'MIRSEQ CHIERARCHICAL' versus Clinical Feature #1: 'Time to Death'
| nPatients | nDeath | Duration Range (Median), Month | |
|---|---|---|---|
| ALL | 61 | 25 | 0.1 - 83.6 (13.8) |
| subtype1 | 10 | 2 | 0.3 - 79.4 (3.9) |
| subtype2 | 7 | 4 | 1.1 - 83.6 (11.6) |
| subtype3 | 21 | 11 | 0.1 - 69.6 (19.8) |
| subtype4 | 23 | 8 | 2.6 - 66.3 (19.1) |
Figure S36. Get High-res Image Clustering Approach #6: 'MIRSEQ CHIERARCHICAL' versus Clinical Feature #1: 'Time to Death'
P value = 0.00482 (ANOVA), Q value = 0.2
Table S43. Clustering Approach #6: 'MIRSEQ CHIERARCHICAL' versus Clinical Feature #2: 'AGE'
| nPatients | Mean (Std.Dev) | |
|---|---|---|
| ALL | 66 | 60.8 (14.9) |
| subtype1 | 10 | 65.5 (6.4) |
| subtype2 | 9 | 60.2 (16.6) |
| subtype3 | 24 | 52.8 (17.0) |
| subtype4 | 23 | 67.2 (10.7) |
Figure S37. Get High-res Image Clustering Approach #6: 'MIRSEQ CHIERARCHICAL' versus Clinical Feature #2: 'AGE'

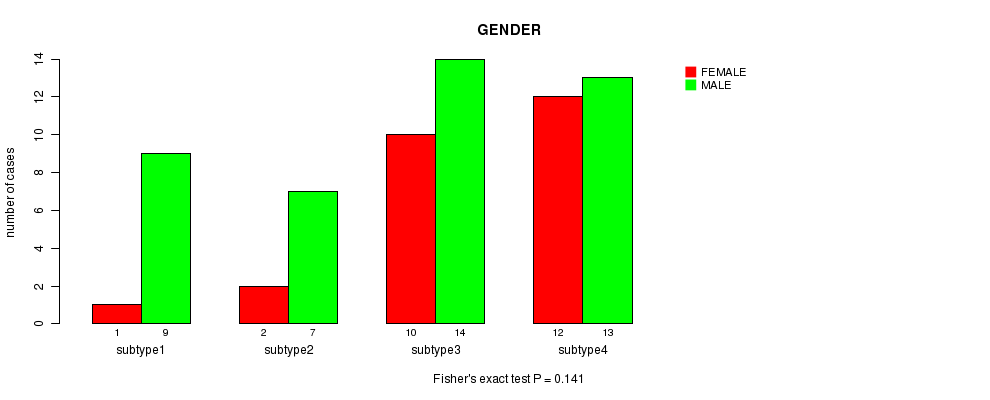
P value = 0.141 (Fisher's exact test), Q value = 1
Table S44. Clustering Approach #6: 'MIRSEQ CHIERARCHICAL' versus Clinical Feature #3: 'GENDER'
| nPatients | FEMALE | MALE |
|---|---|---|
| ALL | 25 | 43 |
| subtype1 | 1 | 9 |
| subtype2 | 2 | 7 |
| subtype3 | 10 | 14 |
| subtype4 | 12 | 13 |
Figure S38. Get High-res Image Clustering Approach #6: 'MIRSEQ CHIERARCHICAL' versus Clinical Feature #3: 'GENDER'
P value = 0.879 (Chi-square test), Q value = 1
Table S45. Clustering Approach #6: 'MIRSEQ CHIERARCHICAL' versus Clinical Feature #4: 'DISTANT.METASTASIS'
| nPatients | M0 | M1 | MX |
|---|---|---|---|
| ALL | 45 | 1 | 22 |
| subtype1 | 6 | 0 | 4 |
| subtype2 | 6 | 0 | 3 |
| subtype3 | 15 | 1 | 8 |
| subtype4 | 18 | 0 | 7 |
Figure S39. Get High-res Image Clustering Approach #6: 'MIRSEQ CHIERARCHICAL' versus Clinical Feature #4: 'DISTANT.METASTASIS'

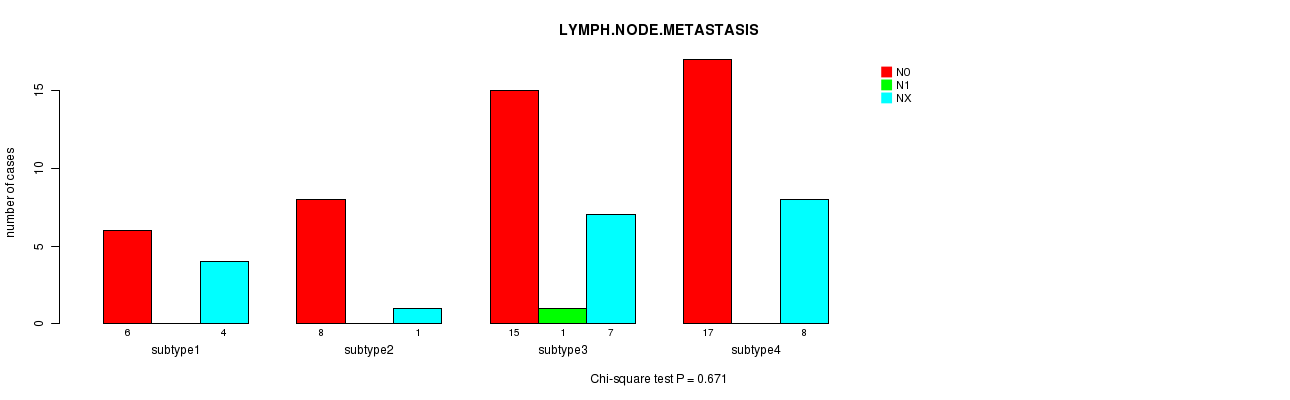
P value = 0.671 (Chi-square test), Q value = 1
Table S46. Clustering Approach #6: 'MIRSEQ CHIERARCHICAL' versus Clinical Feature #5: 'LYMPH.NODE.METASTASIS'
| nPatients | N0 | N1 | NX |
|---|---|---|---|
| ALL | 46 | 1 | 20 |
| subtype1 | 6 | 0 | 4 |
| subtype2 | 8 | 0 | 1 |
| subtype3 | 15 | 1 | 7 |
| subtype4 | 17 | 0 | 8 |
Figure S40. Get High-res Image Clustering Approach #6: 'MIRSEQ CHIERARCHICAL' versus Clinical Feature #5: 'LYMPH.NODE.METASTASIS'
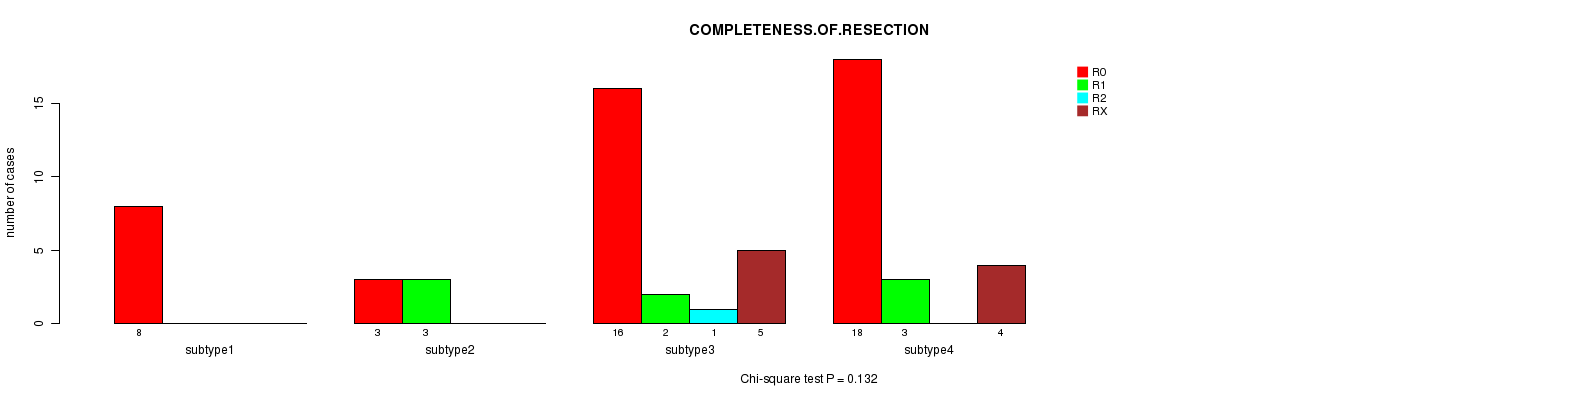
P value = 0.132 (Chi-square test), Q value = 1
Table S47. Clustering Approach #6: 'MIRSEQ CHIERARCHICAL' versus Clinical Feature #6: 'COMPLETENESS.OF.RESECTION'
| nPatients | R0 | R1 | R2 | RX |
|---|---|---|---|---|
| ALL | 45 | 8 | 1 | 9 |
| subtype1 | 8 | 0 | 0 | 0 |
| subtype2 | 3 | 3 | 0 | 0 |
| subtype3 | 16 | 2 | 1 | 5 |
| subtype4 | 18 | 3 | 0 | 4 |
Figure S41. Get High-res Image Clustering Approach #6: 'MIRSEQ CHIERARCHICAL' versus Clinical Feature #6: 'COMPLETENESS.OF.RESECTION'
P value = 0.865 (Chi-square test), Q value = 1
Table S48. Clustering Approach #6: 'MIRSEQ CHIERARCHICAL' versus Clinical Feature #8: 'NEOPLASM.DISEASESTAGE'
| nPatients | STAGE I | STAGE II | STAGE IIIA | STAGE IIIB | STAGE IIIC | STAGE IVB |
|---|---|---|---|---|---|---|
| ALL | 27 | 12 | 14 | 4 | 1 | 1 |
| subtype1 | 5 | 2 | 3 | 0 | 0 | 0 |
| subtype2 | 3 | 1 | 4 | 1 | 0 | 0 |
| subtype3 | 8 | 5 | 3 | 2 | 1 | 1 |
| subtype4 | 11 | 4 | 4 | 1 | 0 | 0 |
Figure S42. Get High-res Image Clustering Approach #6: 'MIRSEQ CHIERARCHICAL' versus Clinical Feature #8: 'NEOPLASM.DISEASESTAGE'

-
Cluster data file = LIHC-TP.mergedcluster.txt
-
Clinical data file = LIHC-TP.clin.merged.picked.txt
-
Number of patients = 69
-
Number of clustering approaches = 6
-
Number of selected clinical features = 8
-
Exclude small clusters that include fewer than K patients, K = 3
consensus non-negative matrix factorization clustering approach (Brunet et al. 2004)
Resampling-based clustering method (Monti et al. 2003)
For survival clinical features, the Kaplan-Meier survival curves of tumors with and without gene mutations were plotted and the statistical significance P values were estimated by logrank test (Bland and Altman 2004) using the 'survdiff' function in R
For continuous numerical clinical features, one-way analysis of variance (Howell 2002) was applied to compare the clinical values between tumor subtypes using 'anova' function in R
For binary clinical features, two-tailed Fisher's exact tests (Fisher 1922) were used to estimate the P values using the 'fisher.test' function in R
For multi-class clinical features (nominal or ordinal), Chi-square tests (Greenwood and Nikulin 1996) were used to estimate the P values using the 'chisq.test' function in R
For continuous numerical clinical features, two-tailed Student's t test with unequal variance (Lehmann and Romano 2005) was applied to compare the clinical values between two tumor subtypes using 't.test' function in R
For multiple hypothesis correction, Q value is the False Discovery Rate (FDR) analogue of the P value (Benjamini and Hochberg 1995), defined as the minimum FDR at which the test may be called significant. We used the 'Benjamini and Hochberg' method of 'p.adjust' function in R to convert P values into Q values.
This is an experimental feature. The full results of the analysis summarized in this report can be downloaded from the TCGA Data Coordination Center.