(primary solid tumor cohort)
This pipeline uses various statistical tests to identify genes whose promoter methylation levels correlated to selected clinical features.
Testing the association between 17375 genes and 14 clinical features across 263 samples, statistically thresholded by Q value < 0.05, 13 clinical features related to at least one genes.
-
19 genes correlated to 'Time to Death'.
-
FUT1 , MARVELD1 , LOC650368 , LARP1 , RRAGD , ...
-
2 genes correlated to 'AGE'.
-
ACN9 , KIF15
-
49 genes correlated to 'GENDER'.
-
CCNYL1 , KIF4B , EIF4A1 , RNASEH2C , GPN1 , ...
-
1 gene correlated to 'KARNOFSKY.PERFORMANCE.SCORE'.
-
KRT72
-
89 genes correlated to 'HISTOLOGICAL.TYPE'.
-
USMG5 , GOPC , MURC , GNG10 , KRT39 , ...
-
1 gene correlated to 'PATHOLOGY.T'.
-
KCNK12
-
1 gene correlated to 'PATHOLOGY.N'.
-
VAMP1
-
224 genes correlated to 'PATHOLOGICSPREAD(M)'.
-
POLR2J2 , B3GNT2 , MSRA , HOMER3 , METTL11A , ...
-
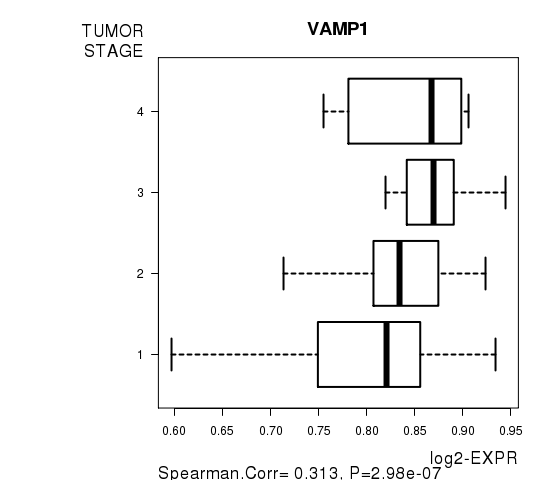
2 genes correlated to 'TUMOR.STAGE'.
-
VAMP1 , ANK3
-
14 genes correlated to 'RADIATIONS.RADIATION.REGIMENINDICATION'.
-
ZNF642 , SLCO4C1 , PRELP , MAT2B , TRAPPC5 , ...
-
28 genes correlated to 'TOBACCOSMOKINGHISTORYINDICATOR'.
-
SRM , GIT1 , NME2 , SNHG1 , RPS8 , ...
-
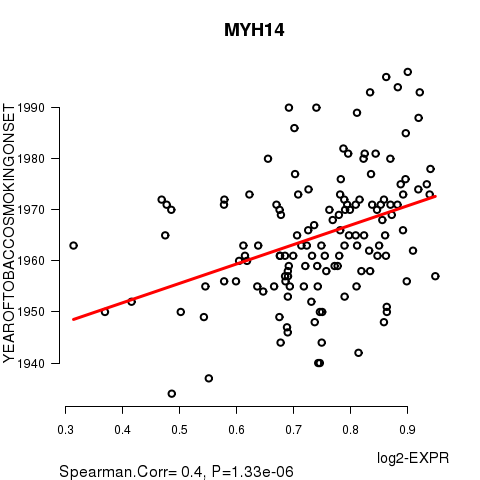
1 gene correlated to 'YEAROFTOBACCOSMOKINGONSET'.
-
MYH14
-
106 genes correlated to 'COMPLETENESS.OF.RESECTION'.
-
DDX52 , MAN2A1 , CCDC53 , AFF1 , ZNF619 , ...
-
No genes correlated to 'NUMBERPACKYEARSSMOKED'
Complete statistical result table is provided in Supplement Table 1
Table 1. Get Full Table This table shows the clinical features, statistical methods used, and the number of genes that are significantly associated with each clinical feature at Q value < 0.05.
| Clinical feature | Statistical test | Significant genes | Associated with | Associated with | ||
|---|---|---|---|---|---|---|
| Time to Death | Cox regression test | N=19 | shorter survival | N=7 | longer survival | N=12 |
| AGE | Spearman correlation test | N=2 | older | N=2 | younger | N=0 |
| GENDER | t test | N=49 | male | N=5 | female | N=44 |
| KARNOFSKY PERFORMANCE SCORE | Spearman correlation test | N=1 | higher score | N=1 | lower score | N=0 |
| HISTOLOGICAL TYPE | ANOVA test | N=89 | ||||
| PATHOLOGY T | Spearman correlation test | N=1 | higher pT | N=1 | lower pT | N=0 |
| PATHOLOGY N | Spearman correlation test | N=1 | higher pN | N=1 | lower pN | N=0 |
| PATHOLOGICSPREAD(M) | ANOVA test | N=224 | ||||
| TUMOR STAGE | Spearman correlation test | N=2 | higher stage | N=1 | lower stage | N=1 |
| RADIATIONS RADIATION REGIMENINDICATION | t test | N=14 | yes | N=10 | no | N=4 |
| NUMBERPACKYEARSSMOKED | Spearman correlation test | N=0 | ||||
| TOBACCOSMOKINGHISTORYINDICATOR | ANOVA test | N=28 | ||||
| YEAROFTOBACCOSMOKINGONSET | Spearman correlation test | N=1 | higher yearoftobaccosmokingonset | N=1 | lower yearoftobaccosmokingonset | N=0 |
| COMPLETENESS OF RESECTION | ANOVA test | N=106 |
Table S1. Basic characteristics of clinical feature: 'Time to Death'
| Time to Death | Duration (Months) | 0-224 (median=8.4) |
| censored | N = 174 | |
| death | N = 59 | |
| Significant markers | N = 19 | |
| associated with shorter survival | 7 | |
| associated with longer survival | 12 |
Table S2. Get Full Table List of top 10 genes significantly associated with 'Time to Death' by Cox regression test
| HazardRatio | Wald_P | Q | C_index | |
|---|---|---|---|---|
| FUT1 | 12001 | 1.269e-08 | 0.00022 | 0.672 |
| MARVELD1 | 0 | 1.529e-08 | 0.00027 | 0.324 |
| LOC650368 | 0 | 4.173e-08 | 0.00072 | 0.339 |
| LARP1 | 0 | 6.358e-08 | 0.0011 | 0.295 |
| RRAGD | 241 | 2.171e-07 | 0.0038 | 0.634 |
| APOBEC4 | 0 | 3.365e-07 | 0.0058 | 0.382 |
| IBSP | 0 | 5.108e-07 | 0.0089 | 0.375 |
| ZNF117 | 0 | 5.702e-07 | 0.0099 | 0.392 |
| MAP7D1 | 0 | 9.255e-07 | 0.016 | 0.41 |
| DPH2 | 140001 | 1.447e-06 | 0.025 | 0.563 |
Figure S1. Get High-res Image As an example, this figure shows the association of FUT1 to 'Time to Death'. four curves present the cumulative survival rates of 4 quartile subsets of patients. P value = 1.27e-08 with univariate Cox regression analysis using continuous log-2 expression values.
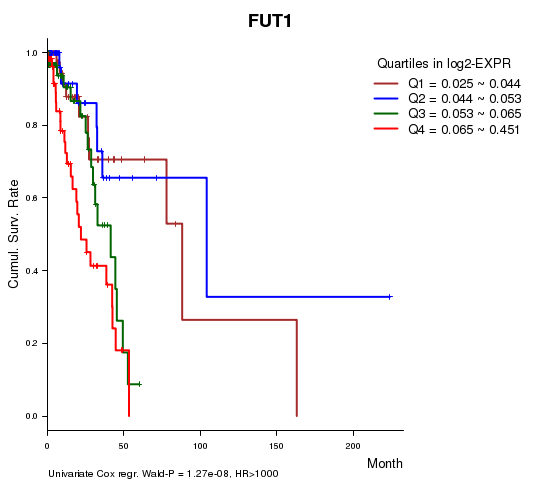
Table S3. Basic characteristics of clinical feature: 'AGE'
| AGE | Mean (SD) | 65.34 (9.9) |
| Significant markers | N = 2 | |
| pos. correlated | 2 | |
| neg. correlated | 0 |
Table S4. Get Full Table List of 2 genes significantly correlated to 'AGE' by Spearman correlation test
| SpearmanCorr | corrP | Q | |
|---|---|---|---|
| ACN9 | 0.3045 | 2.066e-06 | 0.0359 |
| KIF15 | 0.3021 | 2.387e-06 | 0.0415 |
Figure S2. Get High-res Image As an example, this figure shows the association of ACN9 to 'AGE'. P value = 2.07e-06 with Spearman correlation analysis. The straight line presents the best linear regression.
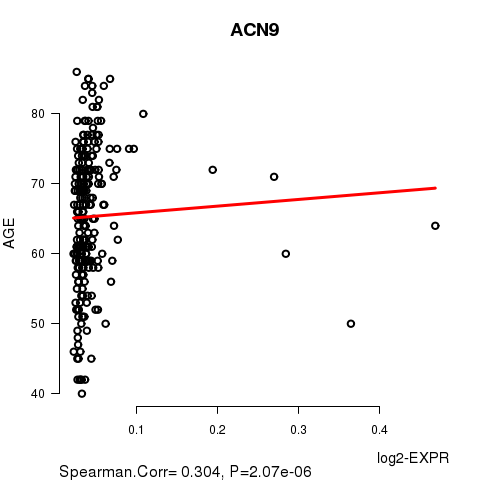
Table S5. Basic characteristics of clinical feature: 'GENDER'
| GENDER | Labels | N |
| FEMALE | 143 | |
| MALE | 120 | |
| Significant markers | N = 49 | |
| Higher in MALE | 5 | |
| Higher in FEMALE | 44 |
Table S6. Get Full Table List of top 10 genes differentially expressed by 'GENDER'
| T(pos if higher in 'MALE') | ttestP | Q | AUC | |
|---|---|---|---|---|
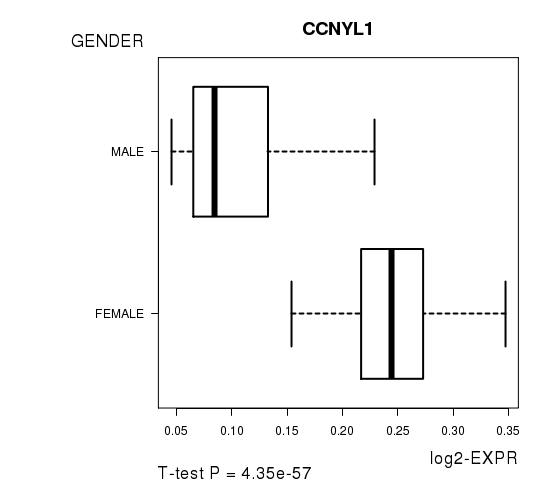
| CCNYL1 | -21.89 | 4.347e-57 | 7.55e-53 | 0.9524 |
| KIF4B | -12.13 | 7.838e-27 | 1.36e-22 | 0.8591 |
| EIF4A1 | -8.51 | 2.563e-15 | 4.45e-11 | 0.7906 |
| RNASEH2C | 8.06 | 2.851e-14 | 4.95e-10 | 0.7512 |
| GPN1 | -7.17 | 1.107e-11 | 1.92e-07 | 0.7272 |
| FRG1B | -6.84 | 6.513e-11 | 1.13e-06 | 0.7513 |
| SPESP1 | -6.47 | 6.527e-10 | 1.13e-05 | 0.7106 |
| ZNF839 | -6.41 | 6.917e-10 | 1.2e-05 | 0.7186 |
| ATP5J | 6.48 | 1.092e-09 | 1.9e-05 | 0.7308 |
| GABPA | 6.48 | 1.092e-09 | 1.9e-05 | 0.7308 |
Figure S3. Get High-res Image As an example, this figure shows the association of CCNYL1 to 'GENDER'. P value = 4.35e-57 with T-test analysis.
One gene related to 'KARNOFSKY.PERFORMANCE.SCORE'.
Table S7. Basic characteristics of clinical feature: 'KARNOFSKY.PERFORMANCE.SCORE'
| KARNOFSKY.PERFORMANCE.SCORE | Mean (SD) | 73.81 (32) |
| Significant markers | N = 1 | |
| pos. correlated | 1 | |
| neg. correlated | 0 |
Table S8. Get Full Table List of one gene significantly correlated to 'KARNOFSKY.PERFORMANCE.SCORE' by Spearman correlation test
| SpearmanCorr | corrP | Q | |
|---|---|---|---|
| KRT72 | 0.8588 | 6.26e-07 | 0.0109 |
Figure S4. Get High-res Image As an example, this figure shows the association of KRT72 to 'KARNOFSKY.PERFORMANCE.SCORE'. P value = 6.26e-07 with Spearman correlation analysis. The straight line presents the best linear regression.
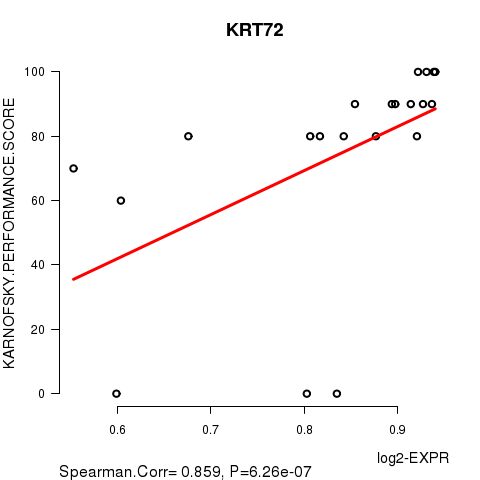
Table S9. Basic characteristics of clinical feature: 'HISTOLOGICAL.TYPE'
| HISTOLOGICAL.TYPE | Labels | N |
| LUNG ACINAR ADENOCARCINOMA | 10 | |
| LUNG ADENOCARCINOMA MIXED SUBTYPE | 59 | |
| LUNG ADENOCARCINOMA- NOT OTHERWISE SPECIFIED (NOS) | 154 | |
| LUNG BRONCHIOLOALVEOLAR CARCINOMA MUCINOUS | 3 | |
| LUNG BRONCHIOLOALVEOLAR CARCINOMA NONMUCINOUS | 14 | |
| LUNG CLEAR CELL ADENOCARCINOMA | 1 | |
| LUNG MICROPAPILLARY ADENOCARCINOMA | 2 | |
| LUNG MUCINOUS ADENOCARCINOMA | 2 | |
| LUNG PAPILLARY ADENOCARCINOMA | 12 | |
| LUNG SOLID PATTERN PREDOMINANT ADENOCARCINOMA | 2 | |
| MUCINOUS (COLLOID) ADENOCARCINOMA | 4 | |
| Significant markers | N = 89 |
Table S10. Get Full Table List of top 10 genes differentially expressed by 'HISTOLOGICAL.TYPE'
| ANOVA_P | Q | |
|---|---|---|
| USMG5 | 9.011e-32 | 1.57e-27 |
| GOPC | 9.788e-28 | 1.7e-23 |
| MURC | 4.088e-27 | 7.1e-23 |
| GNG10 | 1.288e-26 | 2.24e-22 |
| KRT39 | 2.439e-22 | 4.24e-18 |
| KAT5 | 1.228e-20 | 2.13e-16 |
| MED17 | 8.191e-19 | 1.42e-14 |
| BCR | 8.288e-19 | 1.44e-14 |
| GLTSCR2 | 9.392e-16 | 1.63e-11 |
| CRISPLD2 | 1.62e-14 | 2.81e-10 |
Figure S5. Get High-res Image As an example, this figure shows the association of USMG5 to 'HISTOLOGICAL.TYPE'. P value = 9.01e-32 with ANOVA analysis.
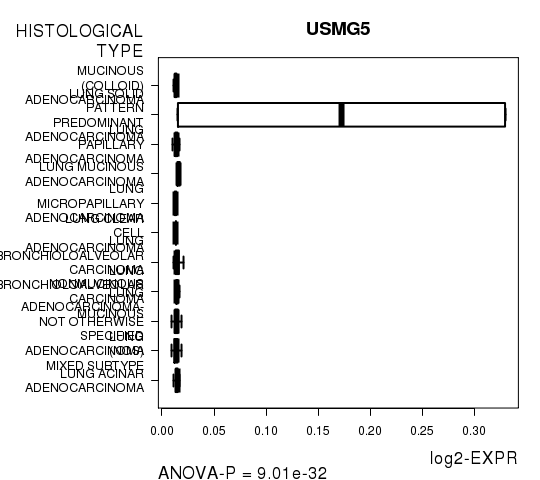
Table S11. Basic characteristics of clinical feature: 'PATHOLOGY.T'
| PATHOLOGY.T | Mean (SD) | 1.88 (0.77) |
| N | ||
| T1 | 80 | |
| T2 | 146 | |
| T3 | 21 | |
| T4 | 14 | |
| Significant markers | N = 1 | |
| pos. correlated | 1 | |
| neg. correlated | 0 |
Table S12. Get Full Table List of one gene significantly correlated to 'PATHOLOGY.T' by Spearman correlation test
| SpearmanCorr | corrP | Q | |
|---|---|---|---|
| KCNK12 | 0.2914 | 1.671e-06 | 0.029 |
Figure S6. Get High-res Image As an example, this figure shows the association of KCNK12 to 'PATHOLOGY.T'. P value = 1.67e-06 with Spearman correlation analysis.
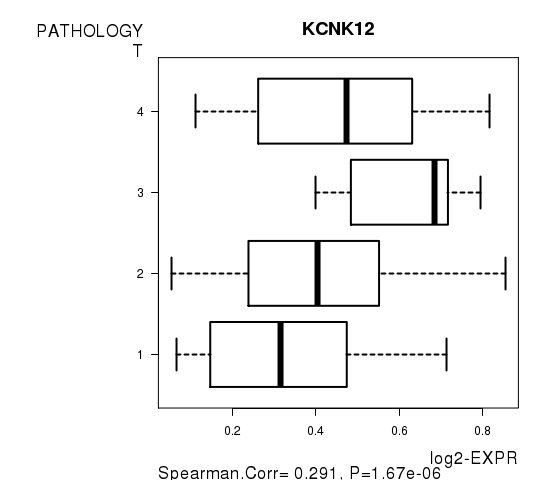
Table S13. Basic characteristics of clinical feature: 'PATHOLOGY.N'
| PATHOLOGY.N | Mean (SD) | 0.53 (0.77) |
| N | ||
| N0 | 163 | |
| N1 | 50 | |
| N2 | 43 | |
| Significant markers | N = 1 | |
| pos. correlated | 1 | |
| neg. correlated | 0 |
Table S14. Get Full Table List of one gene significantly correlated to 'PATHOLOGY.N' by Spearman correlation test
| SpearmanCorr | corrP | Q | |
|---|---|---|---|
| VAMP1 | 0.3081 | 4.95e-07 | 0.0086 |
Figure S7. Get High-res Image As an example, this figure shows the association of VAMP1 to 'PATHOLOGY.N'. P value = 4.95e-07 with Spearman correlation analysis.
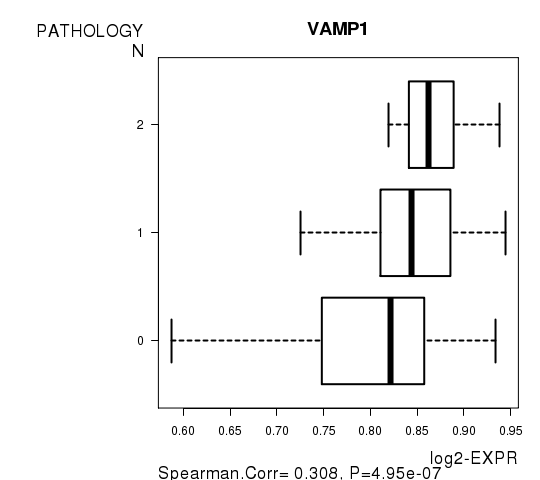
Table S15. Basic characteristics of clinical feature: 'PATHOLOGICSPREAD(M)'
| PATHOLOGICSPREAD(M) | Labels | N |
| M0 | 165 | |
| M1 | 11 | |
| M1B | 1 | |
| MX | 79 | |
| Significant markers | N = 224 |
Table S16. Get Full Table List of top 10 genes differentially expressed by 'PATHOLOGICSPREAD(M)'
| ANOVA_P | Q | |
|---|---|---|
| POLR2J2 | 5.642e-170 | 9.8e-166 |
| B3GNT2 | 1.475e-142 | 2.56e-138 |
| MSRA | 4.996e-85 | 8.68e-81 |
| HOMER3 | 1.717e-76 | 2.98e-72 |
| METTL11A | 1.8e-64 | 3.13e-60 |
| C8ORF55 | 2.765e-44 | 4.8e-40 |
| C7ORF46 | 7.301e-44 | 1.27e-39 |
| FAM13B | 1.361e-39 | 2.36e-35 |
| GSG1 | 1.35e-38 | 2.34e-34 |
| DDAH2 | 1.324e-37 | 2.3e-33 |
Figure S8. Get High-res Image As an example, this figure shows the association of POLR2J2 to 'PATHOLOGICSPREAD(M)'. P value = 5.64e-170 with ANOVA analysis.
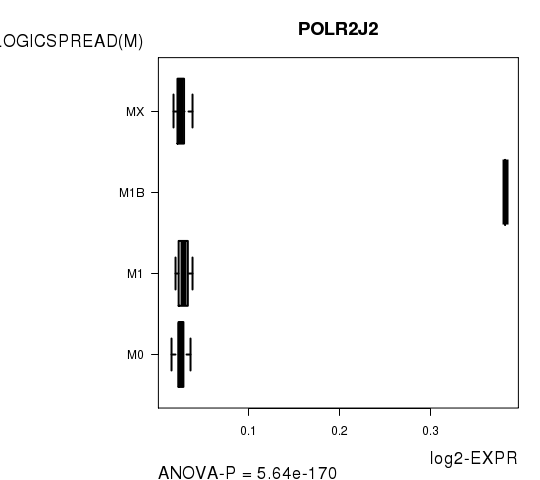
Table S17. Basic characteristics of clinical feature: 'TUMOR.STAGE'
| TUMOR.STAGE | Mean (SD) | 1.75 (0.93) |
| N | ||
| Stage 1 | 137 | |
| Stage 2 | 58 | |
| Stage 3 | 50 | |
| Stage 4 | 12 | |
| Significant markers | N = 2 | |
| pos. correlated | 1 | |
| neg. correlated | 1 |
Table S18. Get Full Table List of 2 genes significantly correlated to 'TUMOR.STAGE' by Spearman correlation test
| SpearmanCorr | corrP | Q | |
|---|---|---|---|
| VAMP1 | 0.3131 | 2.985e-07 | 0.00519 |
| ANK3 | -0.2921 | 1.98e-06 | 0.0344 |
Figure S9. Get High-res Image As an example, this figure shows the association of VAMP1 to 'TUMOR.STAGE'. P value = 2.98e-07 with Spearman correlation analysis.
14 genes related to 'RADIATIONS.RADIATION.REGIMENINDICATION'.
Table S19. Basic characteristics of clinical feature: 'RADIATIONS.RADIATION.REGIMENINDICATION'
| RADIATIONS.RADIATION.REGIMENINDICATION | Labels | N |
| NO | 14 | |
| YES | 249 | |
| Significant markers | N = 14 | |
| Higher in YES | 10 | |
| Higher in NO | 4 |
Table S20. Get Full Table List of top 10 genes differentially expressed by 'RADIATIONS.RADIATION.REGIMENINDICATION'
| T(pos if higher in 'YES') | ttestP | Q | AUC | |
|---|---|---|---|---|
| ZNF642 | 5.83 | 1.825e-08 | 0.000317 | 0.6793 |
| SLCO4C1 | 5.65 | 4.211e-08 | 0.000732 | 0.7352 |
| PRELP | -5.62 | 4.845e-08 | 0.000842 | 0.6604 |
| MAT2B | 5.72 | 6.515e-08 | 0.00113 | 0.5671 |
| TRAPPC5 | 5.54 | 7.471e-08 | 0.0013 | 0.6277 |
| MIIP | -5.87 | 7.747e-08 | 0.00135 | 0.5703 |
| ZNF506 | 5.64 | 2.418e-07 | 0.0042 | 0.5674 |
| PELI1 | -5.8 | 2.466e-07 | 0.00428 | 0.6434 |
| LMX1B | 5.43 | 2.576e-07 | 0.00447 | 0.6847 |
| C12ORF62 | 6.19 | 4.856e-07 | 0.00843 | 0.7553 |
Figure S10. Get High-res Image As an example, this figure shows the association of ZNF642 to 'RADIATIONS.RADIATION.REGIMENINDICATION'. P value = 1.83e-08 with T-test analysis.
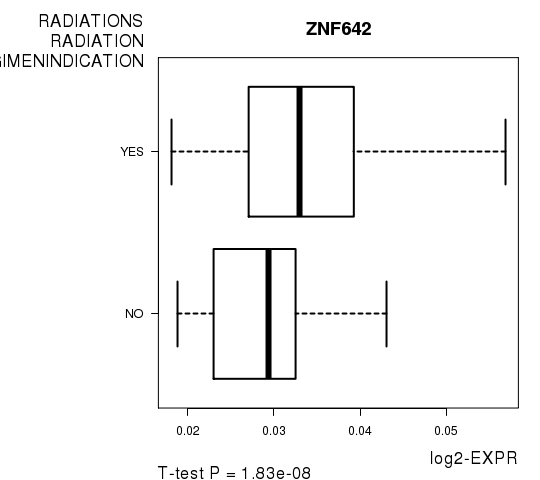
Table S21. Basic characteristics of clinical feature: 'NUMBERPACKYEARSSMOKED'
| NUMBERPACKYEARSSMOKED | Mean (SD) | 38.79 (26) |
| Significant markers | N = 0 |
28 genes related to 'TOBACCOSMOKINGHISTORYINDICATOR'.
Table S22. Basic characteristics of clinical feature: 'TOBACCOSMOKINGHISTORYINDICATOR'
| TOBACCOSMOKINGHISTORYINDICATOR | Labels | N |
| CURRENT REFORMED SMOKER FOR < OR = 15 YEARS | 91 | |
| CURRENT REFORMED SMOKER FOR > 15 YEARS | 68 | |
| CURRENT SMOKER | 57 | |
| LIFELONG NON-SMOKER | 36 | |
| Significant markers | N = 28 |
Table S23. Get Full Table List of top 10 genes differentially expressed by 'TOBACCOSMOKINGHISTORYINDICATOR'
| ANOVA_P | Q | |
|---|---|---|
| SRM | 1.116e-09 | 1.94e-05 |
| GIT1 | 3.498e-09 | 6.08e-05 |
| NME2 | 2.274e-08 | 0.000395 |
| SNHG1 | 3.202e-08 | 0.000556 |
| RPS8 | 3.753e-08 | 0.000652 |
| NME1-NME2 | 4.235e-08 | 0.000736 |
| ZC3HAV1L | 8.09e-08 | 0.00141 |
| TACC3 | 8.413e-08 | 0.00146 |
| GAPDH | 1.722e-07 | 0.00299 |
| FAM128A | 2.392e-07 | 0.00415 |
Figure S11. Get High-res Image As an example, this figure shows the association of SRM to 'TOBACCOSMOKINGHISTORYINDICATOR'. P value = 1.12e-09 with ANOVA analysis.
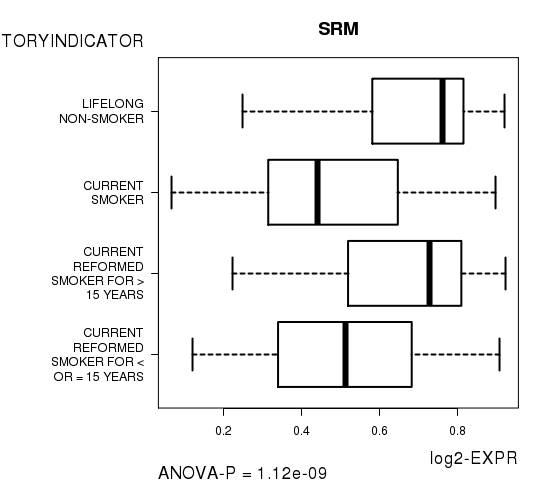
Table S24. Basic characteristics of clinical feature: 'YEAROFTOBACCOSMOKINGONSET'
| YEAROFTOBACCOSMOKINGONSET | Mean (SD) | 1964.9 (13) |
| Significant markers | N = 1 | |
| pos. correlated | 1 | |
| neg. correlated | 0 |
Table S25. Get Full Table List of one gene significantly correlated to 'YEAROFTOBACCOSMOKINGONSET' by Spearman correlation test
| SpearmanCorr | corrP | Q | |
|---|---|---|---|
| MYH14 | 0.3995 | 1.328e-06 | 0.0231 |
Figure S12. Get High-res Image As an example, this figure shows the association of MYH14 to 'YEAROFTOBACCOSMOKINGONSET'. P value = 1.33e-06 with Spearman correlation analysis. The straight line presents the best linear regression.
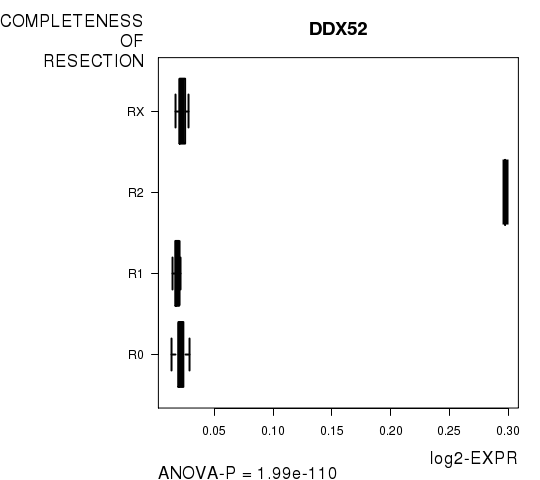
106 genes related to 'COMPLETENESS.OF.RESECTION'.
Table S26. Basic characteristics of clinical feature: 'COMPLETENESS.OF.RESECTION'
| COMPLETENESS.OF.RESECTION | Labels | N |
| R0 | 126 | |
| R1 | 7 | |
| R2 | 1 | |
| RX | 9 | |
| Significant markers | N = 106 |
Table S27. Get Full Table List of top 10 genes differentially expressed by 'COMPLETENESS.OF.RESECTION'
| ANOVA_P | Q | |
|---|---|---|
| DDX52 | 1.993e-110 | 3.46e-106 |
| MAN2A1 | 6.87e-85 | 1.19e-80 |
| CCDC53 | 7.787e-85 | 1.35e-80 |
| AFF1 | 1.276e-66 | 2.22e-62 |
| ZNF619 | 5.577e-63 | 9.69e-59 |
| ANKIB1 | 2.805e-61 | 4.87e-57 |
| CDK13 | 2.678e-47 | 4.65e-43 |
| CWC22 | 7.509e-46 | 1.3e-41 |
| SLC6A16 | 5.063e-43 | 8.79e-39 |
| HADHB | 5.778e-39 | 1e-34 |
Figure S13. Get High-res Image As an example, this figure shows the association of DDX52 to 'COMPLETENESS.OF.RESECTION'. P value = 1.99e-110 with ANOVA analysis.
-
Expresson data file = LUAD-TP.meth.for_correlation.filtered_data.txt
-
Clinical data file = LUAD-TP.clin.merged.picked.txt
-
Number of patients = 263
-
Number of genes = 17375
-
Number of clinical features = 14
For survival clinical features, Wald's test in univariate Cox regression analysis with proportional hazards model (Andersen and Gill 1982) was used to estimate the P values using the 'coxph' function in R. Kaplan-Meier survival curves were plot using the four quartile subgroups of patients based on expression levels
For continuous numerical clinical features, Spearman's rank correlation coefficients (Spearman 1904) and two-tailed P values were estimated using 'cor.test' function in R
For two-class clinical features, two-tailed Student's t test with unequal variance (Lehmann and Romano 2005) was applied to compare the log2-expression levels between the two clinical classes using 't.test' function in R
For multi-class clinical features (ordinal or nominal), one-way analysis of variance (Howell 2002) was applied to compare the log2-expression levels between different clinical classes using 'anova' function in R
For multiple hypothesis correction, Q value is the False Discovery Rate (FDR) analogue of the P value (Benjamini and Hochberg 1995), defined as the minimum FDR at which the test may be called significant. We used the 'Benjamini and Hochberg' method of 'p.adjust' function in R to convert P values into Q values.
This is an experimental feature. The full results of the analysis summarized in this report can be downloaded from the TCGA Data Coordination Center.