(primary solid tumor cohort)
This pipeline uses various statistical tests to identify mRNAs whose expression levels correlated to selected clinical features.
Testing the association between 18106 genes and 9 clinical features across 51 samples, statistically thresholded by Q value < 0.05, 4 clinical features related to at least one genes.
-
14 genes correlated to 'GENDER'.
-
DDX3Y|8653 , ZFY|7544 , XIST|7503 , EIF1AY|9086 , PRKY|5616 , ...
-
1 gene correlated to 'PATHOLOGY.T'.
-
RAMP1|10267
-
1 gene correlated to 'TUMOR.STAGE'.
-
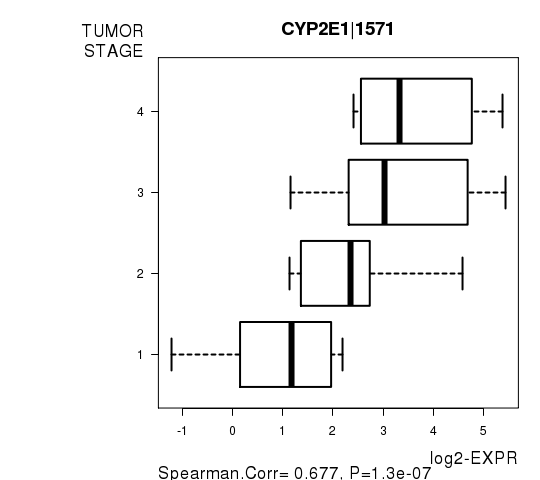
CYP2E1|1571
-
47 genes correlated to 'RADIATIONS.RADIATION.REGIMENINDICATION'.
-
GUSBL2|375513 , TTC15|51112 , GNG3|2785 , RMND5B|64777 , ZNF608|57507 , ...
-
No genes correlated to 'AGE', 'PATHOLOGY.N', 'PATHOLOGICSPREAD(M)', 'COMPLETENESS.OF.RESECTION', and 'NUMBER.OF.LYMPH.NODES'.
Complete statistical result table is provided in Supplement Table 1
Table 1. Get Full Table This table shows the clinical features, statistical methods used, and the number of genes that are significantly associated with each clinical feature at Q value < 0.05.
| Clinical feature | Statistical test | Significant genes | Associated with | Associated with | ||
|---|---|---|---|---|---|---|
| AGE | Spearman correlation test | N=0 | ||||
| GENDER | t test | N=14 | male | N=12 | female | N=2 |
| PATHOLOGY T | Spearman correlation test | N=1 | higher pT | N=1 | lower pT | N=0 |
| PATHOLOGY N | Spearman correlation test | N=0 | ||||
| PATHOLOGICSPREAD(M) | ANOVA test | N=0 | ||||
| TUMOR STAGE | Spearman correlation test | N=1 | higher stage | N=1 | lower stage | N=0 |
| RADIATIONS RADIATION REGIMENINDICATION | t test | N=47 | yes | N=15 | no | N=32 |
| COMPLETENESS OF RESECTION | ANOVA test | N=0 | ||||
| NUMBER OF LYMPH NODES | Spearman correlation test | N=0 |
Table S1. Basic characteristics of clinical feature: 'AGE'
| AGE | Mean (SD) | 63.33 (12) |
| Significant markers | N = 0 |
Table S2. Basic characteristics of clinical feature: 'GENDER'
| GENDER | Labels | N |
| FEMALE | 23 | |
| MALE | 28 | |
| Significant markers | N = 14 | |
| Higher in MALE | 12 | |
| Higher in FEMALE | 2 |
Table S3. Get Full Table List of top 10 genes differentially expressed by 'GENDER'
| T(pos if higher in 'MALE') | ttestP | Q | AUC | |
|---|---|---|---|---|
| DDX3Y|8653 | 31.09 | 9.353e-26 | 1.69e-21 | 1 |
| ZFY|7544 | 26.85 | 3.725e-25 | 6.74e-21 | 1 |
| XIST|7503 | -19.94 | 1.177e-24 | 2.13e-20 | 1 |
| EIF1AY|9086 | 24.06 | 7.095e-22 | 1.28e-17 | 1 |
| PRKY|5616 | 15.42 | 6.024e-20 | 1.09e-15 | 1 |
| USP9Y|8287 | 22.78 | 1.041e-18 | 1.88e-14 | 1 |
| CYORF15A|246126 | 19.49 | 1.387e-18 | 2.51e-14 | 1 |
| KDM5D|8284 | 27.37 | 5.082e-18 | 9.19e-14 | 1 |
| RPS4Y1|6192 | 17.83 | 9.967e-17 | 1.8e-12 | 1 |
| CYORF15B|84663 | 15.97 | 8.844e-15 | 1.6e-10 | 1 |
Figure S1. Get High-res Image As an example, this figure shows the association of DDX3Y|8653 to 'GENDER'. P value = 9.35e-26 with T-test analysis.
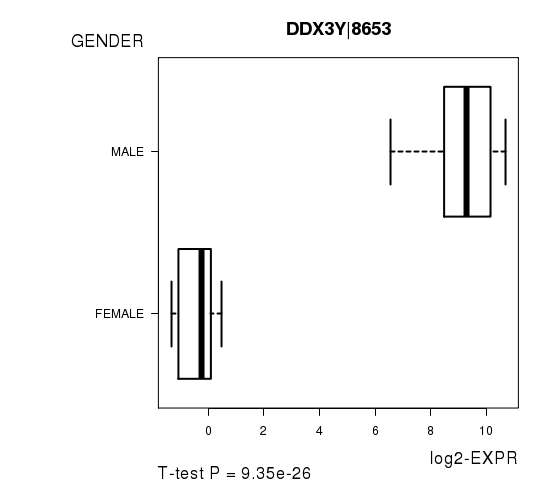
Table S4. Basic characteristics of clinical feature: 'PATHOLOGY.T'
| PATHOLOGY.T | Mean (SD) | 2.82 (0.74) |
| N | ||
| T1 | 3 | |
| T2 | 10 | |
| T3 | 31 | |
| T4 | 7 | |
| Significant markers | N = 1 | |
| pos. correlated | 1 | |
| neg. correlated | 0 |
Table S5. Get Full Table List of one gene significantly correlated to 'PATHOLOGY.T' by Spearman correlation test
| SpearmanCorr | corrP | Q | |
|---|---|---|---|
| RAMP1|10267 | 0.6077 | 2.252e-06 | 0.0408 |
Figure S2. Get High-res Image As an example, this figure shows the association of RAMP1|10267 to 'PATHOLOGY.T'. P value = 2.25e-06 with Spearman correlation analysis.
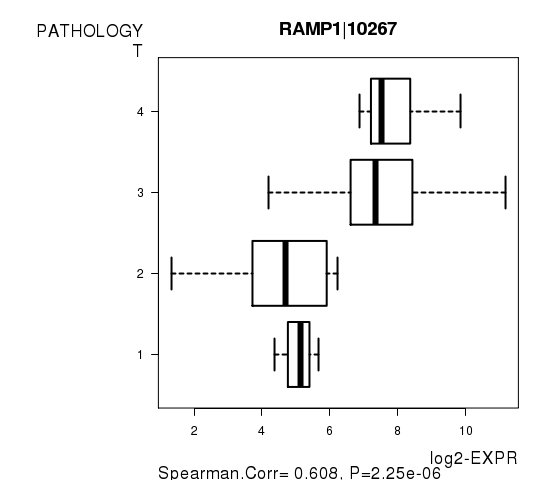
Table S6. Basic characteristics of clinical feature: 'PATHOLOGY.N'
| PATHOLOGY.N | Mean (SD) | 0.73 (0.86) |
| N | ||
| N0 | 26 | |
| N1 | 10 | |
| N2 | 13 | |
| Significant markers | N = 0 |
Table S7. Basic characteristics of clinical feature: 'PATHOLOGICSPREAD(M)'
| PATHOLOGICSPREAD(M) | Labels | N |
| M0 | 37 | |
| M1 | 4 | |
| M1A | 1 | |
| MX | 9 | |
| Significant markers | N = 0 |
Table S8. Basic characteristics of clinical feature: 'TUMOR.STAGE'
| TUMOR.STAGE | Mean (SD) | 2.4 (1) |
| N | ||
| Stage 1 | 11 | |
| Stage 2 | 14 | |
| Stage 3 | 16 | |
| Stage 4 | 7 | |
| Significant markers | N = 1 | |
| pos. correlated | 1 | |
| neg. correlated | 0 |
Table S9. Get Full Table List of one gene significantly correlated to 'TUMOR.STAGE' by Spearman correlation test
| SpearmanCorr | corrP | Q | |
|---|---|---|---|
| CYP2E1|1571 | 0.6766 | 1.303e-07 | 0.00236 |
Figure S3. Get High-res Image As an example, this figure shows the association of CYP2E1|1571 to 'TUMOR.STAGE'. P value = 1.3e-07 with Spearman correlation analysis.
47 genes related to 'RADIATIONS.RADIATION.REGIMENINDICATION'.
Table S10. Basic characteristics of clinical feature: 'RADIATIONS.RADIATION.REGIMENINDICATION'
| RADIATIONS.RADIATION.REGIMENINDICATION | Labels | N |
| NO | 3 | |
| YES | 48 | |
| Significant markers | N = 47 | |
| Higher in YES | 15 | |
| Higher in NO | 32 |
Table S11. Get Full Table List of top 10 genes differentially expressed by 'RADIATIONS.RADIATION.REGIMENINDICATION'
| T(pos if higher in 'YES') | ttestP | Q | AUC | |
|---|---|---|---|---|
| GUSBL2|375513 | -9.35 | 2.16e-12 | 3.57e-08 | 0.8819 |
| TTC15|51112 | 8.72 | 1.792e-11 | 2.96e-07 | 0.9028 |
| GNG3|2785 | -8.59 | 3.078e-11 | 5.09e-07 | 0.8958 |
| RMND5B|64777 | 8.67 | 1.021e-10 | 1.69e-06 | 0.9306 |
| ZNF608|57507 | 8.54 | 2.098e-10 | 3.47e-06 | 0.8958 |
| PAK1IP1|55003 | -7.92 | 5.672e-10 | 9.38e-06 | 0.9236 |
| DDX19A|55308 | -7.64 | 7.938e-10 | 1.31e-05 | 0.8681 |
| TRA2B|6434 | -7.76 | 2.197e-09 | 3.63e-05 | 0.8889 |
| WASH2P|375260 | -7.16 | 3.865e-09 | 6.39e-05 | 0.8542 |
| TMEM117|84216 | -7.15 | 4.477e-09 | 7.4e-05 | 0.8681 |
Figure S4. Get High-res Image As an example, this figure shows the association of GUSBL2|375513 to 'RADIATIONS.RADIATION.REGIMENINDICATION'. P value = 2.16e-12 with T-test analysis.
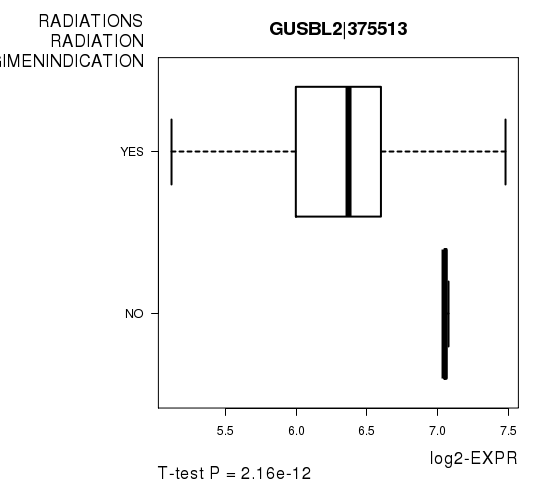
Table S12. Basic characteristics of clinical feature: 'COMPLETENESS.OF.RESECTION'
| COMPLETENESS.OF.RESECTION | Labels | N |
| R0 | 35 | |
| R1 | 1 | |
| RX | 3 | |
| Significant markers | N = 0 |
-
Expresson data file = READ-TP.uncv2.mRNAseq_RSEM_normalized_log2.txt
-
Clinical data file = READ-TP.clin.merged.picked.txt
-
Number of patients = 51
-
Number of genes = 18106
-
Number of clinical features = 9
For continuous numerical clinical features, Spearman's rank correlation coefficients (Spearman 1904) and two-tailed P values were estimated using 'cor.test' function in R
For two-class clinical features, two-tailed Student's t test with unequal variance (Lehmann and Romano 2005) was applied to compare the log2-expression levels between the two clinical classes using 't.test' function in R
For multi-class clinical features (ordinal or nominal), one-way analysis of variance (Howell 2002) was applied to compare the log2-expression levels between different clinical classes using 'anova' function in R
For multiple hypothesis correction, Q value is the False Discovery Rate (FDR) analogue of the P value (Benjamini and Hochberg 1995), defined as the minimum FDR at which the test may be called significant. We used the 'Benjamini and Hochberg' method of 'p.adjust' function in R to convert P values into Q values.
This is an experimental feature. The full results of the analysis summarized in this report can be downloaded from the TCGA Data Coordination Center.