(primary solid tumor cohort)
This pipeline uses various statistical tests to identify genes whose promoter methylation levels correlated to selected clinical features.
Testing the association between 17179 genes and 8 clinical features across 48 samples, statistically thresholded by Q value < 0.05, 3 clinical features related to at least one genes.
-
2 genes correlated to 'PATHOLOGY.N'.
-
GTF2H1 , ELAVL1
-
28 genes correlated to 'PATHOLOGICSPREAD(M)'.
-
C17ORF101 , ATXN7 , PRNP , SIX4 , KCNJ3 , ...
-
11 genes correlated to 'COMPLETENESS.OF.RESECTION'.
-
C1ORF59 , TNFRSF11B , CHID1 , TUBGCP5 , ALG12 , ...
-
No genes correlated to 'AGE', 'GENDER', 'PATHOLOGY.T', 'TUMOR.STAGE', and 'NUMBER.OF.LYMPH.NODES'.
Complete statistical result table is provided in Supplement Table 1
Table 1. Get Full Table This table shows the clinical features, statistical methods used, and the number of genes that are significantly associated with each clinical feature at Q value < 0.05.
| Clinical feature | Statistical test | Significant genes | Associated with | Associated with | ||
|---|---|---|---|---|---|---|
| AGE | Spearman correlation test | N=0 | ||||
| GENDER | t test | N=0 | ||||
| PATHOLOGY T | Spearman correlation test | N=0 | ||||
| PATHOLOGY N | Spearman correlation test | N=2 | higher pN | N=2 | lower pN | N=0 |
| PATHOLOGICSPREAD(M) | ANOVA test | N=28 | ||||
| TUMOR STAGE | Spearman correlation test | N=0 | ||||
| COMPLETENESS OF RESECTION | ANOVA test | N=11 | ||||
| NUMBER OF LYMPH NODES | Spearman correlation test | N=0 |
Table S1. Basic characteristics of clinical feature: 'AGE'
| AGE | Mean (SD) | 63 (12) |
| Significant markers | N = 0 |
Table S2. Basic characteristics of clinical feature: 'GENDER'
| GENDER | Labels | N |
| FEMALE | 21 | |
| MALE | 27 | |
| Significant markers | N = 0 |
Table S3. Basic characteristics of clinical feature: 'PATHOLOGY.T'
| PATHOLOGY.T | Mean (SD) | 2.83 (0.75) |
| N | ||
| T1 | 3 | |
| T2 | 9 | |
| T3 | 29 | |
| T4 | 7 | |
| Significant markers | N = 0 |
Table S4. Basic characteristics of clinical feature: 'PATHOLOGY.N'
| PATHOLOGY.N | Mean (SD) | 0.7 (0.84) |
| N | ||
| N0 | 25 | |
| N1 | 10 | |
| N2 | 11 | |
| Significant markers | N = 2 | |
| pos. correlated | 2 | |
| neg. correlated | 0 |
Table S5. Get Full Table List of 2 genes significantly correlated to 'PATHOLOGY.N' by Spearman correlation test
| SpearmanCorr | corrP | Q | |
|---|---|---|---|
| GTF2H1 | 0.6395 | 1.72e-06 | 0.0295 |
| ELAVL1 | 0.6318 | 2.489e-06 | 0.0428 |
Figure S1. Get High-res Image As an example, this figure shows the association of GTF2H1 to 'PATHOLOGY.N'. P value = 1.72e-06 with Spearman correlation analysis.
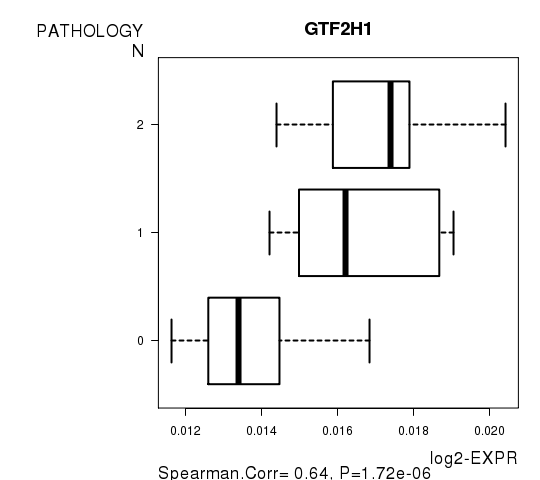
Table S6. Basic characteristics of clinical feature: 'PATHOLOGICSPREAD(M)'
| PATHOLOGICSPREAD(M) | Labels | N |
| M0 | 34 | |
| M1 | 4 | |
| M1A | 1 | |
| MX | 9 | |
| Significant markers | N = 28 |
Table S7. Get Full Table List of top 10 genes differentially expressed by 'PATHOLOGICSPREAD(M)'
| ANOVA_P | Q | |
|---|---|---|
| C17ORF101 | 6.707e-25 | 1.15e-20 |
| ATXN7 | 9.753e-23 | 1.68e-18 |
| PRNP | 4.572e-19 | 7.85e-15 |
| SIX4 | 8.941e-13 | 1.54e-08 |
| KCNJ3 | 3.005e-12 | 5.16e-08 |
| NUDT19 | 1.008e-11 | 1.73e-07 |
| DEAF1 | 1.409e-11 | 2.42e-07 |
| KLRC2 | 1.99e-11 | 3.42e-07 |
| ZNF501 | 2.916e-11 | 5.01e-07 |
| SLC25A22 | 1.816e-10 | 3.12e-06 |
Figure S2. Get High-res Image As an example, this figure shows the association of C17ORF101 to 'PATHOLOGICSPREAD(M)'. P value = 6.71e-25 with ANOVA analysis.
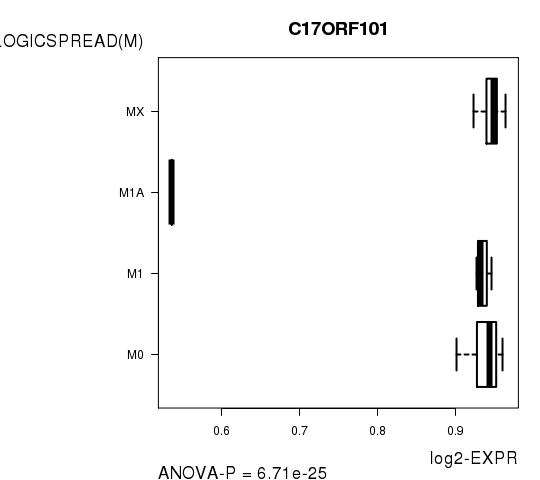
Table S8. Basic characteristics of clinical feature: 'TUMOR.STAGE'
| TUMOR.STAGE | Mean (SD) | 2.41 (1) |
| N | ||
| Stage 1 | 10 | |
| Stage 2 | 14 | |
| Stage 3 | 15 | |
| Stage 4 | 7 | |
| Significant markers | N = 0 |
Table S9. Basic characteristics of clinical feature: 'COMPLETENESS.OF.RESECTION'
| COMPLETENESS.OF.RESECTION | Labels | N |
| R0 | 32 | |
| R1 | 1 | |
| RX | 3 | |
| Significant markers | N = 11 |
Table S10. Get Full Table List of top 10 genes differentially expressed by 'COMPLETENESS.OF.RESECTION'
| ANOVA_P | Q | |
|---|---|---|
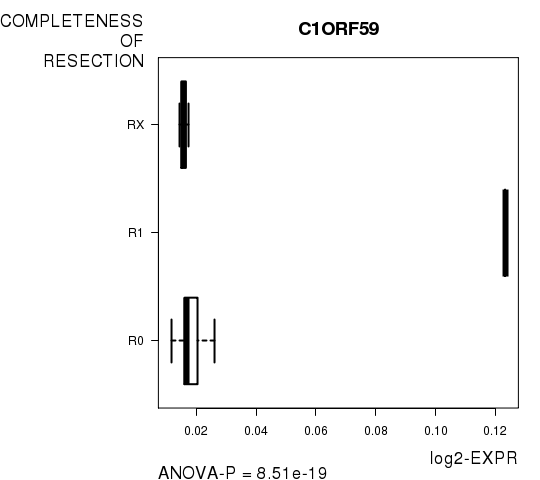
| C1ORF59 | 8.507e-19 | 1.46e-14 |
| TNFRSF11B | 8.3e-18 | 1.43e-13 |
| CHID1 | 2.148e-15 | 3.69e-11 |
| TUBGCP5 | 4.101e-13 | 7.04e-09 |
| ALG12 | 2.399e-10 | 4.12e-06 |
| NAPEPLD | 4.106e-10 | 7.05e-06 |
| SLC27A5 | 1.346e-09 | 2.31e-05 |
| LOC100132707 | 5.726e-08 | 0.000983 |
| GGCT | 1.612e-07 | 0.00277 |
| STIP1 | 7.426e-07 | 0.0128 |
Figure S3. Get High-res Image As an example, this figure shows the association of C1ORF59 to 'COMPLETENESS.OF.RESECTION'. P value = 8.51e-19 with ANOVA analysis.
-
Expresson data file = READ-TP.meth.for_correlation.filtered_data.txt
-
Clinical data file = READ-TP.clin.merged.picked.txt
-
Number of patients = 48
-
Number of genes = 17179
-
Number of clinical features = 8
For continuous numerical clinical features, Spearman's rank correlation coefficients (Spearman 1904) and two-tailed P values were estimated using 'cor.test' function in R
For two-class clinical features, two-tailed Student's t test with unequal variance (Lehmann and Romano 2005) was applied to compare the log2-expression levels between the two clinical classes using 't.test' function in R
For multi-class clinical features (ordinal or nominal), one-way analysis of variance (Howell 2002) was applied to compare the log2-expression levels between different clinical classes using 'anova' function in R
For multiple hypothesis correction, Q value is the False Discovery Rate (FDR) analogue of the P value (Benjamini and Hochberg 1995), defined as the minimum FDR at which the test may be called significant. We used the 'Benjamini and Hochberg' method of 'p.adjust' function in R to convert P values into Q values.
This is an experimental feature. The full results of the analysis summarized in this report can be downloaded from the TCGA Data Coordination Center.