(metastatic tumor cohort)
This pipeline uses various statistical tests to identify genes whose promoter methylation levels correlated to selected clinical features.
Testing the association between 17131 genes and 6 clinical features across 148 samples, statistically thresholded by Q value < 0.05, 4 clinical features related to at least one genes.
-
6 genes correlated to 'AGE'.
-
STL , PTX3 , ACTA2 , FAS , SDC2 , ...
-
645 genes correlated to 'DISTANT.METASTASIS'.
-
C10ORF88 , FAM186A , LOC728758 , ZNF585A , MDM1 , ...
-
43 genes correlated to 'LYMPH.NODE.METASTASIS'.
-
CRYM , NGLY1 , C6ORF162 , LIMK2 , AP2S1 , ...
-
2 genes correlated to 'NEOPLASM.DISEASESTAGE'.
-
ELP2 , SLC39A6
-
No genes correlated to 'Time to Death', and 'GENDER'.
Complete statistical result table is provided in Supplement Table 1
Table 1. Get Full Table This table shows the clinical features, statistical methods used, and the number of genes that are significantly associated with each clinical feature at Q value < 0.05.
| Clinical feature | Statistical test | Significant genes | Associated with | Associated with | ||
|---|---|---|---|---|---|---|
| Time to Death | Cox regression test | N=0 | ||||
| AGE | Spearman correlation test | N=6 | older | N=6 | younger | N=0 |
| GENDER | t test | N=0 | ||||
| DISTANT METASTASIS | ANOVA test | N=645 | ||||
| LYMPH NODE METASTASIS | ANOVA test | N=43 | ||||
| NEOPLASM DISEASESTAGE | ANOVA test | N=2 |
Table S1. Basic characteristics of clinical feature: 'Time to Death'
| Time to Death | Duration (Months) | 0.2-346 (median=47.5) |
| censored | N = 73 | |
| death | N = 71 | |
| Significant markers | N = 0 |
Table S2. Basic characteristics of clinical feature: 'AGE'
| AGE | Mean (SD) | 55.97 (16) |
| Significant markers | N = 6 | |
| pos. correlated | 6 | |
| neg. correlated | 0 |
Table S3. Get Full Table List of 6 genes significantly correlated to 'AGE' by Spearman correlation test
| SpearmanCorr | corrP | Q | |
|---|---|---|---|
| STL | 0.4129 | 2.228e-07 | 0.00382 |
| PTX3 | 0.4063 | 3.606e-07 | 0.00618 |
| ACTA2 | 0.4016 | 5.05e-07 | 0.00865 |
| FAS | 0.4016 | 5.05e-07 | 0.00865 |
| SDC2 | 0.381 | 2.089e-06 | 0.0358 |
| CTAGE5 | 0.376 | 2.913e-06 | 0.0499 |
Figure S1. Get High-res Image As an example, this figure shows the association of STL to 'AGE'. P value = 2.23e-07 with Spearman correlation analysis. The straight line presents the best linear regression.
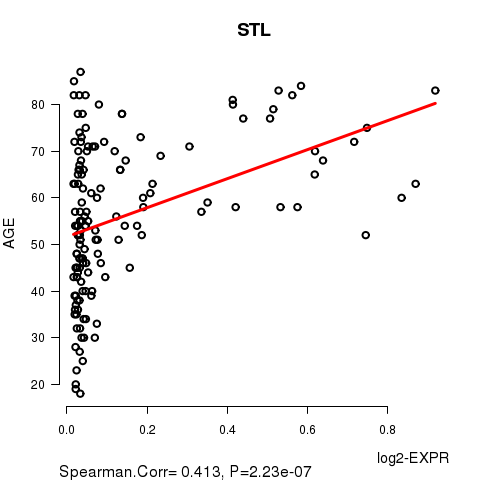
Table S4. Basic characteristics of clinical feature: 'GENDER'
| GENDER | Labels | N |
| FEMALE | 55 | |
| MALE | 93 | |
| Significant markers | N = 0 |
Table S5. Basic characteristics of clinical feature: 'DISTANT.METASTASIS'
| DISTANT.METASTASIS | Labels | N |
| M0 | 124 | |
| M1 | 2 | |
| M1A | 2 | |
| M1B | 1 | |
| M1C | 2 | |
| Significant markers | N = 645 |
Table S6. Get Full Table List of top 10 genes differentially expressed by 'DISTANT.METASTASIS'
| ANOVA_P | Q | |
|---|---|---|
| C10ORF88 | 5.499e-70 | 9.42e-66 |
| FAM186A | 1.28e-60 | 2.19e-56 |
| LOC728758 | 3.019e-56 | 5.17e-52 |
| ZNF585A | 2.898e-55 | 4.96e-51 |
| MDM1 | 2.313e-54 | 3.96e-50 |
| HSPA9 | 9.269e-49 | 1.59e-44 |
| PIGX | 2.996e-48 | 5.13e-44 |
| ZNF654 | 6.353e-47 | 1.09e-42 |
| EFNB3 | 1.979e-46 | 3.39e-42 |
| LOC646471 | 1.505e-45 | 2.58e-41 |
Figure S2. Get High-res Image As an example, this figure shows the association of C10ORF88 to 'DISTANT.METASTASIS'. P value = 5.5e-70 with ANOVA analysis.
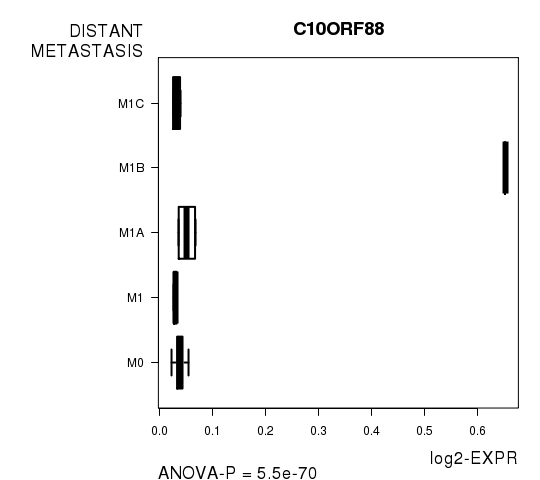
Table S7. Basic characteristics of clinical feature: 'LYMPH.NODE.METASTASIS'
| LYMPH.NODE.METASTASIS | Labels | N |
| N0 | 81 | |
| N1 | 2 | |
| N1A | 6 | |
| N1B | 12 | |
| N2 | 1 | |
| N2A | 3 | |
| N2B | 9 | |
| N2C | 5 | |
| N3 | 11 | |
| NX | 2 | |
| Significant markers | N = 43 |
Table S8. Get Full Table List of top 10 genes differentially expressed by 'LYMPH.NODE.METASTASIS'
| ANOVA_P | Q | |
|---|---|---|
| CRYM | 2.634e-74 | 4.51e-70 |
| NGLY1 | 6.917e-58 | 1.18e-53 |
| C6ORF162 | 6.44e-35 | 1.1e-30 |
| LIMK2 | 3.641e-31 | 6.24e-27 |
| AP2S1 | 2.571e-26 | 4.4e-22 |
| C17ORF63 | 5.478e-23 | 9.38e-19 |
| CSRP2BP | 1.176e-16 | 2.01e-12 |
| GPR44 | 3.897e-14 | 6.67e-10 |
| ASAP3 | 4.317e-12 | 7.39e-08 |
| ABI1 | 5.54e-12 | 9.49e-08 |
Figure S3. Get High-res Image As an example, this figure shows the association of CRYM to 'LYMPH.NODE.METASTASIS'. P value = 2.63e-74 with ANOVA analysis.
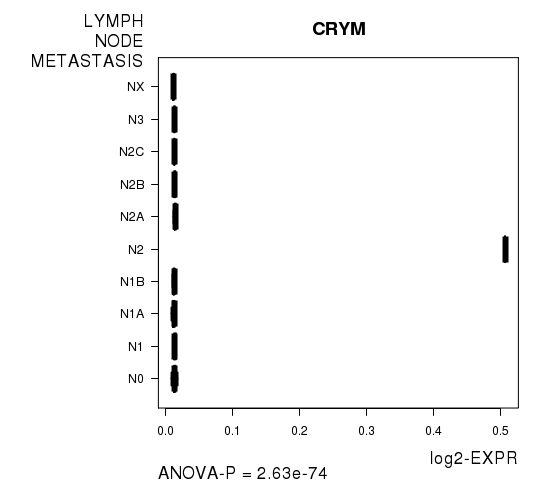
Table S9. Basic characteristics of clinical feature: 'NEOPLASM.DISEASESTAGE'
| NEOPLASM.DISEASESTAGE | Labels | N |
| STAGE I | 17 | |
| STAGE IA | 9 | |
| STAGE IB | 11 | |
| STAGE II | 18 | |
| STAGE IIA | 7 | |
| STAGE IIB | 8 | |
| STAGE IIC | 6 | |
| STAGE III | 7 | |
| STAGE IIIA | 5 | |
| STAGE IIIB | 15 | |
| STAGE IIIC | 17 | |
| STAGE IV | 5 | |
| Significant markers | N = 2 |
Table S10. Get Full Table List of 2 genes differentially expressed by 'NEOPLASM.DISEASESTAGE'
| ANOVA_P | Q | |
|---|---|---|
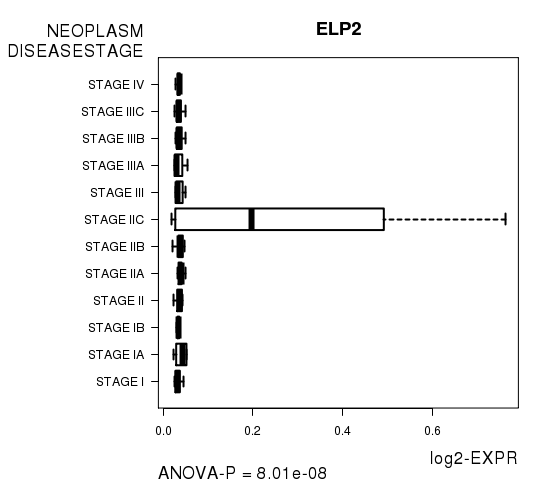
| ELP2 | 8.006e-08 | 0.00137 |
| SLC39A6 | 8.006e-08 | 0.00137 |
Figure S4. Get High-res Image As an example, this figure shows the association of ELP2 to 'NEOPLASM.DISEASESTAGE'. P value = 8.01e-08 with ANOVA analysis.
-
Expresson data file = SKCM-TM.meth.for_correlation.filtered_data.txt
-
Clinical data file = SKCM-TM.clin.merged.picked.txt
-
Number of patients = 148
-
Number of genes = 17131
-
Number of clinical features = 6
For survival clinical features, Wald's test in univariate Cox regression analysis with proportional hazards model (Andersen and Gill 1982) was used to estimate the P values using the 'coxph' function in R. Kaplan-Meier survival curves were plot using the four quartile subgroups of patients based on expression levels
For continuous numerical clinical features, Spearman's rank correlation coefficients (Spearman 1904) and two-tailed P values were estimated using 'cor.test' function in R
For two-class clinical features, two-tailed Student's t test with unequal variance (Lehmann and Romano 2005) was applied to compare the log2-expression levels between the two clinical classes using 't.test' function in R
For multi-class clinical features (ordinal or nominal), one-way analysis of variance (Howell 2002) was applied to compare the log2-expression levels between different clinical classes using 'anova' function in R
For multiple hypothesis correction, Q value is the False Discovery Rate (FDR) analogue of the P value (Benjamini and Hochberg 1995), defined as the minimum FDR at which the test may be called significant. We used the 'Benjamini and Hochberg' method of 'p.adjust' function in R to convert P values into Q values.
This is an experimental feature. The full results of the analysis summarized in this report can be downloaded from the TCGA Data Coordination Center.