(primary solid tumor cohort)
This pipeline computes the correlation between significant arm-level copy number variations (cnvs) and selected clinical features.
Testing the association between copy number variation 74 arm-level results and 11 clinical features across 177 patients, 5 significant findings detected with Q value < 0.25.
-
2p gain cnv correlated to 'NUMBER.OF.LYMPH.NODES'.
-
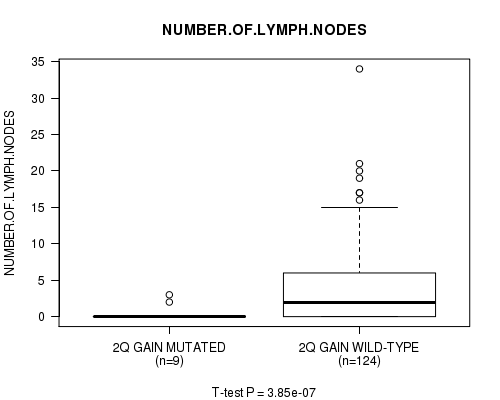
2q gain cnv correlated to 'NUMBER.OF.LYMPH.NODES'.
-
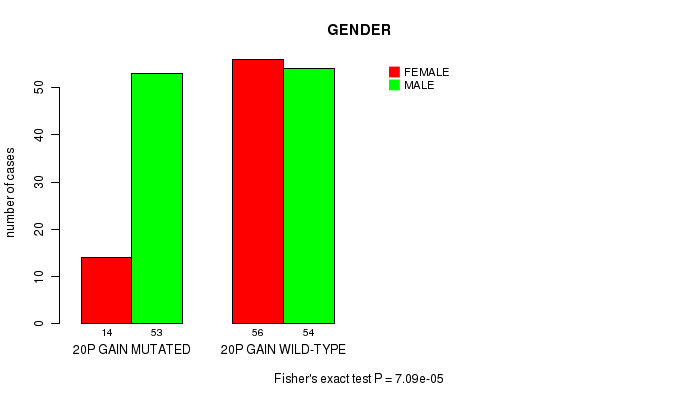
20p gain cnv correlated to 'GENDER'.
-
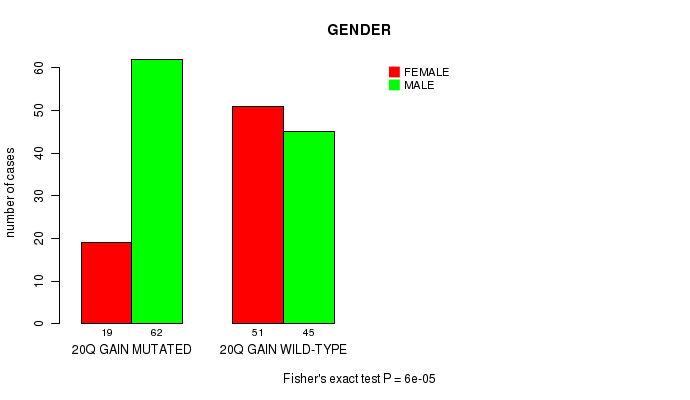
20q gain cnv correlated to 'GENDER'.
-
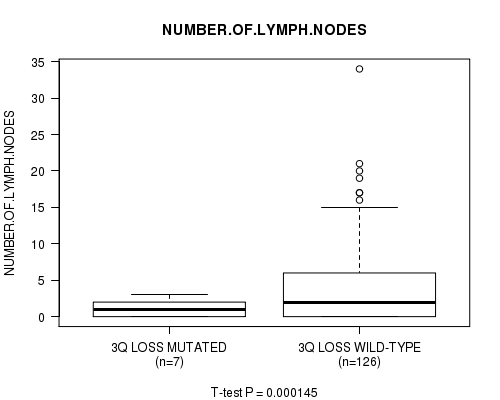
3q loss cnv correlated to 'NUMBER.OF.LYMPH.NODES'.
Table 1. Get Full Table Overview of the association between significant copy number variation of 74 arm-level results and 11 clinical features. Shown in the table are P values (Q values). Thresholded by Q value < 0.25, 5 significant findings detected.
|
Clinical Features |
Time to Death |
AGE | GENDER |
HISTOLOGICAL TYPE |
PATHOLOGY T |
PATHOLOGY N |
PATHOLOGICSPREAD(M) |
TUMOR STAGE |
RADIATIONS RADIATION REGIMENINDICATION |
COMPLETENESS OF RESECTION |
NUMBER OF LYMPH NODES |
||
| nCNV (%) | nWild-Type | logrank test | t-test | Fisher's exact test | Chi-square test | Fisher's exact test | Fisher's exact test | Fisher's exact test | Fisher's exact test | Fisher's exact test | Fisher's exact test | t-test | |
| 2p gain | 11 (6%) | 166 |
0.695 (1.00) |
0.288 (1.00) |
0.53 (1.00) |
0.537 (1.00) |
0.278 (1.00) |
0.171 (1.00) |
1 (1.00) |
0.0193 (1.00) |
1 (1.00) |
0.511 (1.00) |
3.37e-05 (0.0269) |
| 2q gain | 13 (7%) | 164 |
0.344 (1.00) |
0.648 (1.00) |
0.57 (1.00) |
0.508 (1.00) |
0.491 (1.00) |
0.108 (1.00) |
1 (1.00) |
0.0555 (1.00) |
1 (1.00) |
0.928 (1.00) |
3.85e-07 (0.000308) |
| 20p gain | 67 (38%) | 110 |
0.181 (1.00) |
0.143 (1.00) |
7.09e-05 (0.0564) |
0.756 (1.00) |
0.026 (1.00) |
0.424 (1.00) |
0.117 (1.00) |
0.12 (1.00) |
0.651 (1.00) |
0.204 (1.00) |
0.528 (1.00) |
| 20q gain | 81 (46%) | 96 |
0.147 (1.00) |
0.0703 (1.00) |
6e-05 (0.0478) |
0.339 (1.00) |
0.000551 (0.437) |
0.251 (1.00) |
0.0306 (1.00) |
0.105 (1.00) |
1 (1.00) |
0.508 (1.00) |
0.129 (1.00) |
| 3q loss | 9 (5%) | 168 |
0.633 (1.00) |
0.865 (1.00) |
0.0897 (1.00) |
0.968 (1.00) |
0.826 (1.00) |
0.749 (1.00) |
0.484 (1.00) |
0.81 (1.00) |
1 (1.00) |
0.626 (1.00) |
0.000145 (0.115) |
| 1p gain | 9 (5%) | 168 |
0.686 (1.00) |
0.292 (1.00) |
0.486 (1.00) |
0.407 (1.00) |
0.66 (1.00) |
0.822 (1.00) |
0.484 (1.00) |
0.75 (1.00) |
1 (1.00) |
0.136 (1.00) |
0.625 (1.00) |
| 1q gain | 24 (14%) | 153 |
0.975 (1.00) |
0.155 (1.00) |
0.177 (1.00) |
0.398 (1.00) |
0.536 (1.00) |
0.252 (1.00) |
0.103 (1.00) |
0.773 (1.00) |
0.137 (1.00) |
0.611 (1.00) |
0.229 (1.00) |
| 3p gain | 3 (2%) | 174 |
0.719 (1.00) |
1 (1.00) |
0.811 (1.00) |
1 (1.00) |
0.863 (1.00) |
1 (1.00) |
0.493 (1.00) |
1 (1.00) |
0.17 (1.00) |
0.901 (1.00) |
|
| 3q gain | 14 (8%) | 163 |
0.373 (1.00) |
0.0236 (1.00) |
0.0094 (1.00) |
0.568 (1.00) |
1 (1.00) |
0.577 (1.00) |
0.54 (1.00) |
1 (1.00) |
1 (1.00) |
0.732 (1.00) |
0.453 (1.00) |
| 4p gain | 3 (2%) | 174 |
0.119 (1.00) |
0.279 (1.00) |
0.0374 (1.00) |
0.863 (1.00) |
1 (1.00) |
0.22 (1.00) |
1 (1.00) |
0.239 (1.00) |
|||
| 5p gain | 26 (15%) | 151 |
0.973 (1.00) |
0.517 (1.00) |
0.194 (1.00) |
0.409 (1.00) |
0.826 (1.00) |
0.872 (1.00) |
0.211 (1.00) |
0.0172 (1.00) |
0.157 (1.00) |
0.233 (1.00) |
0.33 (1.00) |
| 5q gain | 7 (4%) | 170 |
0.145 (1.00) |
0.691 (1.00) |
0.247 (1.00) |
0.104 (1.00) |
0.844 (1.00) |
0.671 (1.00) |
1 (1.00) |
0.5 (1.00) |
1 (1.00) |
0.832 (1.00) |
0.00991 (1.00) |
| 6p gain | 13 (7%) | 164 |
0.755 (1.00) |
0.866 (1.00) |
0.769 (1.00) |
0.64 (1.00) |
0.586 (1.00) |
0.599 (1.00) |
1 (1.00) |
0.343 (1.00) |
0.32 (1.00) |
0.426 (1.00) |
0.111 (1.00) |
| 6q gain | 13 (7%) | 164 |
0.755 (1.00) |
0.866 (1.00) |
0.769 (1.00) |
0.64 (1.00) |
0.586 (1.00) |
0.599 (1.00) |
1 (1.00) |
0.343 (1.00) |
0.32 (1.00) |
0.426 (1.00) |
0.111 (1.00) |
| 7p gain | 53 (30%) | 124 |
0.454 (1.00) |
0.0135 (1.00) |
0.131 (1.00) |
0.365 (1.00) |
0.357 (1.00) |
0.382 (1.00) |
0.62 (1.00) |
0.187 (1.00) |
0.636 (1.00) |
0.763 (1.00) |
0.984 (1.00) |
| 7q gain | 48 (27%) | 129 |
0.645 (1.00) |
0.00698 (1.00) |
0.388 (1.00) |
0.367 (1.00) |
0.165 (1.00) |
0.459 (1.00) |
0.201 (1.00) |
0.169 (1.00) |
1 (1.00) |
0.786 (1.00) |
0.711 (1.00) |
| 8p gain | 49 (28%) | 128 |
0.681 (1.00) |
0.00825 (1.00) |
0.232 (1.00) |
0.491 (1.00) |
0.0291 (1.00) |
0.67 (1.00) |
0.125 (1.00) |
0.472 (1.00) |
0.131 (1.00) |
0.0783 (1.00) |
0.51 (1.00) |
| 8q gain | 69 (39%) | 108 |
0.514 (1.00) |
0.00427 (1.00) |
0.432 (1.00) |
0.416 (1.00) |
0.00382 (1.00) |
0.209 (1.00) |
0.32 (1.00) |
0.222 (1.00) |
0.379 (1.00) |
0.0656 (1.00) |
0.314 (1.00) |
| 9p gain | 14 (8%) | 163 |
0.513 (1.00) |
0.977 (1.00) |
0.41 (1.00) |
0.7 (1.00) |
0.113 (1.00) |
0.358 (1.00) |
0.634 (1.00) |
0.0285 (1.00) |
0.341 (1.00) |
0.591 (1.00) |
0.224 (1.00) |
| 9q gain | 18 (10%) | 159 |
0.53 (1.00) |
0.664 (1.00) |
0.8 (1.00) |
0.895 (1.00) |
0.29 (1.00) |
0.355 (1.00) |
0.548 (1.00) |
0.252 (1.00) |
0.419 (1.00) |
0.765 (1.00) |
0.742 (1.00) |
| 10p gain | 26 (15%) | 151 |
0.891 (1.00) |
0.211 (1.00) |
0.667 (1.00) |
0.128 (1.00) |
0.624 (1.00) |
0.56 (1.00) |
0.588 (1.00) |
0.0768 (1.00) |
1 (1.00) |
0.281 (1.00) |
0.685 (1.00) |
| 10q gain | 14 (8%) | 163 |
0.754 (1.00) |
0.454 (1.00) |
1 (1.00) |
0.342 (1.00) |
0.841 (1.00) |
0.735 (1.00) |
0.742 (1.00) |
0.716 (1.00) |
1 (1.00) |
0.518 (1.00) |
0.838 (1.00) |
| 11p gain | 5 (3%) | 172 |
0.54 (1.00) |
0.792 (1.00) |
0.649 (1.00) |
0.54 (1.00) |
0.389 (1.00) |
0.529 (1.00) |
1 (1.00) |
0.75 (1.00) |
1 (1.00) |
0.218 (1.00) |
0.599 (1.00) |
| 11q gain | 9 (5%) | 168 |
0.193 (1.00) |
0.85 (1.00) |
1 (1.00) |
0.701 (1.00) |
0.826 (1.00) |
0.749 (1.00) |
0.802 (1.00) |
0.867 (1.00) |
1 (1.00) |
0.567 (1.00) |
0.0791 (1.00) |
| 12p gain | 17 (10%) | 160 |
0.257 (1.00) |
0.493 (1.00) |
0.0677 (1.00) |
0.996 (1.00) |
0.465 (1.00) |
0.539 (1.00) |
0.255 (1.00) |
0.715 (1.00) |
1 (1.00) |
0.35 (1.00) |
0.204 (1.00) |
| 12q gain | 12 (7%) | 165 |
0.673 (1.00) |
0.0312 (1.00) |
0.369 (1.00) |
0.285 (1.00) |
0.718 (1.00) |
0.0866 (1.00) |
1 (1.00) |
0.885 (1.00) |
0.299 (1.00) |
0.324 (1.00) |
0.795 (1.00) |
| 13q gain | 34 (19%) | 143 |
0.586 (1.00) |
0.784 (1.00) |
0.436 (1.00) |
0.346 (1.00) |
0.838 (1.00) |
0.326 (1.00) |
0.45 (1.00) |
0.866 (1.00) |
1 (1.00) |
0.86 (1.00) |
0.326 (1.00) |
| 15q gain | 7 (4%) | 170 |
0.151 (1.00) |
0.4 (1.00) |
0.0431 (1.00) |
0.944 (1.00) |
1 (1.00) |
0.0623 (1.00) |
0.747 (1.00) |
0.616 (1.00) |
1 (1.00) |
0.804 (1.00) |
0.561 (1.00) |
| 16p gain | 12 (7%) | 165 |
0.572 (1.00) |
0.801 (1.00) |
0.766 (1.00) |
0.563 (1.00) |
0.546 (1.00) |
0.0924 (1.00) |
0.15 (1.00) |
0.00573 (1.00) |
0.299 (1.00) |
1 (1.00) |
0.237 (1.00) |
| 16q gain | 8 (5%) | 169 |
0.685 (1.00) |
0.998 (1.00) |
1 (1.00) |
0.836 (1.00) |
0.132 (1.00) |
0.471 (1.00) |
0.193 (1.00) |
0.00909 (1.00) |
1 (1.00) |
0.86 (1.00) |
0.796 (1.00) |
| 17p gain | 5 (3%) | 172 |
0.00798 (1.00) |
0.724 (1.00) |
1 (1.00) |
0.577 (1.00) |
0.878 (1.00) |
0.0131 (1.00) |
0.012 (1.00) |
0.0775 (1.00) |
1 (1.00) |
0.00862 (1.00) |
0.179 (1.00) |
| 17q gain | 10 (6%) | 167 |
0.276 (1.00) |
0.416 (1.00) |
0.742 (1.00) |
0.969 (1.00) |
0.761 (1.00) |
0.234 (1.00) |
0.0231 (1.00) |
0.198 (1.00) |
1 (1.00) |
0.0502 (1.00) |
0.325 (1.00) |
| 18p gain | 16 (9%) | 161 |
0.657 (1.00) |
0.262 (1.00) |
1 (1.00) |
0.842 (1.00) |
0.869 (1.00) |
0.0618 (1.00) |
0.507 (1.00) |
0.31 (1.00) |
0.381 (1.00) |
0.364 (1.00) |
0.261 (1.00) |
| 18q gain | 9 (5%) | 168 |
0.635 (1.00) |
0.95 (1.00) |
0.741 (1.00) |
0.369 (1.00) |
0.75 (1.00) |
0.308 (1.00) |
0.0607 (1.00) |
0.709 (1.00) |
1 (1.00) |
0.123 (1.00) |
0.603 (1.00) |
| 19p gain | 10 (6%) | 167 |
0.943 (1.00) |
0.274 (1.00) |
0.015 (1.00) |
0.645 (1.00) |
0.725 (1.00) |
0.0501 (1.00) |
0.0231 (1.00) |
0.0341 (1.00) |
1 (1.00) |
0.00116 (0.916) |
0.033 (1.00) |
| 19q gain | 17 (10%) | 160 |
0.257 (1.00) |
0.108 (1.00) |
0.117 (1.00) |
0.603 (1.00) |
0.43 (1.00) |
0.106 (1.00) |
0.129 (1.00) |
0.0124 (1.00) |
0.4 (1.00) |
0.0101 (1.00) |
0.0375 (1.00) |
| 22q gain | 3 (2%) | 174 |
0.745 (1.00) |
0.348 (1.00) |
1 (1.00) |
0.955 (1.00) |
0.805 (1.00) |
0.443 (1.00) |
1 (1.00) |
0.22 (1.00) |
1 (1.00) |
1 (1.00) |
|
| 1p loss | 8 (5%) | 169 |
0.121 (1.00) |
0.522 (1.00) |
0.267 (1.00) |
0.889 (1.00) |
0.3 (1.00) |
0.4 (1.00) |
0.000648 (0.513) |
0.00324 (1.00) |
1 (1.00) |
0.00292 (1.00) |
0.374 (1.00) |
| 1q loss | 3 (2%) | 174 |
0.585 (1.00) |
0.098 (1.00) |
0.563 (1.00) |
0.245 (1.00) |
1 (1.00) |
0.605 (1.00) |
0.0421 (1.00) |
0.177 (1.00) |
1 (1.00) |
0.357 (1.00) |
0.535 (1.00) |
| 2q loss | 3 (2%) | 174 |
0.563 (1.00) |
0.805 (1.00) |
0.384 (1.00) |
0.231 (1.00) |
0.313 (1.00) |
0.0828 (1.00) |
|||||
| 3p loss | 15 (8%) | 162 |
0.78 (1.00) |
0.586 (1.00) |
0.41 (1.00) |
0.993 (1.00) |
1 (1.00) |
0.243 (1.00) |
0.563 (1.00) |
0.749 (1.00) |
1 (1.00) |
0.317 (1.00) |
0.0332 (1.00) |
| 4p loss | 27 (15%) | 150 |
0.341 (1.00) |
0.33 (1.00) |
0.527 (1.00) |
0.13 (1.00) |
0.0247 (1.00) |
0.739 (1.00) |
0.412 (1.00) |
0.0475 (1.00) |
0.167 (1.00) |
0.144 (1.00) |
0.108 (1.00) |
| 4q loss | 25 (14%) | 152 |
0.741 (1.00) |
0.95 (1.00) |
1 (1.00) |
0.0343 (1.00) |
0.0998 (1.00) |
0.857 (1.00) |
1 (1.00) |
0.232 (1.00) |
0.147 (1.00) |
0.238 (1.00) |
0.416 (1.00) |
| 5p loss | 8 (5%) | 169 |
0.68 (1.00) |
0.646 (1.00) |
0.482 (1.00) |
0.345 (1.00) |
0.844 (1.00) |
0.0423 (1.00) |
0.579 (1.00) |
0.242 (1.00) |
1 (1.00) |
1 (1.00) |
0.815 (1.00) |
| 5q loss | 17 (10%) | 160 |
0.324 (1.00) |
0.248 (1.00) |
0.0677 (1.00) |
0.0305 (1.00) |
0.105 (1.00) |
0.809 (1.00) |
0.295 (1.00) |
0.205 (1.00) |
0.4 (1.00) |
0.384 (1.00) |
0.884 (1.00) |
| 6p loss | 10 (6%) | 167 |
0.701 (1.00) |
0.13 (1.00) |
1 (1.00) |
0.0497 (1.00) |
0.309 (1.00) |
0.0221 (1.00) |
0.819 (1.00) |
0.128 (1.00) |
1 (1.00) |
0.907 (1.00) |
0.612 (1.00) |
| 6q loss | 15 (8%) | 162 |
0.897 (1.00) |
0.327 (1.00) |
0.41 (1.00) |
0.312 (1.00) |
0.361 (1.00) |
0.134 (1.00) |
0.563 (1.00) |
0.00931 (1.00) |
1 (1.00) |
0.764 (1.00) |
0.81 (1.00) |
| 7p loss | 3 (2%) | 174 |
0.224 (1.00) |
0.236 (1.00) |
0.279 (1.00) |
0.663 (1.00) |
0.0936 (1.00) |
0.0847 (1.00) |
1 (1.00) |
0.366 (1.00) |
1 (1.00) |
1 (1.00) |
|
| 7q loss | 6 (3%) | 171 |
0.217 (1.00) |
0.253 (1.00) |
0.0825 (1.00) |
0.278 (1.00) |
0.291 (1.00) |
0.237 (1.00) |
0.454 (1.00) |
1 (1.00) |
1 (1.00) |
0.804 (1.00) |
0.395 (1.00) |
| 8p loss | 15 (8%) | 162 |
0.799 (1.00) |
0.128 (1.00) |
0.166 (1.00) |
0.0897 (1.00) |
0.346 (1.00) |
0.366 (1.00) |
0.158 (1.00) |
0.682 (1.00) |
1 (1.00) |
1 (1.00) |
0.00621 (1.00) |
| 8q loss | 3 (2%) | 174 |
0.412 (1.00) |
1 (1.00) |
0.00187 (1.00) |
1 (1.00) |
1 (1.00) |
0.17 (1.00) |
|||||
| 9p loss | 30 (17%) | 147 |
0.189 (1.00) |
0.629 (1.00) |
0.307 (1.00) |
0.449 (1.00) |
0.0543 (1.00) |
0.706 (1.00) |
0.675 (1.00) |
0.928 (1.00) |
1 (1.00) |
0.86 (1.00) |
0.285 (1.00) |
| 9q loss | 13 (7%) | 164 |
0.847 (1.00) |
0.163 (1.00) |
0.251 (1.00) |
0.615 (1.00) |
0.248 (1.00) |
0.346 (1.00) |
0.0678 (1.00) |
0.653 (1.00) |
0.32 (1.00) |
0.649 (1.00) |
0.214 (1.00) |
| 10p loss | 12 (7%) | 165 |
0.211 (1.00) |
0.376 (1.00) |
0.128 (1.00) |
0.0417 (1.00) |
0.203 (1.00) |
0.814 (1.00) |
0.7 (1.00) |
0.521 (1.00) |
0.0377 (1.00) |
0.642 (1.00) |
0.619 (1.00) |
| 10q loss | 10 (6%) | 167 |
0.264 (1.00) |
0.426 (1.00) |
0.742 (1.00) |
0.0113 (1.00) |
0.19 (1.00) |
0.965 (1.00) |
0.528 (1.00) |
0.307 (1.00) |
0.255 (1.00) |
1 (1.00) |
0.834 (1.00) |
| 11p loss | 13 (7%) | 164 |
0.0844 (1.00) |
0.299 (1.00) |
0.769 (1.00) |
0.367 (1.00) |
0.129 (1.00) |
0.644 (1.00) |
0.053 (1.00) |
0.555 (1.00) |
1 (1.00) |
0.0102 (1.00) |
0.327 (1.00) |
| 11q loss | 11 (6%) | 166 |
0.0607 (1.00) |
0.594 (1.00) |
0.204 (1.00) |
0.599 (1.00) |
0.259 (1.00) |
0.67 (1.00) |
0.451 (1.00) |
0.91 (1.00) |
1 (1.00) |
0.17 (1.00) |
0.353 (1.00) |
| 12p loss | 12 (7%) | 165 |
0.158 (1.00) |
0.953 (1.00) |
0.369 (1.00) |
0.179 (1.00) |
0.0587 (1.00) |
0.000932 (0.737) |
0.7 (1.00) |
0.00831 (1.00) |
1 (1.00) |
0.518 (1.00) |
0.769 (1.00) |
| 12q loss | 8 (5%) | 169 |
0.36 (1.00) |
0.467 (1.00) |
0.149 (1.00) |
0.448 (1.00) |
0.147 (1.00) |
0.0372 (1.00) |
0.579 (1.00) |
0.231 (1.00) |
1 (1.00) |
0.832 (1.00) |
0.863 (1.00) |
| 13q loss | 5 (3%) | 172 |
0.699 (1.00) |
0.647 (1.00) |
1 (1.00) |
0.546 (1.00) |
0.606 (1.00) |
0.588 (1.00) |
0.211 (1.00) |
0.457 (1.00) |
0.135 (1.00) |
0.0778 (1.00) |
0.542 (1.00) |
| 14q loss | 14 (8%) | 163 |
0.679 (1.00) |
0.147 (1.00) |
1 (1.00) |
0.944 (1.00) |
0.924 (1.00) |
0.291 (1.00) |
0.268 (1.00) |
0.613 (1.00) |
1 (1.00) |
0.931 (1.00) |
0.459 (1.00) |
| 15q loss | 12 (7%) | 165 |
0.823 (1.00) |
0.488 (1.00) |
1 (1.00) |
0.0295 (1.00) |
0.106 (1.00) |
0.343 (1.00) |
1 (1.00) |
0.309 (1.00) |
0.0377 (1.00) |
0.642 (1.00) |
0.501 (1.00) |
| 16p loss | 11 (6%) | 166 |
0.605 (1.00) |
0.211 (1.00) |
0.204 (1.00) |
0.252 (1.00) |
0.239 (1.00) |
0.801 (1.00) |
1 (1.00) |
0.867 (1.00) |
0.277 (1.00) |
0.0914 (1.00) |
0.399 (1.00) |
| 16q loss | 15 (8%) | 162 |
0.532 (1.00) |
0.583 (1.00) |
0.41 (1.00) |
0.572 (1.00) |
0.234 (1.00) |
0.545 (1.00) |
1 (1.00) |
0.955 (1.00) |
0.361 (1.00) |
0.179 (1.00) |
0.194 (1.00) |
| 17p loss | 32 (18%) | 145 |
0.904 (1.00) |
0.81 (1.00) |
0.324 (1.00) |
0.00783 (1.00) |
0.0765 (1.00) |
0.657 (1.00) |
0.638 (1.00) |
0.257 (1.00) |
0.0418 (1.00) |
0.15 (1.00) |
0.314 (1.00) |
| 17q loss | 11 (6%) | 166 |
0.49 (1.00) |
0.837 (1.00) |
0.755 (1.00) |
0.0564 (1.00) |
1 (1.00) |
0.753 (1.00) |
0.116 (1.00) |
0.685 (1.00) |
0.277 (1.00) |
0.407 (1.00) |
0.0775 (1.00) |
| 18p loss | 14 (8%) | 163 |
0.424 (1.00) |
0.818 (1.00) |
1 (1.00) |
0.984 (1.00) |
0.464 (1.00) |
0.515 (1.00) |
0.742 (1.00) |
0.129 (1.00) |
1 (1.00) |
0.169 (1.00) |
0.374 (1.00) |
| 18q loss | 27 (15%) | 150 |
0.26 (1.00) |
0.431 (1.00) |
0.527 (1.00) |
0.917 (1.00) |
0.408 (1.00) |
0.503 (1.00) |
0.293 (1.00) |
0.254 (1.00) |
1 (1.00) |
0.0141 (1.00) |
0.256 (1.00) |
| 19p loss | 18 (10%) | 159 |
0.83 (1.00) |
0.721 (1.00) |
0.133 (1.00) |
0.324 (1.00) |
0.577 (1.00) |
0.342 (1.00) |
1 (1.00) |
0.672 (1.00) |
1 (1.00) |
0.485 (1.00) |
0.322 (1.00) |
| 19q loss | 13 (7%) | 164 |
0.844 (1.00) |
0.11 (1.00) |
0.251 (1.00) |
0.269 (1.00) |
0.319 (1.00) |
0.252 (1.00) |
0.721 (1.00) |
0.209 (1.00) |
1 (1.00) |
0.485 (1.00) |
0.43 (1.00) |
| 20p loss | 5 (3%) | 172 |
0.295 (1.00) |
0.79 (1.00) |
0.0806 (1.00) |
0.747 (1.00) |
0.217 (1.00) |
0.272 (1.00) |
0.124 (1.00) |
0.0571 (1.00) |
0.135 (1.00) |
0.00548 (1.00) |
0.528 (1.00) |
| 21q loss | 30 (17%) | 147 |
0.495 (1.00) |
0.225 (1.00) |
1 (1.00) |
0.84 (1.00) |
0.547 (1.00) |
0.701 (1.00) |
0.794 (1.00) |
0.569 (1.00) |
1 (1.00) |
0.129 (1.00) |
0.266 (1.00) |
| 22q loss | 25 (14%) | 152 |
0.299 (1.00) |
0.925 (1.00) |
0.826 (1.00) |
0.175 (1.00) |
0.592 (1.00) |
0.815 (1.00) |
0.146 (1.00) |
0.708 (1.00) |
0.537 (1.00) |
0.382 (1.00) |
0.359 (1.00) |
| Xq loss | 6 (3%) | 171 |
0.141 (1.00) |
0.388 (1.00) |
1 (1.00) |
0.796 (1.00) |
0.195 (1.00) |
0.272 (1.00) |
1 (1.00) |
0.225 (1.00) |
0.16 (1.00) |
0.0117 (1.00) |
0.749 (1.00) |
P value = 3.37e-05 (t-test), Q value = 0.027
Table S1. Gene #3: '2p gain mutation analysis' versus Clinical Feature #11: 'NUMBER.OF.LYMPH.NODES'
| nPatients | Mean (Std.Dev) | |
|---|---|---|
| ALL | 133 | 4.0 (5.7) |
| 2P GAIN MUTATED | 7 | 0.7 (1.3) |
| 2P GAIN WILD-TYPE | 126 | 4.2 (5.8) |
Figure S1. Get High-res Image Gene #3: '2p gain mutation analysis' versus Clinical Feature #11: 'NUMBER.OF.LYMPH.NODES'

P value = 3.85e-07 (t-test), Q value = 0.00031
Table S2. Gene #4: '2q gain mutation analysis' versus Clinical Feature #11: 'NUMBER.OF.LYMPH.NODES'
| nPatients | Mean (Std.Dev) | |
|---|---|---|
| ALL | 133 | 4.0 (5.7) |
| 2Q GAIN MUTATED | 9 | 0.6 (1.1) |
| 2Q GAIN WILD-TYPE | 124 | 4.3 (5.8) |
Figure S2. Get High-res Image Gene #4: '2q gain mutation analysis' versus Clinical Feature #11: 'NUMBER.OF.LYMPH.NODES'
P value = 7.09e-05 (Fisher's exact test), Q value = 0.056
Table S3. Gene #34: '20p gain mutation analysis' versus Clinical Feature #3: 'GENDER'
| nPatients | FEMALE | MALE |
|---|---|---|
| ALL | 70 | 107 |
| 20P GAIN MUTATED | 14 | 53 |
| 20P GAIN WILD-TYPE | 56 | 54 |
Figure S3. Get High-res Image Gene #34: '20p gain mutation analysis' versus Clinical Feature #3: 'GENDER'
P value = 6e-05 (Fisher's exact test), Q value = 0.048
Table S4. Gene #35: '20q gain mutation analysis' versus Clinical Feature #3: 'GENDER'
| nPatients | FEMALE | MALE |
|---|---|---|
| ALL | 70 | 107 |
| 20Q GAIN MUTATED | 19 | 62 |
| 20Q GAIN WILD-TYPE | 51 | 45 |
Figure S4. Get High-res Image Gene #35: '20q gain mutation analysis' versus Clinical Feature #3: 'GENDER'
P value = 0.000145 (t-test), Q value = 0.12
Table S5. Gene #41: '3q loss mutation analysis' versus Clinical Feature #11: 'NUMBER.OF.LYMPH.NODES'
| nPatients | Mean (Std.Dev) | |
|---|---|---|
| ALL | 133 | 4.0 (5.7) |
| 3Q LOSS MUTATED | 7 | 1.1 (1.2) |
| 3Q LOSS WILD-TYPE | 126 | 4.2 (5.8) |
Figure S5. Get High-res Image Gene #41: '3q loss mutation analysis' versus Clinical Feature #11: 'NUMBER.OF.LYMPH.NODES'
-
Mutation data file = broad_values_by_arm.mutsig.cluster.txt
-
Clinical data file = STAD-TP.clin.merged.picked.txt
-
Number of patients = 177
-
Number of significantly arm-level cnvs = 74
-
Number of selected clinical features = 11
-
Exclude genes that fewer than K tumors have mutations, K = 3
For survival clinical features, the Kaplan-Meier survival curves of tumors with and without gene mutations were plotted and the statistical significance P values were estimated by logrank test (Bland and Altman 2004) using the 'survdiff' function in R
For continuous numerical clinical features, two-tailed Student's t test with unequal variance (Lehmann and Romano 2005) was applied to compare the clinical values between tumors with and without gene mutations using 't.test' function in R
For binary or multi-class clinical features (nominal or ordinal), two-tailed Fisher's exact tests (Fisher 1922) were used to estimate the P values using the 'fisher.test' function in R
For multi-class clinical features (nominal or ordinal), Chi-square tests (Greenwood and Nikulin 1996) were used to estimate the P values using the 'chisq.test' function in R
For multiple hypothesis correction, Q value is the False Discovery Rate (FDR) analogue of the P value (Benjamini and Hochberg 1995), defined as the minimum FDR at which the test may be called significant. We used the 'Benjamini and Hochberg' method of 'p.adjust' function in R to convert P values into Q values.
This is an experimental feature. The full results of the analysis summarized in this report can be downloaded from the TCGA Data Coordination Center.