(primary solid tumor cohort)
This pipeline computes the correlation between cancer subtypes identified by different molecular patterns and selected clinical features.
Testing the association between subtypes identified by 6 different clustering approaches and 11 clinical features across 178 patients, 4 significant findings detected with P value < 0.05 and Q value < 0.25.
-
3 subtypes identified in current cancer cohort by 'Copy Number Ratio CNMF subtypes'. These subtypes do not correlate to any clinical features.
-
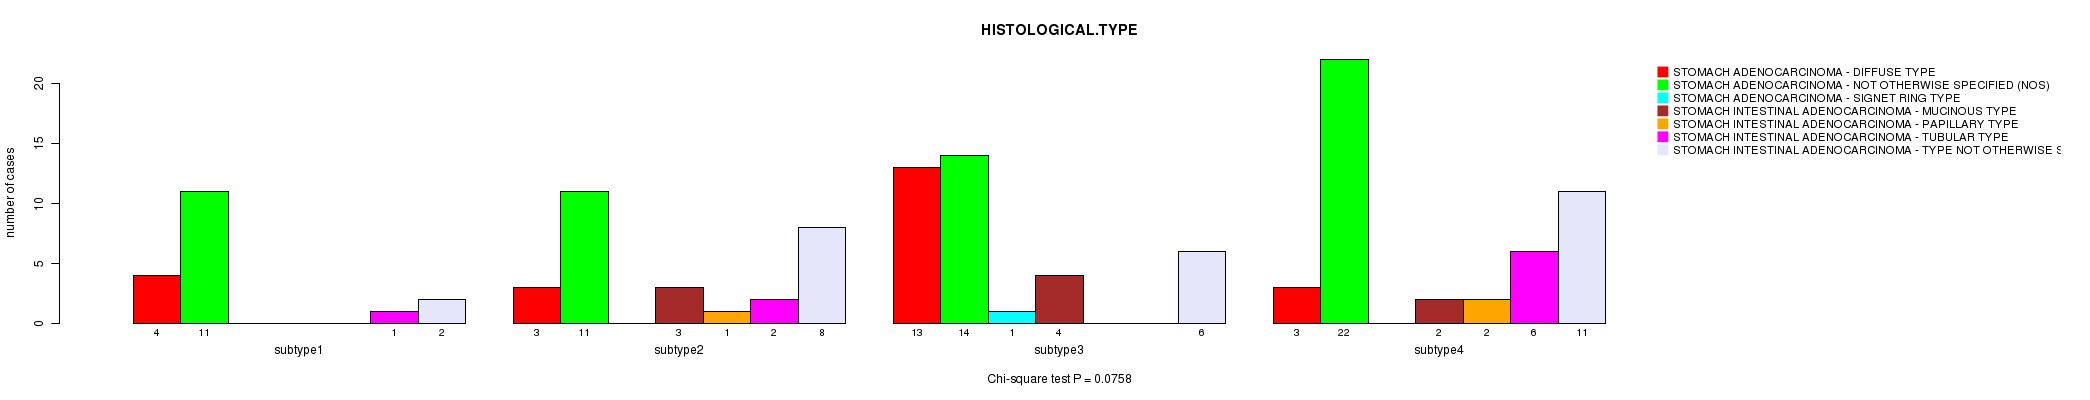
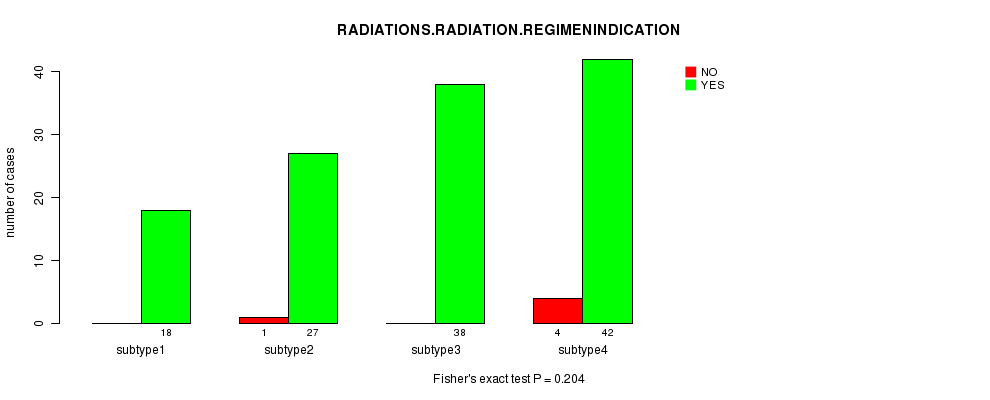
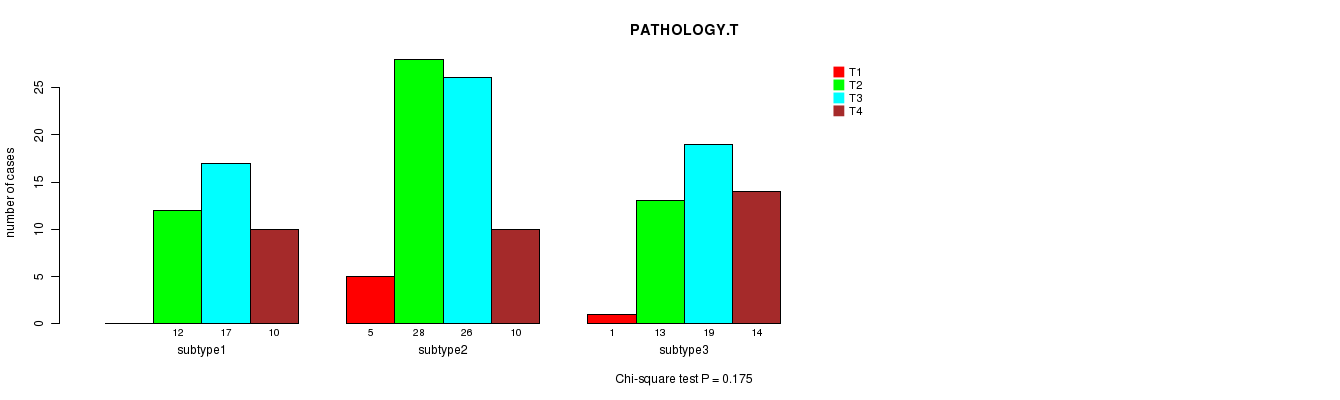
4 subtypes identified in current cancer cohort by 'METHLYATION CNMF'. These subtypes correlate to 'AGE' and 'PATHOLOGY.T'.
-
CNMF clustering analysis on sequencing-based mRNA expression data identified 2 subtypes that do not correlate to any clinical features.
-
Consensus hierarchical clustering analysis on sequencing-based mRNA expression data identified 3 subtypes that correlate to 'TUMOR.STAGE'.
-
3 subtypes identified in current cancer cohort by 'MIRSEQ CNMF'. These subtypes do not correlate to any clinical features.
-
3 subtypes identified in current cancer cohort by 'MIRSEQ CHIERARCHICAL'. These subtypes correlate to 'HISTOLOGICAL.TYPE'.
Table 1. Get Full Table Overview of the association between subtypes identified by 6 different clustering approaches and 11 clinical features. Shown in the table are P values (Q values). Thresholded by P value < 0.05 and Q value < 0.25, 4 significant findings detected.
|
Clinical Features |
Statistical Tests |
Copy Number Ratio CNMF subtypes |
METHLYATION CNMF |
RNAseq CNMF subtypes |
RNAseq cHierClus subtypes |
MIRSEQ CNMF |
MIRSEQ CHIERARCHICAL |
| Time to Death | logrank test |
0.32 (1.00) |
0.843 (1.00) |
0.667 (1.00) |
0.8 (1.00) |
0.41 (1.00) |
0.76 (1.00) |
| AGE | ANOVA |
0.0304 (1.00) |
0.00201 (0.126) |
0.143 (1.00) |
0.447 (1.00) |
0.0549 (1.00) |
0.799 (1.00) |
| GENDER | Fisher's exact test |
0.0189 (1.00) |
0.935 (1.00) |
0.547 (1.00) |
0.917 (1.00) |
0.492 (1.00) |
0.709 (1.00) |
| HISTOLOGICAL TYPE | Chi-square test |
0.0266 (1.00) |
0.0758 (1.00) |
0.0766 (1.00) |
0.407 (1.00) |
0.00806 (0.476) |
0.00123 (0.0787) |
| PATHOLOGY T | Chi-square test |
0.00436 (0.262) |
0.00279 (0.173) |
0.242 (1.00) |
0.425 (1.00) |
0.302 (1.00) |
0.175 (1.00) |
| PATHOLOGY N | Chi-square test |
0.303 (1.00) |
0.689 (1.00) |
0.174 (1.00) |
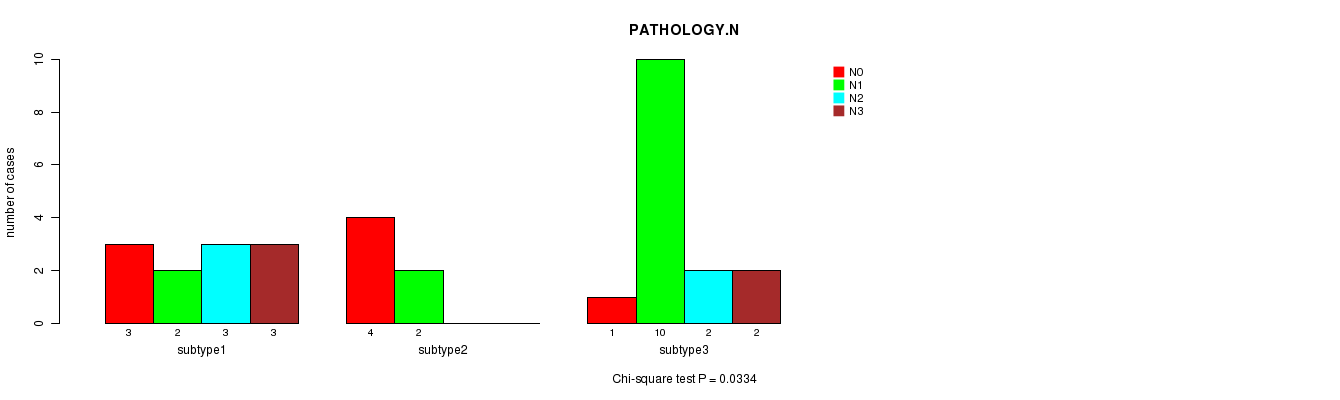
0.0334 (1.00) |
0.14 (1.00) |
0.878 (1.00) |
| PATHOLOGICSPREAD(M) | Chi-square test |
0.309 (1.00) |
0.517 (1.00) |
0.327 (1.00) |
0.474 (1.00) |
0.0922 (1.00) |
0.795 (1.00) |
| TUMOR STAGE | Chi-square test |
0.439 (1.00) |
0.0543 (1.00) |
0.0535 (1.00) |
0.00304 (0.186) |
0.697 (1.00) |
0.636 (1.00) |
| RADIATIONS RADIATION REGIMENINDICATION | Fisher's exact test |
0.226 (1.00) |
0.204 (1.00) |
0.0152 (0.866) |
0.524 (1.00) |
||
| COMPLETENESS OF RESECTION | Chi-square test |
0.673 (1.00) |
0.462 (1.00) |
0.468 (1.00) |
0.61 (1.00) |
0.00856 (0.496) |
0.356 (1.00) |
| NUMBER OF LYMPH NODES | ANOVA |
0.0568 (1.00) |
0.708 (1.00) |
0.931 (1.00) |
0.563 (1.00) |
0.0334 (1.00) |
0.902 (1.00) |
Table S1. Get Full Table Description of clustering approach #1: 'Copy Number Ratio CNMF subtypes'
| Cluster Labels | 1 | 2 | 3 |
|---|---|---|---|
| Number of samples | 88 | 71 | 18 |
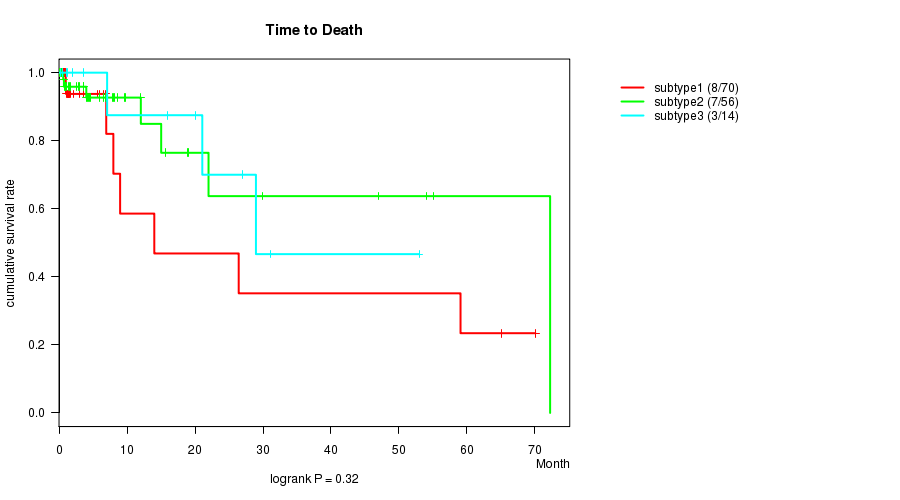
P value = 0.32 (logrank test), Q value = 1
Table S2. Clustering Approach #1: 'Copy Number Ratio CNMF subtypes' versus Clinical Feature #1: 'Time to Death'
| nPatients | nDeath | Duration Range (Median), Month | |
|---|---|---|---|
| ALL | 140 | 18 | 0.1 - 72.2 (1.2) |
| subtype1 | 70 | 8 | 0.1 - 70.1 (0.9) |
| subtype2 | 56 | 7 | 0.1 - 72.2 (4.0) |
| subtype3 | 14 | 3 | 0.2 - 53.0 (11.5) |
Figure S1. Get High-res Image Clustering Approach #1: 'Copy Number Ratio CNMF subtypes' versus Clinical Feature #1: 'Time to Death'
P value = 0.0304 (ANOVA), Q value = 1
Table S3. Clustering Approach #1: 'Copy Number Ratio CNMF subtypes' versus Clinical Feature #2: 'AGE'
| nPatients | Mean (Std.Dev) | |
|---|---|---|
| ALL | 170 | 66.9 (11.1) |
| subtype1 | 87 | 65.3 (12.1) |
| subtype2 | 67 | 67.4 (10.0) |
| subtype3 | 16 | 73.1 (7.1) |
Figure S2. Get High-res Image Clustering Approach #1: 'Copy Number Ratio CNMF subtypes' versus Clinical Feature #2: 'AGE'

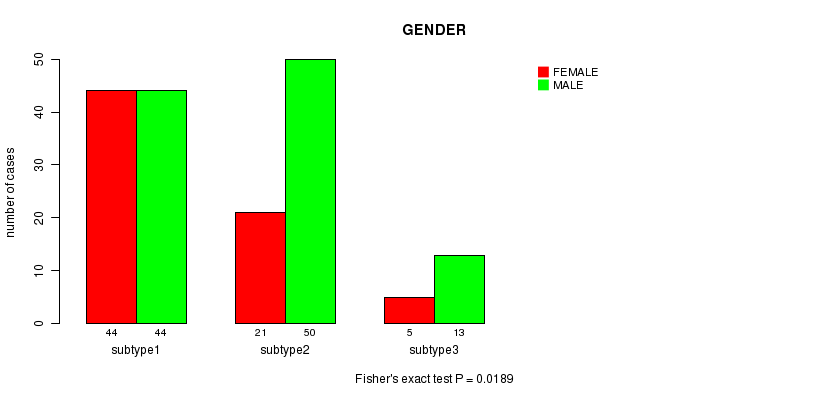
P value = 0.0189 (Fisher's exact test), Q value = 1
Table S4. Clustering Approach #1: 'Copy Number Ratio CNMF subtypes' versus Clinical Feature #3: 'GENDER'
| nPatients | FEMALE | MALE |
|---|---|---|
| ALL | 70 | 107 |
| subtype1 | 44 | 44 |
| subtype2 | 21 | 50 |
| subtype3 | 5 | 13 |
Figure S3. Get High-res Image Clustering Approach #1: 'Copy Number Ratio CNMF subtypes' versus Clinical Feature #3: 'GENDER'
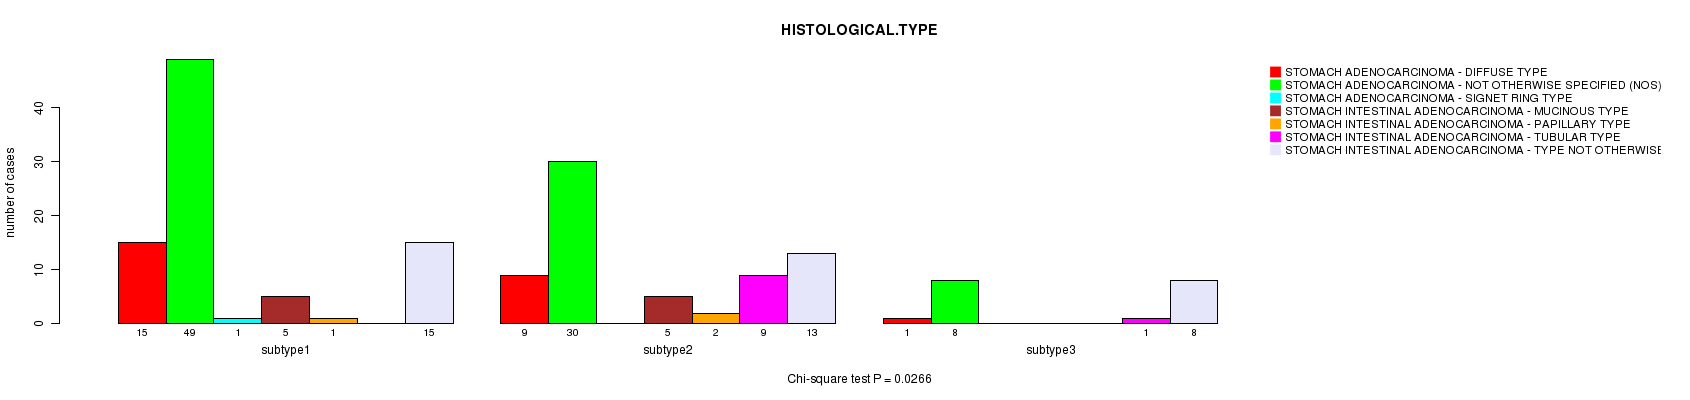
P value = 0.0266 (Chi-square test), Q value = 1
Table S5. Clustering Approach #1: 'Copy Number Ratio CNMF subtypes' versus Clinical Feature #4: 'HISTOLOGICAL.TYPE'
| nPatients | STOMACH ADENOCARCINOMA - DIFFUSE TYPE | STOMACH ADENOCARCINOMA - NOT OTHERWISE SPECIFIED (NOS) | STOMACH ADENOCARCINOMA - SIGNET RING TYPE | STOMACH INTESTINAL ADENOCARCINOMA - MUCINOUS TYPE | STOMACH INTESTINAL ADENOCARCINOMA - PAPILLARY TYPE | STOMACH INTESTINAL ADENOCARCINOMA - TUBULAR TYPE | STOMACH INTESTINAL ADENOCARCINOMA - TYPE NOT OTHERWISE SPECIFIED (NOS) |
|---|---|---|---|---|---|---|---|
| ALL | 25 | 87 | 1 | 10 | 3 | 10 | 36 |
| subtype1 | 15 | 49 | 1 | 5 | 1 | 0 | 15 |
| subtype2 | 9 | 30 | 0 | 5 | 2 | 9 | 13 |
| subtype3 | 1 | 8 | 0 | 0 | 0 | 1 | 8 |
Figure S4. Get High-res Image Clustering Approach #1: 'Copy Number Ratio CNMF subtypes' versus Clinical Feature #4: 'HISTOLOGICAL.TYPE'
P value = 0.00436 (Chi-square test), Q value = 0.26
Table S6. Clustering Approach #1: 'Copy Number Ratio CNMF subtypes' versus Clinical Feature #5: 'PATHOLOGY.T'
| nPatients | T1 | T2 | T3 | T4 |
|---|---|---|---|---|
| ALL | 6 | 54 | 64 | 43 |
| subtype1 | 3 | 18 | 31 | 31 |
| subtype2 | 1 | 30 | 26 | 10 |
| subtype3 | 2 | 6 | 7 | 2 |
Figure S5. Get High-res Image Clustering Approach #1: 'Copy Number Ratio CNMF subtypes' versus Clinical Feature #5: 'PATHOLOGY.T'

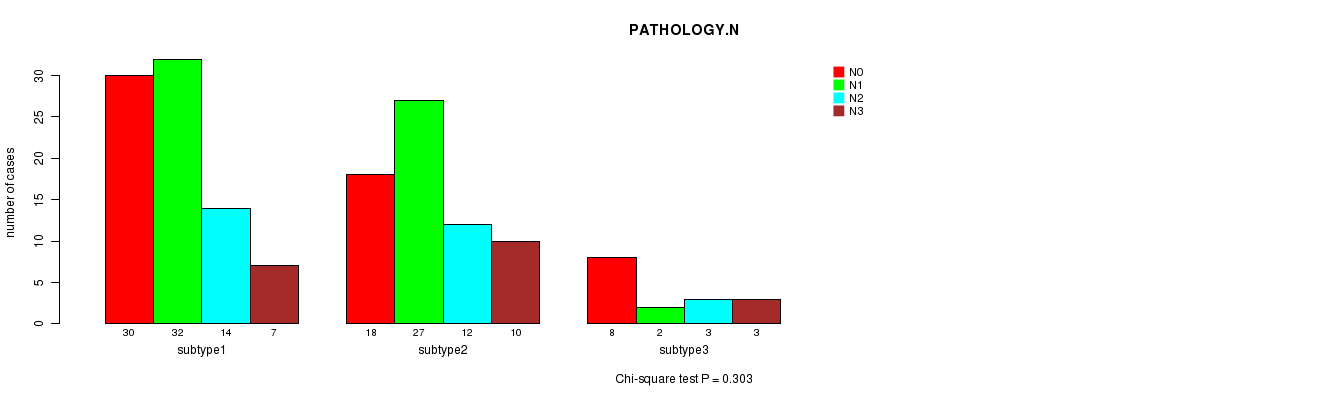
P value = 0.303 (Chi-square test), Q value = 1
Table S7. Clustering Approach #1: 'Copy Number Ratio CNMF subtypes' versus Clinical Feature #6: 'PATHOLOGY.N'
| nPatients | N0 | N1 | N2 | N3 |
|---|---|---|---|---|
| ALL | 56 | 61 | 29 | 20 |
| subtype1 | 30 | 32 | 14 | 7 |
| subtype2 | 18 | 27 | 12 | 10 |
| subtype3 | 8 | 2 | 3 | 3 |
Figure S6. Get High-res Image Clustering Approach #1: 'Copy Number Ratio CNMF subtypes' versus Clinical Feature #6: 'PATHOLOGY.N'
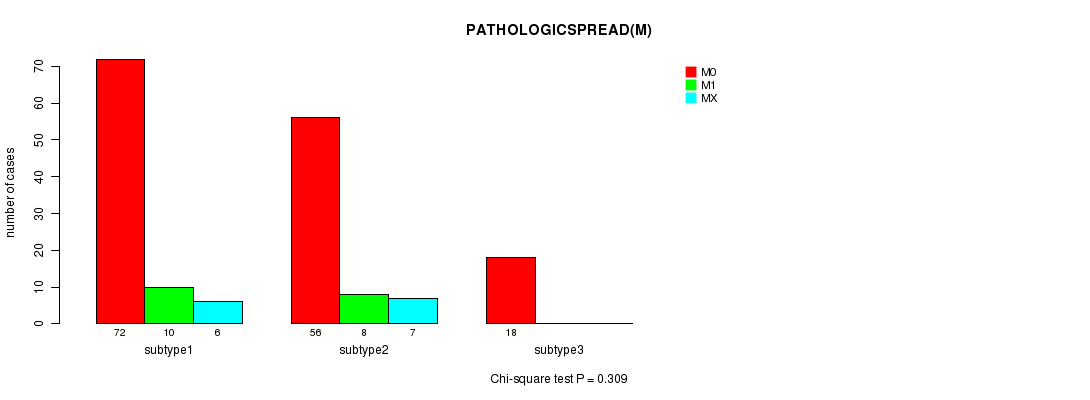
P value = 0.309 (Chi-square test), Q value = 1
Table S8. Clustering Approach #1: 'Copy Number Ratio CNMF subtypes' versus Clinical Feature #7: 'PATHOLOGICSPREAD(M)'
| nPatients | M0 | M1 | MX |
|---|---|---|---|
| ALL | 146 | 18 | 13 |
| subtype1 | 72 | 10 | 6 |
| subtype2 | 56 | 8 | 7 |
| subtype3 | 18 | 0 | 0 |
Figure S7. Get High-res Image Clustering Approach #1: 'Copy Number Ratio CNMF subtypes' versus Clinical Feature #7: 'PATHOLOGICSPREAD(M)'
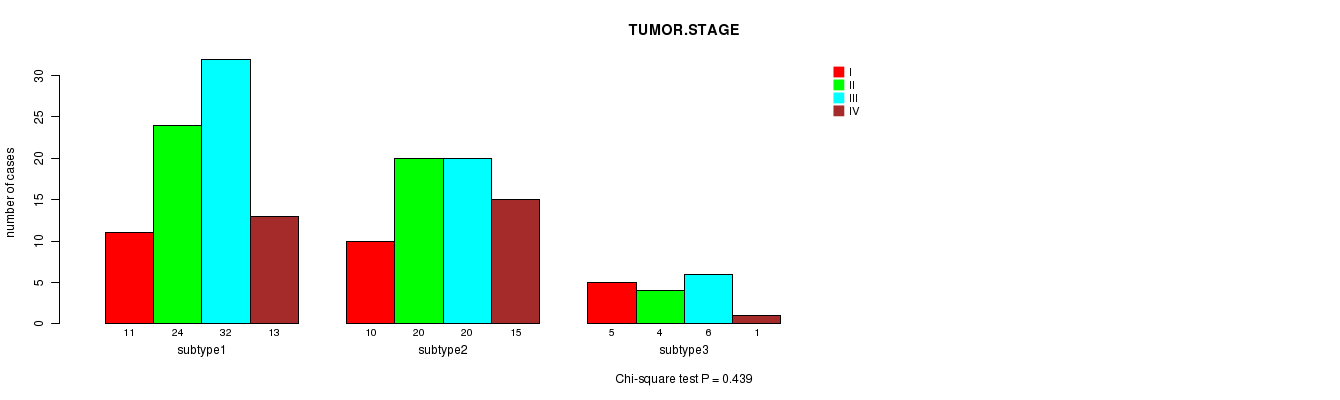
P value = 0.439 (Chi-square test), Q value = 1
Table S9. Clustering Approach #1: 'Copy Number Ratio CNMF subtypes' versus Clinical Feature #8: 'TUMOR.STAGE'
| nPatients | I | II | III | IV |
|---|---|---|---|---|
| ALL | 26 | 48 | 58 | 29 |
| subtype1 | 11 | 24 | 32 | 13 |
| subtype2 | 10 | 20 | 20 | 15 |
| subtype3 | 5 | 4 | 6 | 1 |
Figure S8. Get High-res Image Clustering Approach #1: 'Copy Number Ratio CNMF subtypes' versus Clinical Feature #8: 'TUMOR.STAGE'
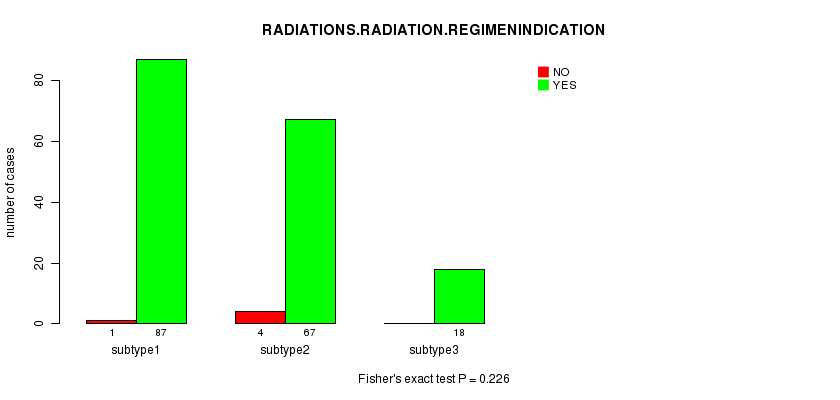
P value = 0.226 (Fisher's exact test), Q value = 1
Table S10. Clustering Approach #1: 'Copy Number Ratio CNMF subtypes' versus Clinical Feature #9: 'RADIATIONS.RADIATION.REGIMENINDICATION'
| nPatients | NO | YES |
|---|---|---|
| ALL | 5 | 172 |
| subtype1 | 1 | 87 |
| subtype2 | 4 | 67 |
| subtype3 | 0 | 18 |
Figure S9. Get High-res Image Clustering Approach #1: 'Copy Number Ratio CNMF subtypes' versus Clinical Feature #9: 'RADIATIONS.RADIATION.REGIMENINDICATION'
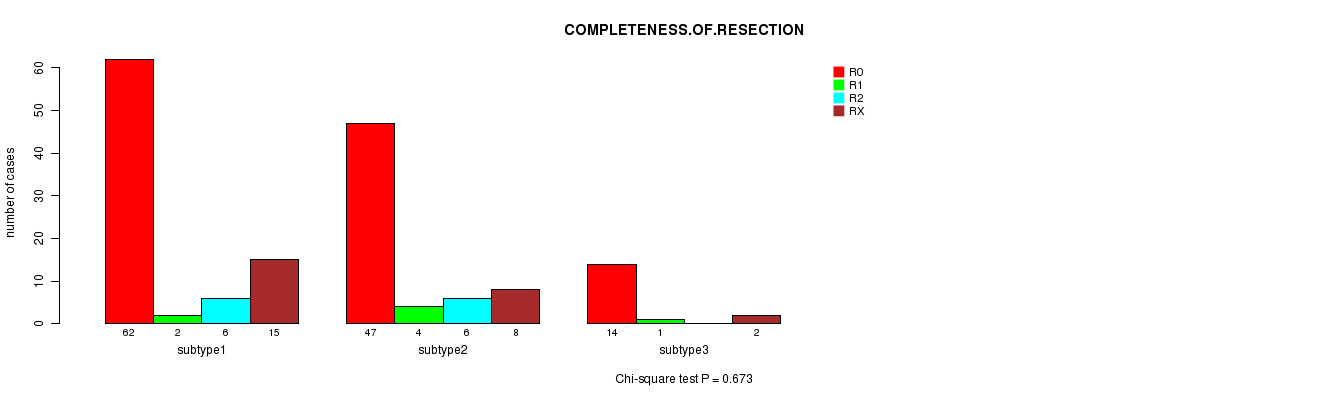
P value = 0.673 (Chi-square test), Q value = 1
Table S11. Clustering Approach #1: 'Copy Number Ratio CNMF subtypes' versus Clinical Feature #10: 'COMPLETENESS.OF.RESECTION'
| nPatients | R0 | R1 | R2 | RX |
|---|---|---|---|---|
| ALL | 123 | 7 | 12 | 25 |
| subtype1 | 62 | 2 | 6 | 15 |
| subtype2 | 47 | 4 | 6 | 8 |
| subtype3 | 14 | 1 | 0 | 2 |
Figure S10. Get High-res Image Clustering Approach #1: 'Copy Number Ratio CNMF subtypes' versus Clinical Feature #10: 'COMPLETENESS.OF.RESECTION'
P value = 0.0568 (ANOVA), Q value = 1
Table S12. Clustering Approach #1: 'Copy Number Ratio CNMF subtypes' versus Clinical Feature #11: 'NUMBER.OF.LYMPH.NODES'
| nPatients | Mean (Std.Dev) | |
|---|---|---|
| ALL | 133 | 4.0 (5.7) |
| subtype1 | 73 | 3.1 (4.1) |
| subtype2 | 51 | 5.5 (7.3) |
| subtype3 | 9 | 2.8 (4.5) |
Figure S11. Get High-res Image Clustering Approach #1: 'Copy Number Ratio CNMF subtypes' versus Clinical Feature #11: 'NUMBER.OF.LYMPH.NODES'
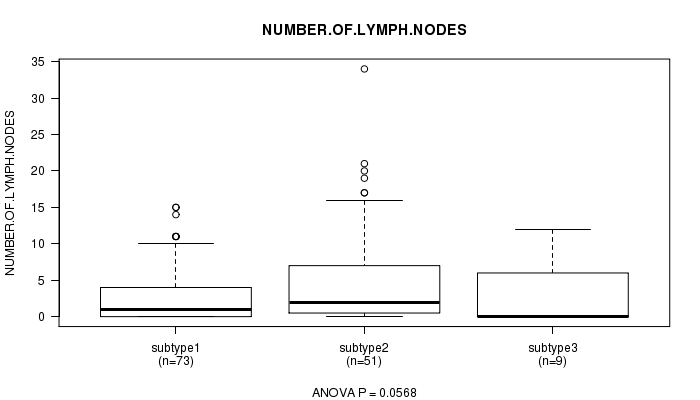
Table S13. Get Full Table Description of clustering approach #2: 'METHLYATION CNMF'
| Cluster Labels | 1 | 2 | 3 | 4 |
|---|---|---|---|---|
| Number of samples | 18 | 28 | 38 | 46 |
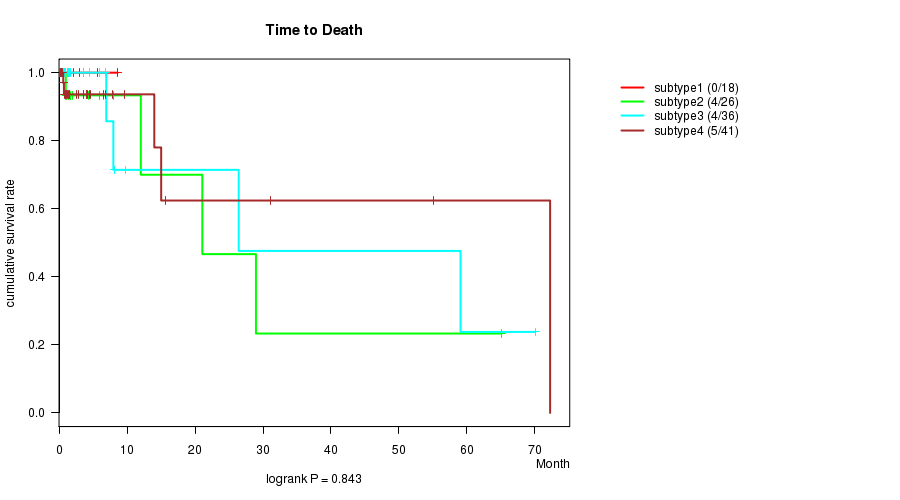
P value = 0.843 (logrank test), Q value = 1
Table S14. Clustering Approach #2: 'METHLYATION CNMF' versus Clinical Feature #1: 'Time to Death'
| nPatients | nDeath | Duration Range (Median), Month | |
|---|---|---|---|
| ALL | 121 | 13 | 0.1 - 72.2 (1.0) |
| subtype1 | 18 | 0 | 0.1 - 8.7 (0.9) |
| subtype2 | 26 | 4 | 0.1 - 65.1 (1.0) |
| subtype3 | 36 | 4 | 0.1 - 70.1 (1.0) |
| subtype4 | 41 | 5 | 0.1 - 72.2 (1.5) |
Figure S12. Get High-res Image Clustering Approach #2: 'METHLYATION CNMF' versus Clinical Feature #1: 'Time to Death'
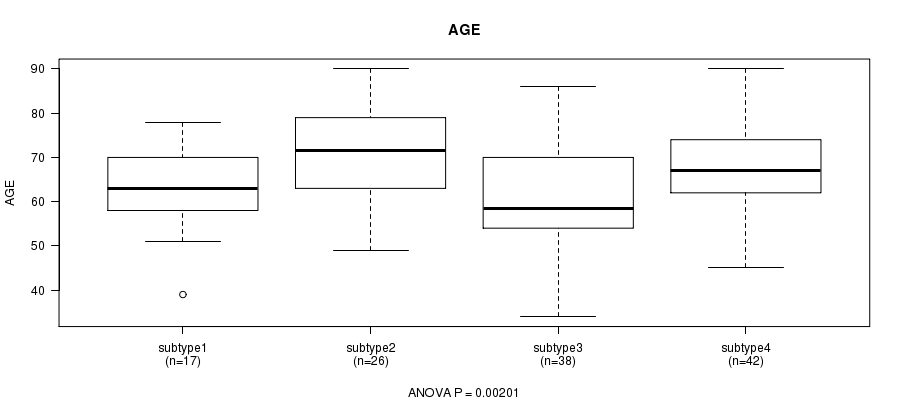
P value = 0.00201 (ANOVA), Q value = 0.13
Table S15. Clustering Approach #2: 'METHLYATION CNMF' versus Clinical Feature #2: 'AGE'
| nPatients | Mean (Std.Dev) | |
|---|---|---|
| ALL | 123 | 65.6 (11.1) |
| subtype1 | 17 | 62.8 (10.0) |
| subtype2 | 26 | 71.0 (10.4) |
| subtype3 | 38 | 61.2 (11.9) |
| subtype4 | 42 | 67.4 (9.7) |
Figure S13. Get High-res Image Clustering Approach #2: 'METHLYATION CNMF' versus Clinical Feature #2: 'AGE'
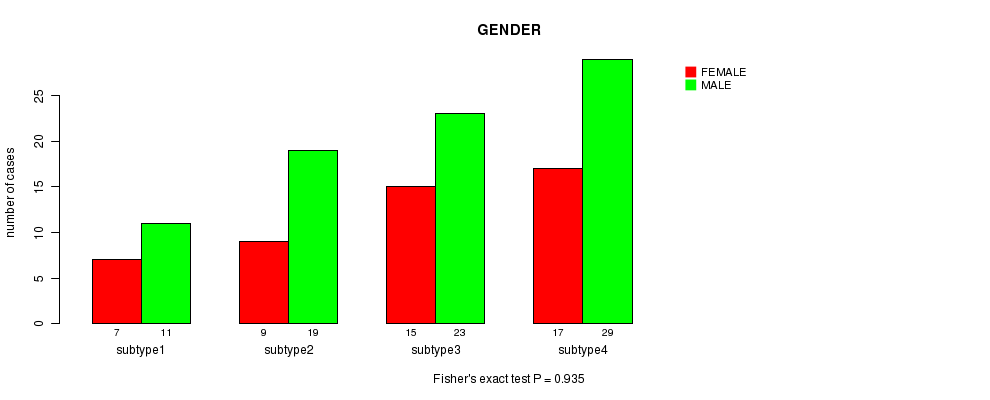
P value = 0.935 (Fisher's exact test), Q value = 1
Table S16. Clustering Approach #2: 'METHLYATION CNMF' versus Clinical Feature #3: 'GENDER'
| nPatients | FEMALE | MALE |
|---|---|---|
| ALL | 48 | 82 |
| subtype1 | 7 | 11 |
| subtype2 | 9 | 19 |
| subtype3 | 15 | 23 |
| subtype4 | 17 | 29 |
Figure S14. Get High-res Image Clustering Approach #2: 'METHLYATION CNMF' versus Clinical Feature #3: 'GENDER'
P value = 0.0758 (Chi-square test), Q value = 1
Table S17. Clustering Approach #2: 'METHLYATION CNMF' versus Clinical Feature #4: 'HISTOLOGICAL.TYPE'
| nPatients | STOMACH ADENOCARCINOMA - DIFFUSE TYPE | STOMACH ADENOCARCINOMA - NOT OTHERWISE SPECIFIED (NOS) | STOMACH ADENOCARCINOMA - SIGNET RING TYPE | STOMACH INTESTINAL ADENOCARCINOMA - MUCINOUS TYPE | STOMACH INTESTINAL ADENOCARCINOMA - PAPILLARY TYPE | STOMACH INTESTINAL ADENOCARCINOMA - TUBULAR TYPE | STOMACH INTESTINAL ADENOCARCINOMA - TYPE NOT OTHERWISE SPECIFIED (NOS) |
|---|---|---|---|---|---|---|---|
| ALL | 23 | 58 | 1 | 9 | 3 | 9 | 27 |
| subtype1 | 4 | 11 | 0 | 0 | 0 | 1 | 2 |
| subtype2 | 3 | 11 | 0 | 3 | 1 | 2 | 8 |
| subtype3 | 13 | 14 | 1 | 4 | 0 | 0 | 6 |
| subtype4 | 3 | 22 | 0 | 2 | 2 | 6 | 11 |
Figure S15. Get High-res Image Clustering Approach #2: 'METHLYATION CNMF' versus Clinical Feature #4: 'HISTOLOGICAL.TYPE'
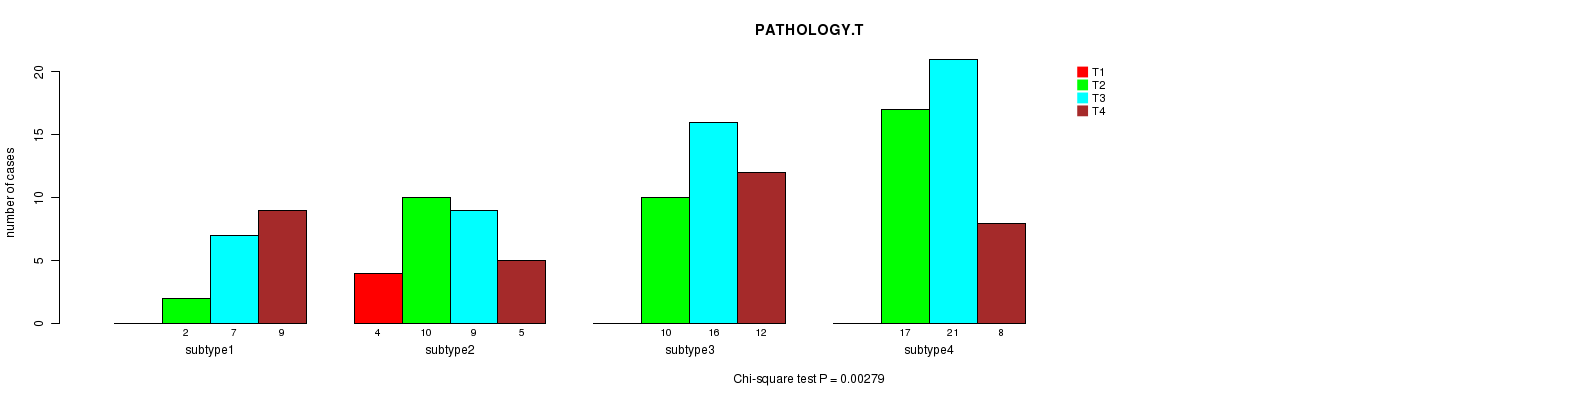
P value = 0.00279 (Chi-square test), Q value = 0.17
Table S18. Clustering Approach #2: 'METHLYATION CNMF' versus Clinical Feature #5: 'PATHOLOGY.T'
| nPatients | T1 | T2 | T3 | T4 |
|---|---|---|---|---|
| ALL | 4 | 39 | 53 | 34 |
| subtype1 | 0 | 2 | 7 | 9 |
| subtype2 | 4 | 10 | 9 | 5 |
| subtype3 | 0 | 10 | 16 | 12 |
| subtype4 | 0 | 17 | 21 | 8 |
Figure S16. Get High-res Image Clustering Approach #2: 'METHLYATION CNMF' versus Clinical Feature #5: 'PATHOLOGY.T'
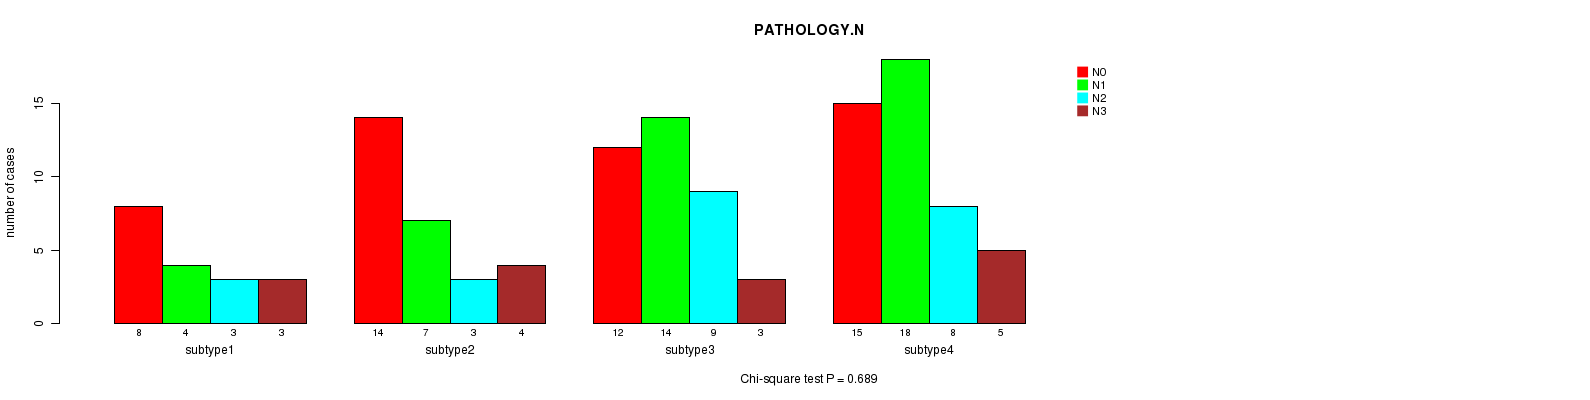
P value = 0.689 (Chi-square test), Q value = 1
Table S19. Clustering Approach #2: 'METHLYATION CNMF' versus Clinical Feature #6: 'PATHOLOGY.N'
| nPatients | N0 | N1 | N2 | N3 |
|---|---|---|---|---|
| ALL | 49 | 43 | 23 | 15 |
| subtype1 | 8 | 4 | 3 | 3 |
| subtype2 | 14 | 7 | 3 | 4 |
| subtype3 | 12 | 14 | 9 | 3 |
| subtype4 | 15 | 18 | 8 | 5 |
Figure S17. Get High-res Image Clustering Approach #2: 'METHLYATION CNMF' versus Clinical Feature #6: 'PATHOLOGY.N'
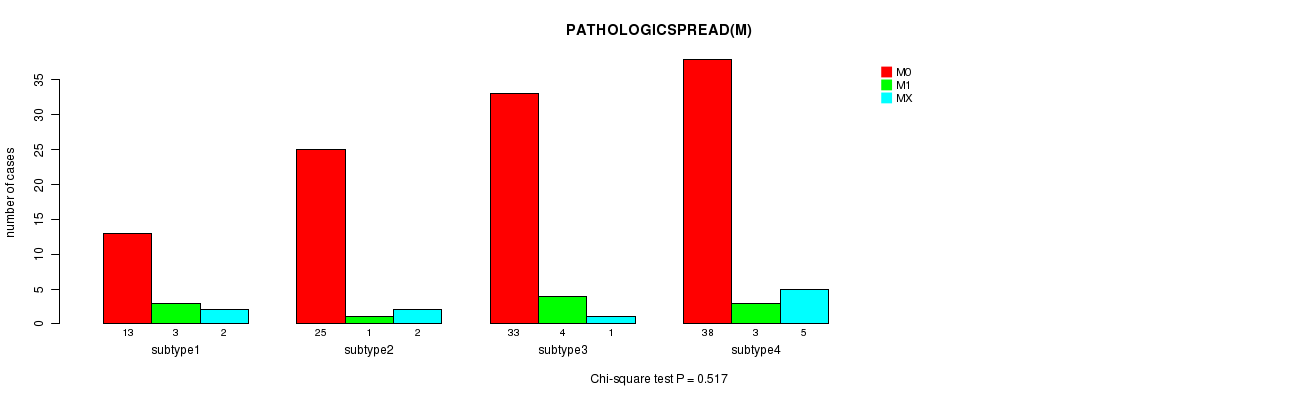
P value = 0.517 (Chi-square test), Q value = 1
Table S20. Clustering Approach #2: 'METHLYATION CNMF' versus Clinical Feature #7: 'PATHOLOGICSPREAD(M)'
| nPatients | M0 | M1 | MX |
|---|---|---|---|
| ALL | 109 | 11 | 10 |
| subtype1 | 13 | 3 | 2 |
| subtype2 | 25 | 1 | 2 |
| subtype3 | 33 | 4 | 1 |
| subtype4 | 38 | 3 | 5 |
Figure S18. Get High-res Image Clustering Approach #2: 'METHLYATION CNMF' versus Clinical Feature #7: 'PATHOLOGICSPREAD(M)'
P value = 0.0543 (Chi-square test), Q value = 1
Table S21. Clustering Approach #2: 'METHLYATION CNMF' versus Clinical Feature #8: 'TUMOR.STAGE'
| nPatients | I | II | III | IV |
|---|---|---|---|---|
| ALL | 19 | 44 | 49 | 18 |
| subtype1 | 1 | 4 | 10 | 3 |
| subtype2 | 10 | 9 | 7 | 2 |
| subtype3 | 4 | 13 | 16 | 5 |
| subtype4 | 4 | 18 | 16 | 8 |
Figure S19. Get High-res Image Clustering Approach #2: 'METHLYATION CNMF' versus Clinical Feature #8: 'TUMOR.STAGE'

P value = 0.204 (Fisher's exact test), Q value = 1
Table S22. Clustering Approach #2: 'METHLYATION CNMF' versus Clinical Feature #9: 'RADIATIONS.RADIATION.REGIMENINDICATION'
| nPatients | NO | YES |
|---|---|---|
| ALL | 5 | 125 |
| subtype1 | 0 | 18 |
| subtype2 | 1 | 27 |
| subtype3 | 0 | 38 |
| subtype4 | 4 | 42 |
Figure S20. Get High-res Image Clustering Approach #2: 'METHLYATION CNMF' versus Clinical Feature #9: 'RADIATIONS.RADIATION.REGIMENINDICATION'
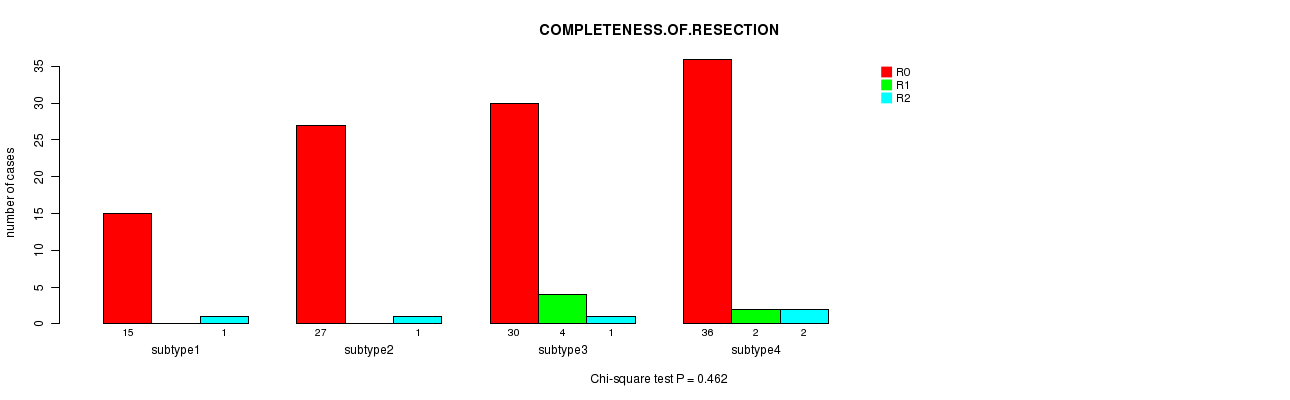
P value = 0.462 (Chi-square test), Q value = 1
Table S23. Clustering Approach #2: 'METHLYATION CNMF' versus Clinical Feature #10: 'COMPLETENESS.OF.RESECTION'
| nPatients | R0 | R1 | R2 |
|---|---|---|---|
| ALL | 108 | 6 | 5 |
| subtype1 | 15 | 0 | 1 |
| subtype2 | 27 | 0 | 1 |
| subtype3 | 30 | 4 | 1 |
| subtype4 | 36 | 2 | 2 |
Figure S21. Get High-res Image Clustering Approach #2: 'METHLYATION CNMF' versus Clinical Feature #10: 'COMPLETENESS.OF.RESECTION'
P value = 0.708 (ANOVA), Q value = 1
Table S24. Clustering Approach #2: 'METHLYATION CNMF' versus Clinical Feature #11: 'NUMBER.OF.LYMPH.NODES'
| nPatients | Mean (Std.Dev) | |
|---|---|---|
| ALL | 119 | 4.2 (5.9) |
| subtype1 | 16 | 5.6 (6.6) |
| subtype2 | 27 | 3.4 (7.1) |
| subtype3 | 35 | 4.1 (5.6) |
| subtype4 | 41 | 4.1 (5.2) |
Figure S22. Get High-res Image Clustering Approach #2: 'METHLYATION CNMF' versus Clinical Feature #11: 'NUMBER.OF.LYMPH.NODES'
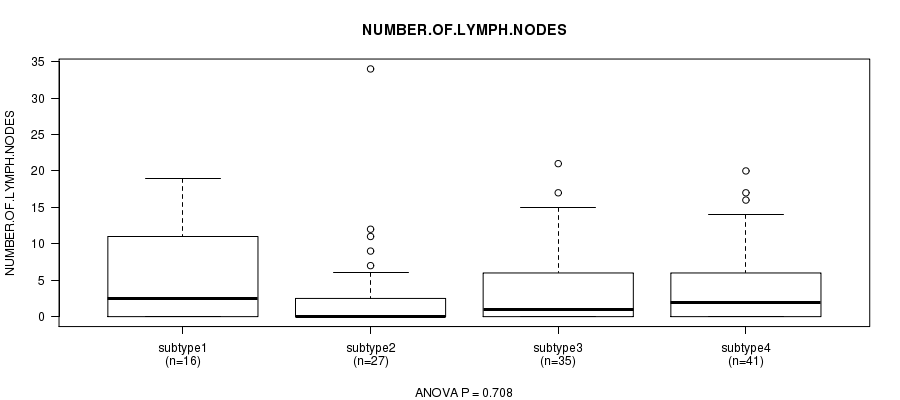
Table S25. Get Full Table Description of clustering approach #3: 'RNAseq CNMF subtypes'
| Cluster Labels | 1 | 2 |
|---|---|---|
| Number of samples | 22 | 21 |
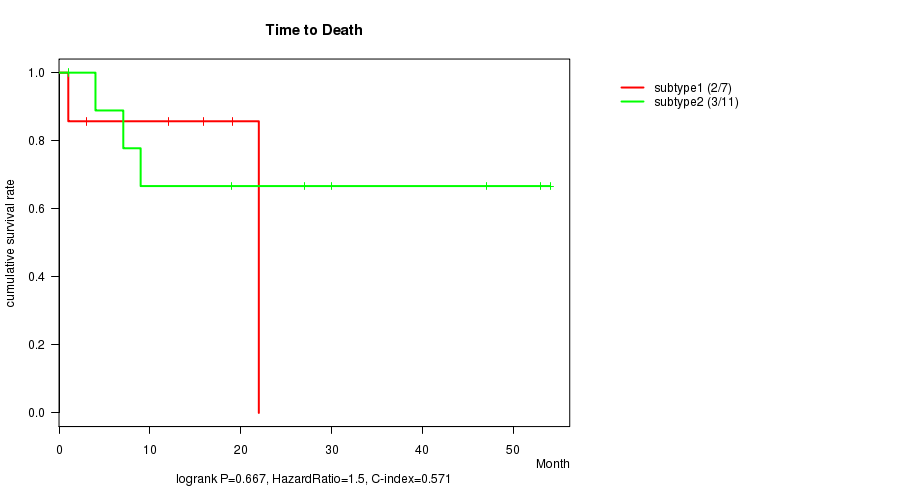
P value = 0.667 (logrank test), Q value = 1
Table S26. Clustering Approach #3: 'RNAseq CNMF subtypes' versus Clinical Feature #1: 'Time to Death'
| nPatients | nDeath | Duration Range (Median), Month | |
|---|---|---|---|
| ALL | 18 | 5 | 1.0 - 54.0 (14.0) |
| subtype1 | 7 | 2 | 1.0 - 22.0 (12.0) |
| subtype2 | 11 | 3 | 1.0 - 54.0 (18.9) |
Figure S23. Get High-res Image Clustering Approach #3: 'RNAseq CNMF subtypes' versus Clinical Feature #1: 'Time to Death'
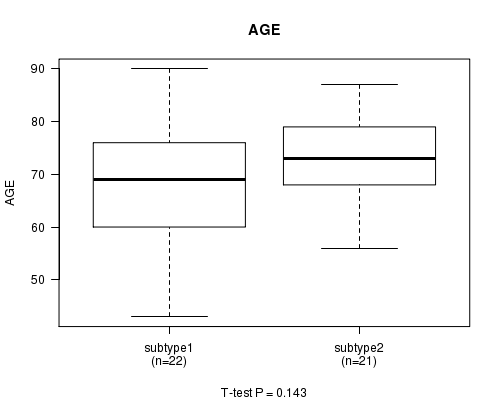
P value = 0.143 (t-test), Q value = 1
Table S27. Clustering Approach #3: 'RNAseq CNMF subtypes' versus Clinical Feature #2: 'AGE'
| nPatients | Mean (Std.Dev) | |
|---|---|---|
| ALL | 43 | 70.4 (10.5) |
| subtype1 | 22 | 68.1 (11.6) |
| subtype2 | 21 | 72.8 (8.8) |
Figure S24. Get High-res Image Clustering Approach #3: 'RNAseq CNMF subtypes' versus Clinical Feature #2: 'AGE'
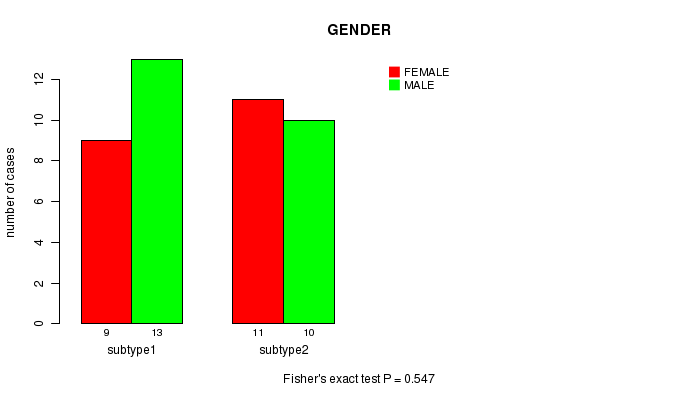
P value = 0.547 (Fisher's exact test), Q value = 1
Table S28. Clustering Approach #3: 'RNAseq CNMF subtypes' versus Clinical Feature #3: 'GENDER'
| nPatients | FEMALE | MALE |
|---|---|---|
| ALL | 20 | 23 |
| subtype1 | 9 | 13 |
| subtype2 | 11 | 10 |
Figure S25. Get High-res Image Clustering Approach #3: 'RNAseq CNMF subtypes' versus Clinical Feature #3: 'GENDER'
P value = 0.0766 (Chi-square test), Q value = 1
Table S29. Clustering Approach #3: 'RNAseq CNMF subtypes' versus Clinical Feature #4: 'HISTOLOGICAL.TYPE'
| nPatients | STOMACH ADENOCARCINOMA - DIFFUSE TYPE | STOMACH ADENOCARCINOMA - NOT OTHERWISE SPECIFIED (NOS) | STOMACH INTESTINAL ADENOCARCINOMA - MUCINOUS TYPE | STOMACH INTESTINAL ADENOCARCINOMA - TUBULAR TYPE | STOMACH INTESTINAL ADENOCARCINOMA - TYPE NOT OTHERWISE SPECIFIED (NOS) |
|---|---|---|---|---|---|
| ALL | 2 | 25 | 1 | 1 | 9 |
| subtype1 | 1 | 15 | 1 | 1 | 1 |
| subtype2 | 1 | 10 | 0 | 0 | 8 |
Figure S26. Get High-res Image Clustering Approach #3: 'RNAseq CNMF subtypes' versus Clinical Feature #4: 'HISTOLOGICAL.TYPE'

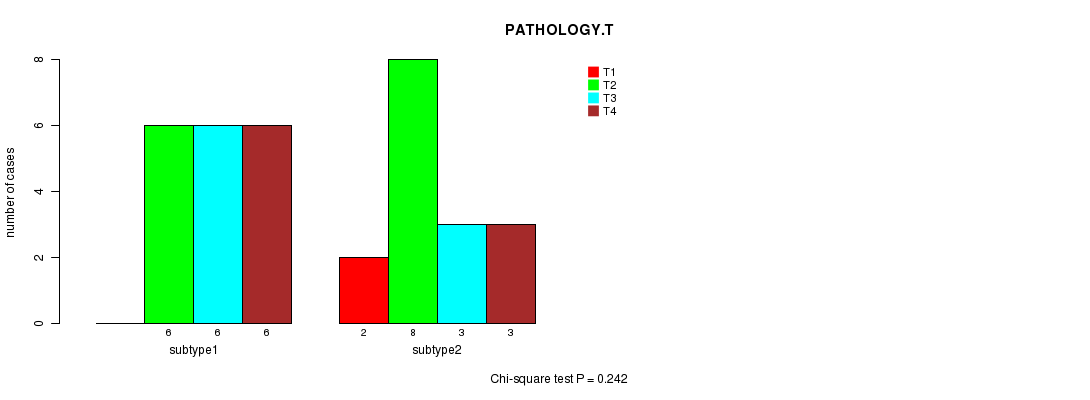
P value = 0.242 (Chi-square test), Q value = 1
Table S30. Clustering Approach #3: 'RNAseq CNMF subtypes' versus Clinical Feature #5: 'PATHOLOGY.T'
| nPatients | T1 | T2 | T3 | T4 |
|---|---|---|---|---|
| ALL | 2 | 14 | 9 | 9 |
| subtype1 | 0 | 6 | 6 | 6 |
| subtype2 | 2 | 8 | 3 | 3 |
Figure S27. Get High-res Image Clustering Approach #3: 'RNAseq CNMF subtypes' versus Clinical Feature #5: 'PATHOLOGY.T'
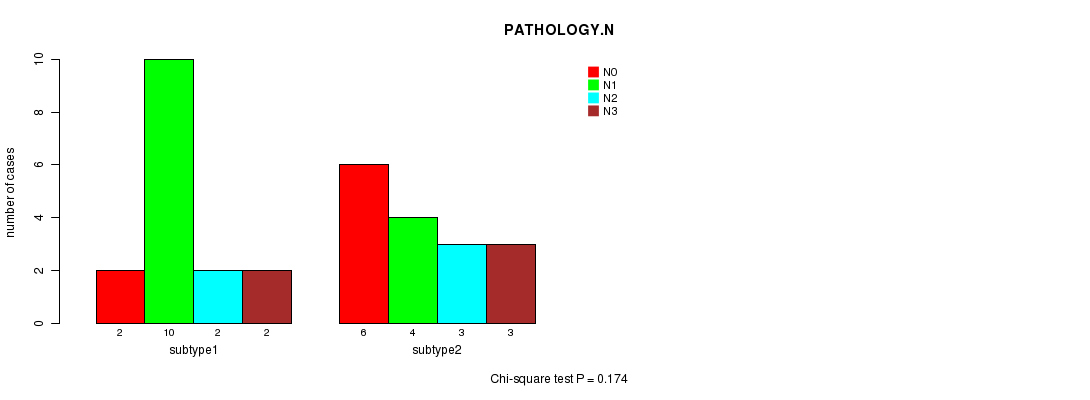
P value = 0.174 (Chi-square test), Q value = 1
Table S31. Clustering Approach #3: 'RNAseq CNMF subtypes' versus Clinical Feature #6: 'PATHOLOGY.N'
| nPatients | N0 | N1 | N2 | N3 |
|---|---|---|---|---|
| ALL | 8 | 14 | 5 | 5 |
| subtype1 | 2 | 10 | 2 | 2 |
| subtype2 | 6 | 4 | 3 | 3 |
Figure S28. Get High-res Image Clustering Approach #3: 'RNAseq CNMF subtypes' versus Clinical Feature #6: 'PATHOLOGY.N'
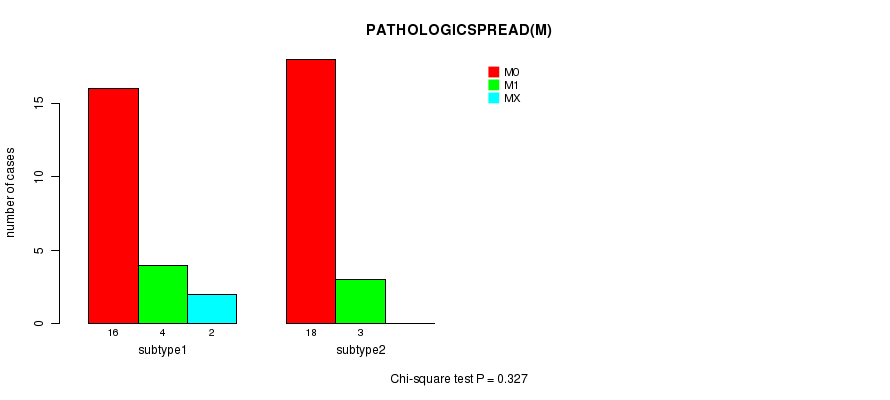
P value = 0.327 (Chi-square test), Q value = 1
Table S32. Clustering Approach #3: 'RNAseq CNMF subtypes' versus Clinical Feature #7: 'PATHOLOGICSPREAD(M)'
| nPatients | M0 | M1 | MX |
|---|---|---|---|
| ALL | 34 | 7 | 2 |
| subtype1 | 16 | 4 | 2 |
| subtype2 | 18 | 3 | 0 |
Figure S29. Get High-res Image Clustering Approach #3: 'RNAseq CNMF subtypes' versus Clinical Feature #7: 'PATHOLOGICSPREAD(M)'
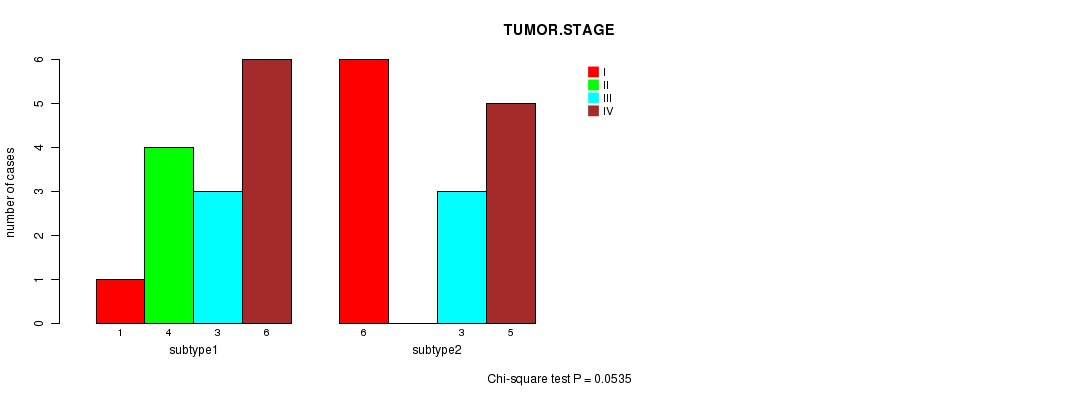
P value = 0.0535 (Chi-square test), Q value = 1
Table S33. Clustering Approach #3: 'RNAseq CNMF subtypes' versus Clinical Feature #8: 'TUMOR.STAGE'
| nPatients | I | II | III | IV |
|---|---|---|---|---|
| ALL | 7 | 4 | 6 | 11 |
| subtype1 | 1 | 4 | 3 | 6 |
| subtype2 | 6 | 0 | 3 | 5 |
Figure S30. Get High-res Image Clustering Approach #3: 'RNAseq CNMF subtypes' versus Clinical Feature #8: 'TUMOR.STAGE'
P value = 0.931 (t-test), Q value = 1
Table S34. Clustering Approach #3: 'RNAseq CNMF subtypes' versus Clinical Feature #10: 'NUMBER.OF.LYMPH.NODES'
| nPatients | Mean (Std.Dev) | |
|---|---|---|
| ALL | 11 | 2.8 (2.2) |
| subtype1 | 7 | 2.9 (2.7) |
| subtype2 | 4 | 2.8 (1.3) |
Figure S31. Get High-res Image Clustering Approach #3: 'RNAseq CNMF subtypes' versus Clinical Feature #10: 'NUMBER.OF.LYMPH.NODES'
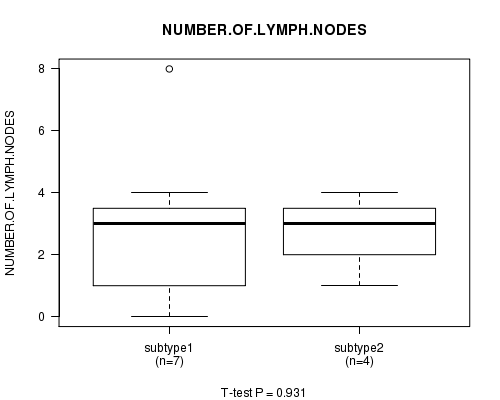
Table S35. Get Full Table Description of clustering approach #4: 'RNAseq cHierClus subtypes'
| Cluster Labels | 1 | 2 | 3 |
|---|---|---|---|
| Number of samples | 15 | 7 | 21 |
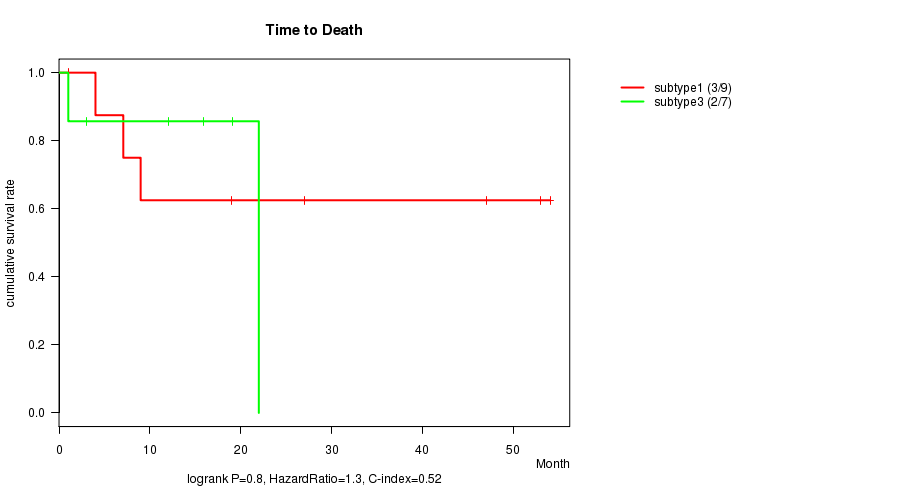
P value = 0.8 (logrank test), Q value = 1
Table S36. Clustering Approach #4: 'RNAseq cHierClus subtypes' versus Clinical Feature #1: 'Time to Death'
| nPatients | nDeath | Duration Range (Median), Month | |
|---|---|---|---|
| ALL | 18 | 5 | 1.0 - 54.0 (14.0) |
| subtype1 | 9 | 3 | 1.0 - 54.0 (18.9) |
| subtype2 | 2 | 0 | 1.0 - 30.0 (15.5) |
| subtype3 | 7 | 2 | 1.0 - 22.0 (12.0) |
Figure S32. Get High-res Image Clustering Approach #4: 'RNAseq cHierClus subtypes' versus Clinical Feature #1: 'Time to Death'
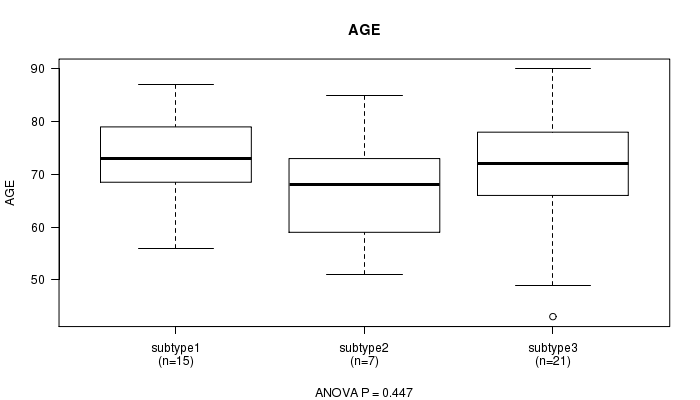
P value = 0.447 (ANOVA), Q value = 1
Table S37. Clustering Approach #4: 'RNAseq cHierClus subtypes' versus Clinical Feature #2: 'AGE'
| nPatients | Mean (Std.Dev) | |
|---|---|---|
| ALL | 43 | 70.4 (10.5) |
| subtype1 | 15 | 72.8 (8.9) |
| subtype2 | 7 | 66.9 (11.4) |
| subtype3 | 21 | 69.8 (11.2) |
Figure S33. Get High-res Image Clustering Approach #4: 'RNAseq cHierClus subtypes' versus Clinical Feature #2: 'AGE'
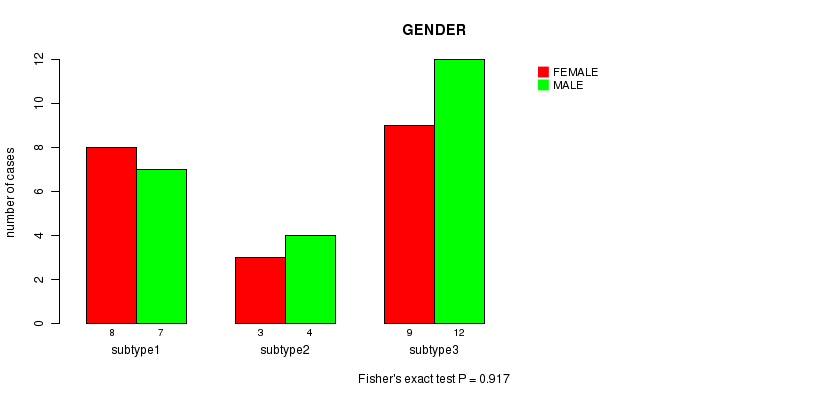
P value = 0.917 (Fisher's exact test), Q value = 1
Table S38. Clustering Approach #4: 'RNAseq cHierClus subtypes' versus Clinical Feature #3: 'GENDER'
| nPatients | FEMALE | MALE |
|---|---|---|
| ALL | 20 | 23 |
| subtype1 | 8 | 7 |
| subtype2 | 3 | 4 |
| subtype3 | 9 | 12 |
Figure S34. Get High-res Image Clustering Approach #4: 'RNAseq cHierClus subtypes' versus Clinical Feature #3: 'GENDER'
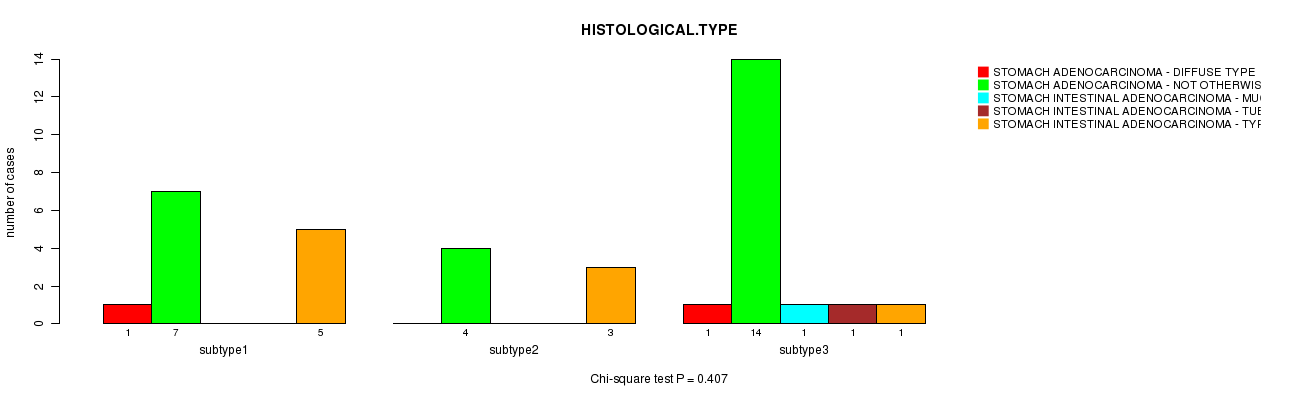
P value = 0.407 (Chi-square test), Q value = 1
Table S39. Clustering Approach #4: 'RNAseq cHierClus subtypes' versus Clinical Feature #4: 'HISTOLOGICAL.TYPE'
| nPatients | STOMACH ADENOCARCINOMA - DIFFUSE TYPE | STOMACH ADENOCARCINOMA - NOT OTHERWISE SPECIFIED (NOS) | STOMACH INTESTINAL ADENOCARCINOMA - MUCINOUS TYPE | STOMACH INTESTINAL ADENOCARCINOMA - TUBULAR TYPE | STOMACH INTESTINAL ADENOCARCINOMA - TYPE NOT OTHERWISE SPECIFIED (NOS) |
|---|---|---|---|---|---|
| ALL | 2 | 25 | 1 | 1 | 9 |
| subtype1 | 1 | 7 | 0 | 0 | 5 |
| subtype2 | 0 | 4 | 0 | 0 | 3 |
| subtype3 | 1 | 14 | 1 | 1 | 1 |
Figure S35. Get High-res Image Clustering Approach #4: 'RNAseq cHierClus subtypes' versus Clinical Feature #4: 'HISTOLOGICAL.TYPE'
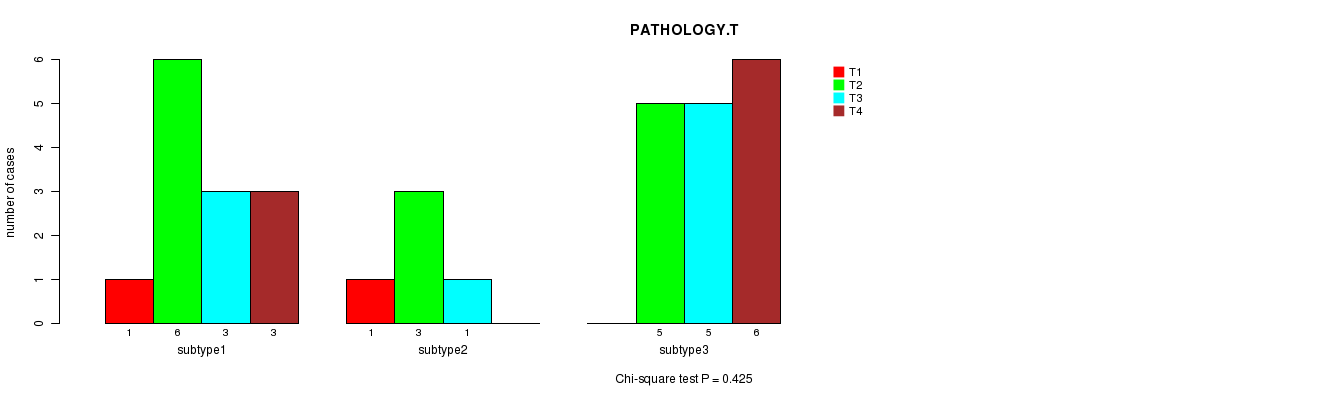
P value = 0.425 (Chi-square test), Q value = 1
Table S40. Clustering Approach #4: 'RNAseq cHierClus subtypes' versus Clinical Feature #5: 'PATHOLOGY.T'
| nPatients | T1 | T2 | T3 | T4 |
|---|---|---|---|---|
| ALL | 2 | 14 | 9 | 9 |
| subtype1 | 1 | 6 | 3 | 3 |
| subtype2 | 1 | 3 | 1 | 0 |
| subtype3 | 0 | 5 | 5 | 6 |
Figure S36. Get High-res Image Clustering Approach #4: 'RNAseq cHierClus subtypes' versus Clinical Feature #5: 'PATHOLOGY.T'
P value = 0.0334 (Chi-square test), Q value = 1
Table S41. Clustering Approach #4: 'RNAseq cHierClus subtypes' versus Clinical Feature #6: 'PATHOLOGY.N'
| nPatients | N0 | N1 | N2 | N3 |
|---|---|---|---|---|
| ALL | 8 | 14 | 5 | 5 |
| subtype1 | 3 | 2 | 3 | 3 |
| subtype2 | 4 | 2 | 0 | 0 |
| subtype3 | 1 | 10 | 2 | 2 |
Figure S37. Get High-res Image Clustering Approach #4: 'RNAseq cHierClus subtypes' versus Clinical Feature #6: 'PATHOLOGY.N'
P value = 0.474 (Chi-square test), Q value = 1
Table S42. Clustering Approach #4: 'RNAseq cHierClus subtypes' versus Clinical Feature #7: 'PATHOLOGICSPREAD(M)'
| nPatients | M0 | M1 | MX |
|---|---|---|---|
| ALL | 34 | 7 | 2 |
| subtype1 | 12 | 3 | 0 |
| subtype2 | 6 | 0 | 1 |
| subtype3 | 16 | 4 | 1 |
Figure S38. Get High-res Image Clustering Approach #4: 'RNAseq cHierClus subtypes' versus Clinical Feature #7: 'PATHOLOGICSPREAD(M)'

P value = 0.00304 (Chi-square test), Q value = 0.19
Table S43. Clustering Approach #4: 'RNAseq cHierClus subtypes' versus Clinical Feature #8: 'TUMOR.STAGE'
| nPatients | I | II | III | IV |
|---|---|---|---|---|
| ALL | 7 | 4 | 6 | 11 |
| subtype1 | 3 | 0 | 3 | 5 |
| subtype2 | 4 | 0 | 0 | 0 |
| subtype3 | 0 | 4 | 3 | 6 |
Figure S39. Get High-res Image Clustering Approach #4: 'RNAseq cHierClus subtypes' versus Clinical Feature #8: 'TUMOR.STAGE'
P value = 0.563 (ANOVA), Q value = 1
Table S44. Clustering Approach #4: 'RNAseq cHierClus subtypes' versus Clinical Feature #10: 'NUMBER.OF.LYMPH.NODES'
| nPatients | Mean (Std.Dev) | |
|---|---|---|
| ALL | 11 | 2.8 (2.2) |
| subtype1 | 2 | 2.0 (1.4) |
| subtype2 | 3 | 2.3 (2.1) |
| subtype3 | 6 | 3.3 (2.7) |
Figure S40. Get High-res Image Clustering Approach #4: 'RNAseq cHierClus subtypes' versus Clinical Feature #10: 'NUMBER.OF.LYMPH.NODES'

Table S45. Get Full Table Description of clustering approach #5: 'MIRSEQ CNMF'
| Cluster Labels | 1 | 2 | 3 |
|---|---|---|---|
| Number of samples | 84 | 36 | 45 |
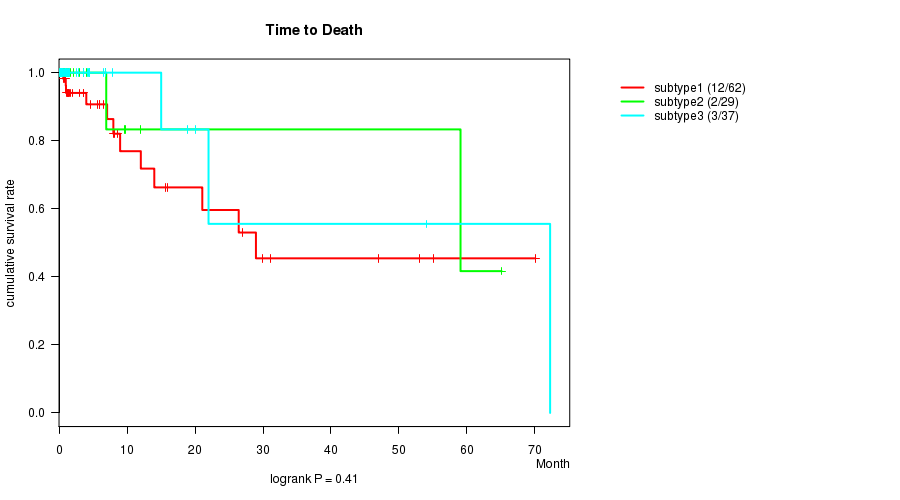
P value = 0.41 (logrank test), Q value = 1
Table S46. Clustering Approach #5: 'MIRSEQ CNMF' versus Clinical Feature #1: 'Time to Death'
| nPatients | nDeath | Duration Range (Median), Month | |
|---|---|---|---|
| ALL | 128 | 17 | 0.1 - 72.2 (1.4) |
| subtype1 | 62 | 12 | 0.1 - 70.1 (2.5) |
| subtype2 | 29 | 2 | 0.1 - 65.1 (1.2) |
| subtype3 | 37 | 3 | 0.1 - 72.2 (1.2) |
Figure S41. Get High-res Image Clustering Approach #5: 'MIRSEQ CNMF' versus Clinical Feature #1: 'Time to Death'
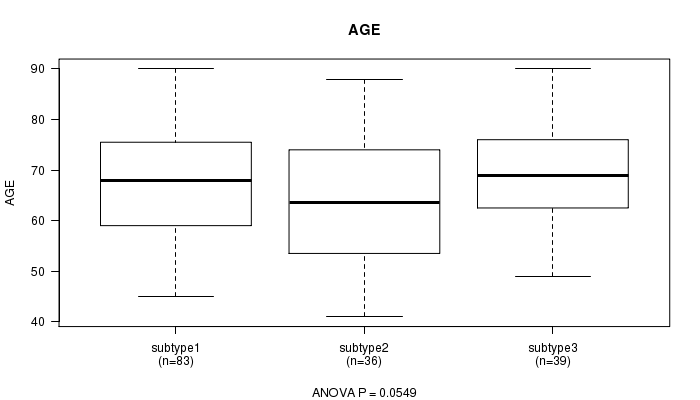
P value = 0.0549 (ANOVA), Q value = 1
Table S47. Clustering Approach #5: 'MIRSEQ CNMF' versus Clinical Feature #2: 'AGE'
| nPatients | Mean (Std.Dev) | |
|---|---|---|
| ALL | 158 | 67.5 (10.6) |
| subtype1 | 83 | 68.2 (10.1) |
| subtype2 | 36 | 63.9 (12.0) |
| subtype3 | 39 | 69.4 (9.5) |
Figure S42. Get High-res Image Clustering Approach #5: 'MIRSEQ CNMF' versus Clinical Feature #2: 'AGE'
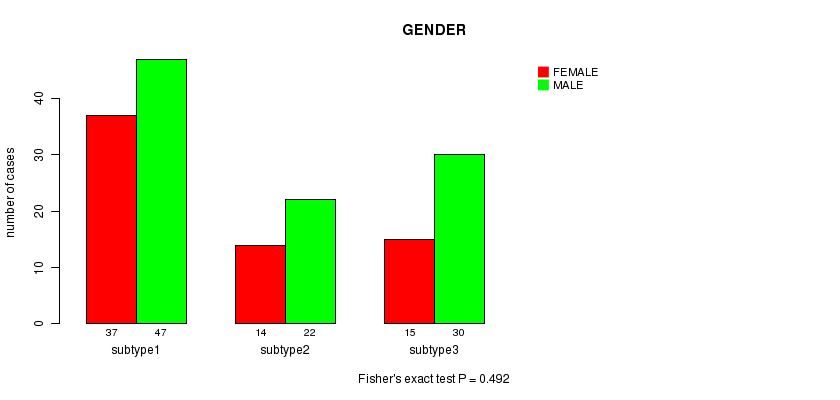
P value = 0.492 (Fisher's exact test), Q value = 1
Table S48. Clustering Approach #5: 'MIRSEQ CNMF' versus Clinical Feature #3: 'GENDER'
| nPatients | FEMALE | MALE |
|---|---|---|
| ALL | 66 | 99 |
| subtype1 | 37 | 47 |
| subtype2 | 14 | 22 |
| subtype3 | 15 | 30 |
Figure S43. Get High-res Image Clustering Approach #5: 'MIRSEQ CNMF' versus Clinical Feature #3: 'GENDER'
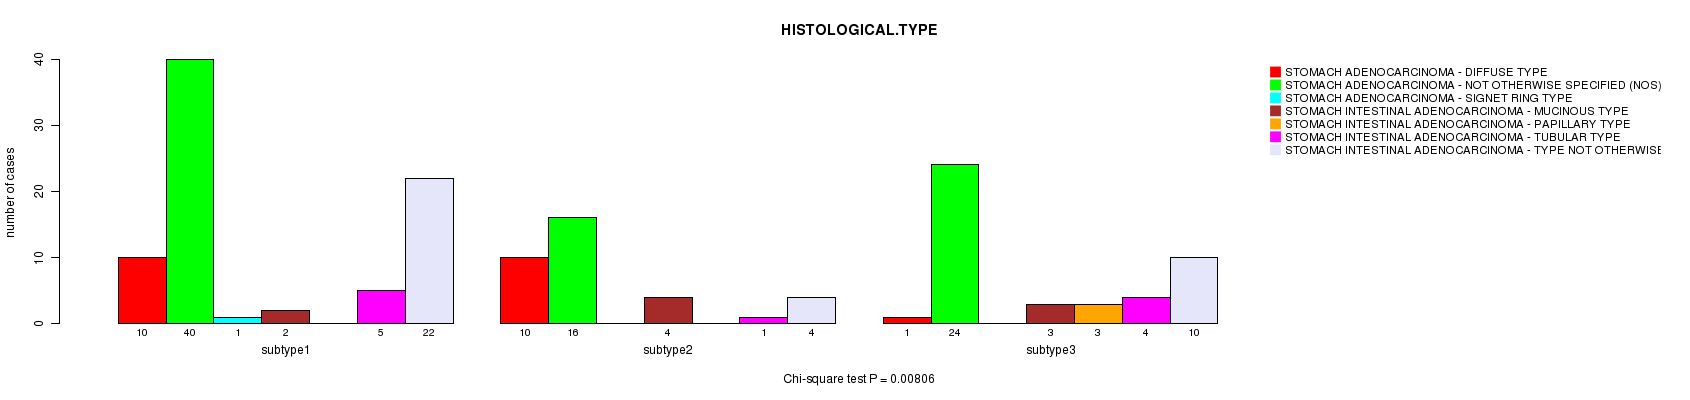
P value = 0.00806 (Chi-square test), Q value = 0.48
Table S49. Clustering Approach #5: 'MIRSEQ CNMF' versus Clinical Feature #4: 'HISTOLOGICAL.TYPE'
| nPatients | STOMACH ADENOCARCINOMA - DIFFUSE TYPE | STOMACH ADENOCARCINOMA - NOT OTHERWISE SPECIFIED (NOS) | STOMACH ADENOCARCINOMA - SIGNET RING TYPE | STOMACH INTESTINAL ADENOCARCINOMA - MUCINOUS TYPE | STOMACH INTESTINAL ADENOCARCINOMA - PAPILLARY TYPE | STOMACH INTESTINAL ADENOCARCINOMA - TUBULAR TYPE | STOMACH INTESTINAL ADENOCARCINOMA - TYPE NOT OTHERWISE SPECIFIED (NOS) |
|---|---|---|---|---|---|---|---|
| ALL | 21 | 80 | 1 | 9 | 3 | 10 | 36 |
| subtype1 | 10 | 40 | 1 | 2 | 0 | 5 | 22 |
| subtype2 | 10 | 16 | 0 | 4 | 0 | 1 | 4 |
| subtype3 | 1 | 24 | 0 | 3 | 3 | 4 | 10 |
Figure S44. Get High-res Image Clustering Approach #5: 'MIRSEQ CNMF' versus Clinical Feature #4: 'HISTOLOGICAL.TYPE'
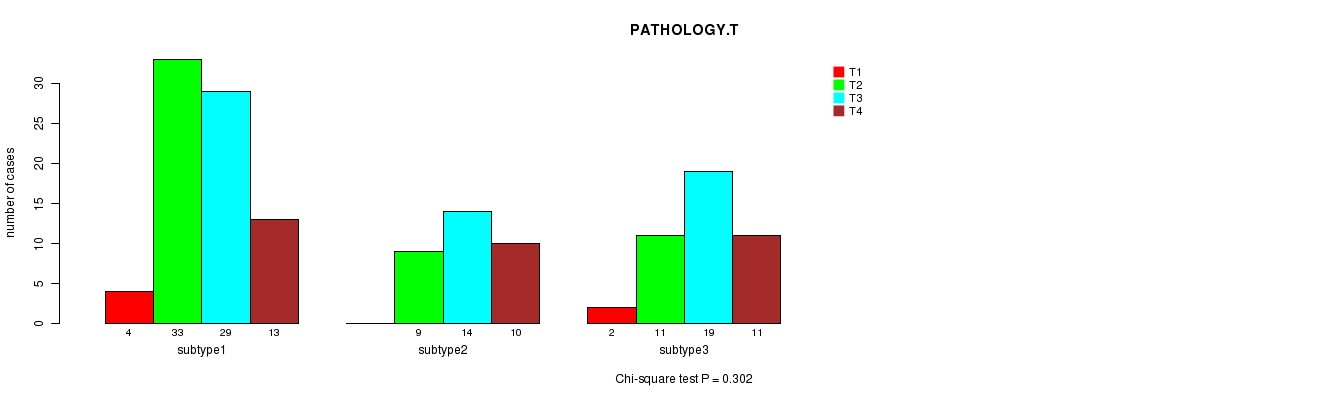
P value = 0.302 (Chi-square test), Q value = 1
Table S50. Clustering Approach #5: 'MIRSEQ CNMF' versus Clinical Feature #5: 'PATHOLOGY.T'
| nPatients | T1 | T2 | T3 | T4 |
|---|---|---|---|---|
| ALL | 6 | 53 | 62 | 34 |
| subtype1 | 4 | 33 | 29 | 13 |
| subtype2 | 0 | 9 | 14 | 10 |
| subtype3 | 2 | 11 | 19 | 11 |
Figure S45. Get High-res Image Clustering Approach #5: 'MIRSEQ CNMF' versus Clinical Feature #5: 'PATHOLOGY.T'
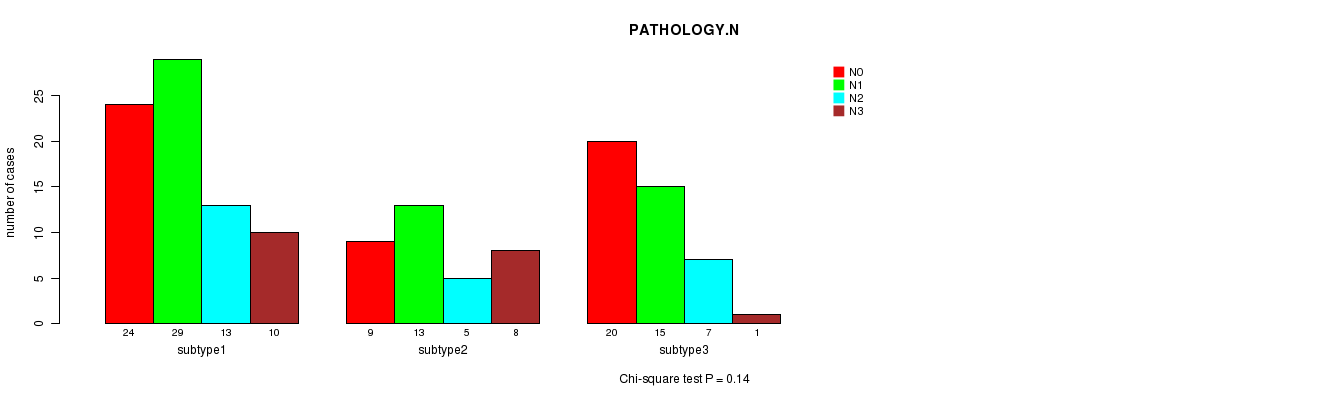
P value = 0.14 (Chi-square test), Q value = 1
Table S51. Clustering Approach #5: 'MIRSEQ CNMF' versus Clinical Feature #6: 'PATHOLOGY.N'
| nPatients | N0 | N1 | N2 | N3 |
|---|---|---|---|---|
| ALL | 53 | 57 | 25 | 19 |
| subtype1 | 24 | 29 | 13 | 10 |
| subtype2 | 9 | 13 | 5 | 8 |
| subtype3 | 20 | 15 | 7 | 1 |
Figure S46. Get High-res Image Clustering Approach #5: 'MIRSEQ CNMF' versus Clinical Feature #6: 'PATHOLOGY.N'
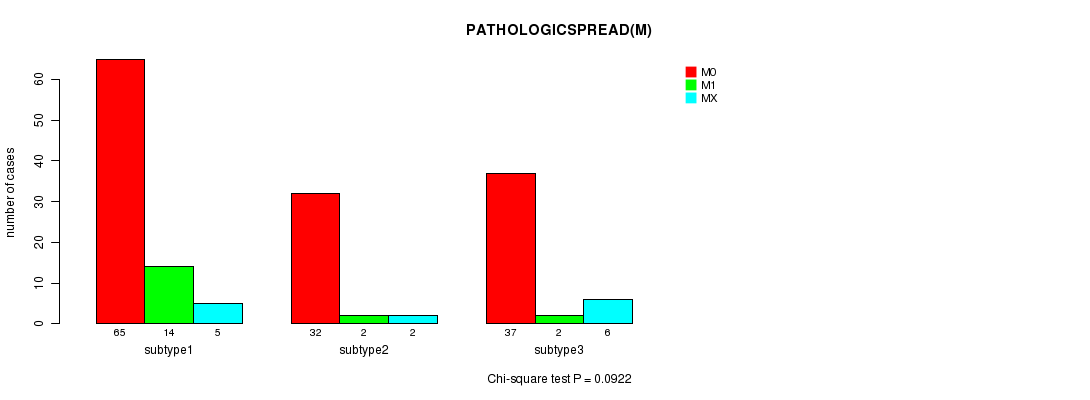
P value = 0.0922 (Chi-square test), Q value = 1
Table S52. Clustering Approach #5: 'MIRSEQ CNMF' versus Clinical Feature #7: 'PATHOLOGICSPREAD(M)'
| nPatients | M0 | M1 | MX |
|---|---|---|---|
| ALL | 134 | 18 | 13 |
| subtype1 | 65 | 14 | 5 |
| subtype2 | 32 | 2 | 2 |
| subtype3 | 37 | 2 | 6 |
Figure S47. Get High-res Image Clustering Approach #5: 'MIRSEQ CNMF' versus Clinical Feature #7: 'PATHOLOGICSPREAD(M)'
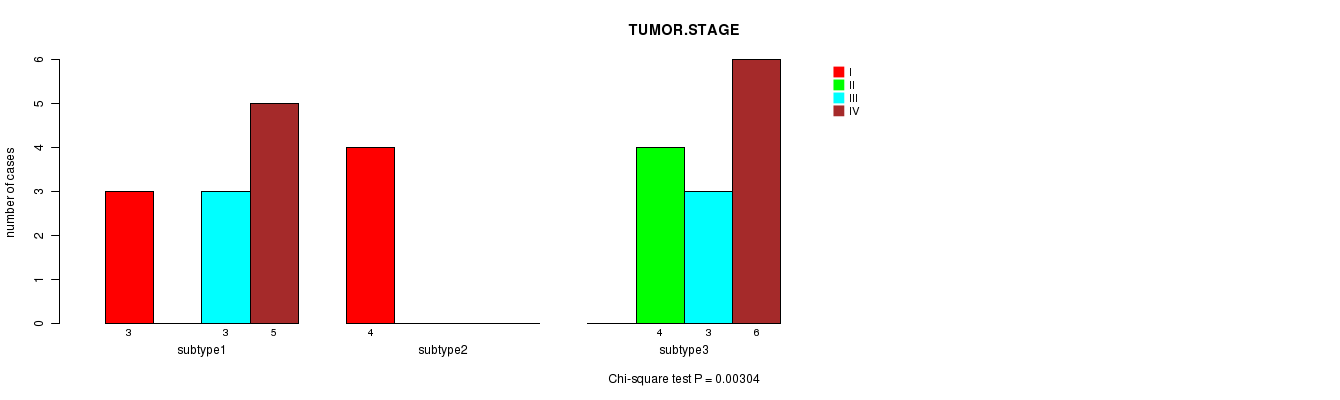
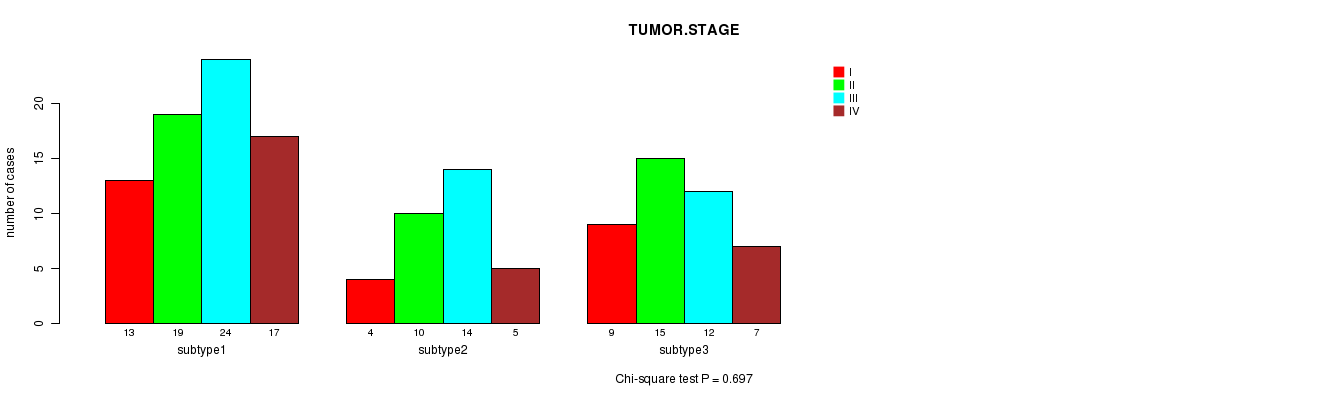
P value = 0.697 (Chi-square test), Q value = 1
Table S53. Clustering Approach #5: 'MIRSEQ CNMF' versus Clinical Feature #8: 'TUMOR.STAGE'
| nPatients | I | II | III | IV |
|---|---|---|---|---|
| ALL | 26 | 44 | 50 | 29 |
| subtype1 | 13 | 19 | 24 | 17 |
| subtype2 | 4 | 10 | 14 | 5 |
| subtype3 | 9 | 15 | 12 | 7 |
Figure S48. Get High-res Image Clustering Approach #5: 'MIRSEQ CNMF' versus Clinical Feature #8: 'TUMOR.STAGE'
P value = 0.0152 (Fisher's exact test), Q value = 0.87
Table S54. Clustering Approach #5: 'MIRSEQ CNMF' versus Clinical Feature #9: 'RADIATIONS.RADIATION.REGIMENINDICATION'
| nPatients | NO | YES |
|---|---|---|
| ALL | 5 | 160 |
| subtype1 | 0 | 84 |
| subtype2 | 1 | 35 |
| subtype3 | 4 | 41 |
Figure S49. Get High-res Image Clustering Approach #5: 'MIRSEQ CNMF' versus Clinical Feature #9: 'RADIATIONS.RADIATION.REGIMENINDICATION'

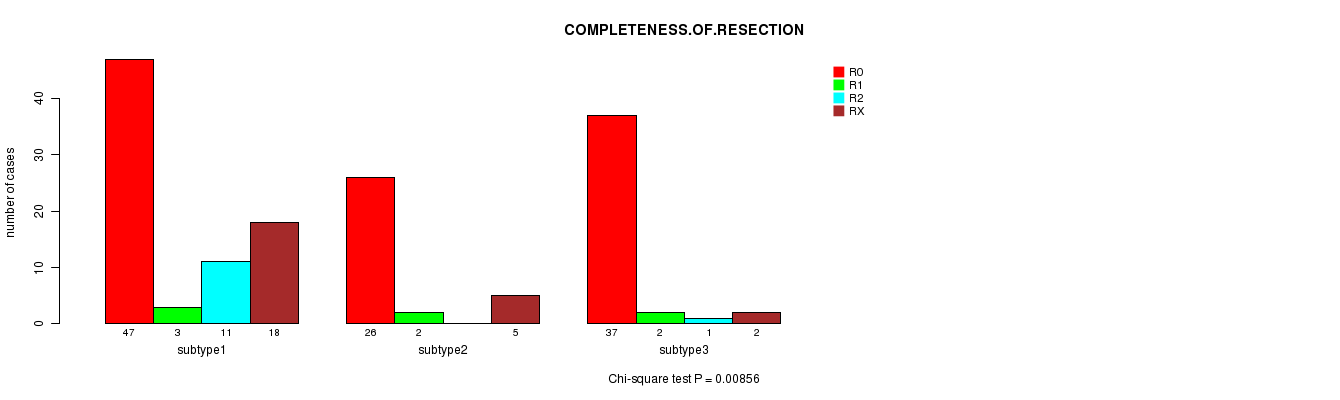
P value = 0.00856 (Chi-square test), Q value = 0.5
Table S55. Clustering Approach #5: 'MIRSEQ CNMF' versus Clinical Feature #10: 'COMPLETENESS.OF.RESECTION'
| nPatients | R0 | R1 | R2 | RX |
|---|---|---|---|---|
| ALL | 110 | 7 | 12 | 25 |
| subtype1 | 47 | 3 | 11 | 18 |
| subtype2 | 26 | 2 | 0 | 5 |
| subtype3 | 37 | 2 | 1 | 2 |
Figure S50. Get High-res Image Clustering Approach #5: 'MIRSEQ CNMF' versus Clinical Feature #10: 'COMPLETENESS.OF.RESECTION'
P value = 0.0334 (ANOVA), Q value = 1
Table S56. Clustering Approach #5: 'MIRSEQ CNMF' versus Clinical Feature #11: 'NUMBER.OF.LYMPH.NODES'
| nPatients | Mean (Std.Dev) | |
|---|---|---|
| ALL | 121 | 4.2 (5.8) |
| subtype1 | 52 | 5.0 (7.1) |
| subtype2 | 31 | 5.3 (5.2) |
| subtype3 | 38 | 2.2 (3.4) |
Figure S51. Get High-res Image Clustering Approach #5: 'MIRSEQ CNMF' versus Clinical Feature #11: 'NUMBER.OF.LYMPH.NODES'
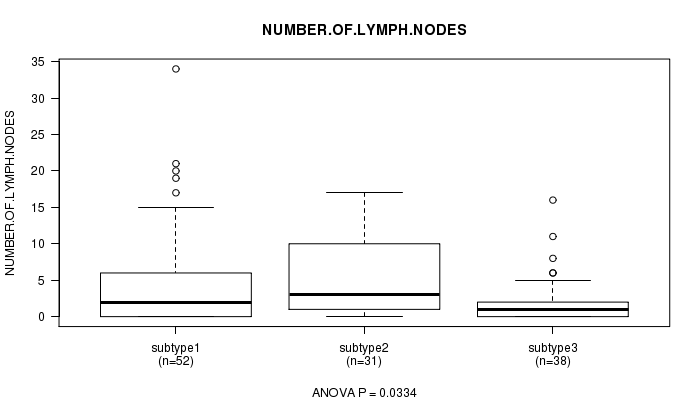
Table S57. Get Full Table Description of clustering approach #6: 'MIRSEQ CHIERARCHICAL'
| Cluster Labels | 1 | 2 | 3 |
|---|---|---|---|
| Number of samples | 41 | 73 | 51 |
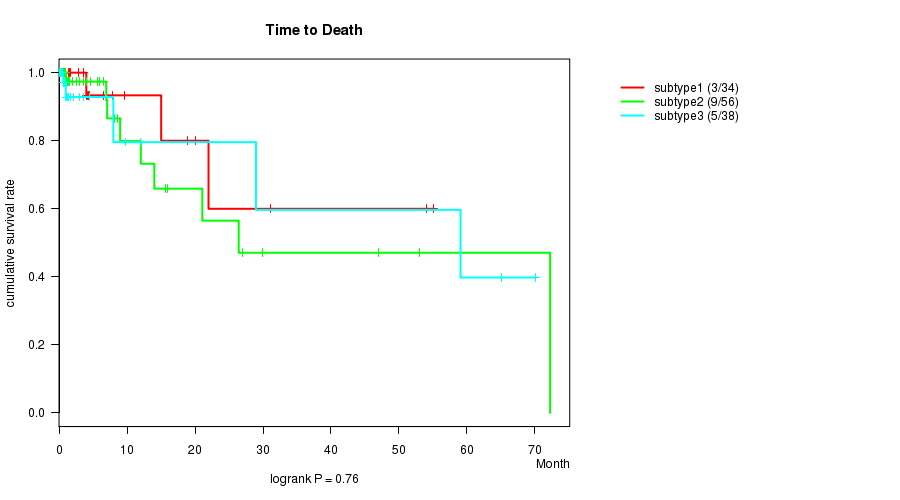
P value = 0.76 (logrank test), Q value = 1
Table S58. Clustering Approach #6: 'MIRSEQ CHIERARCHICAL' versus Clinical Feature #1: 'Time to Death'
| nPatients | nDeath | Duration Range (Median), Month | |
|---|---|---|---|
| ALL | 128 | 17 | 0.1 - 72.2 (1.4) |
| subtype1 | 34 | 3 | 0.3 - 55.0 (3.3) |
| subtype2 | 56 | 9 | 0.1 - 72.2 (1.7) |
| subtype3 | 38 | 5 | 0.1 - 70.1 (1.0) |
Figure S52. Get High-res Image Clustering Approach #6: 'MIRSEQ CHIERARCHICAL' versus Clinical Feature #1: 'Time to Death'
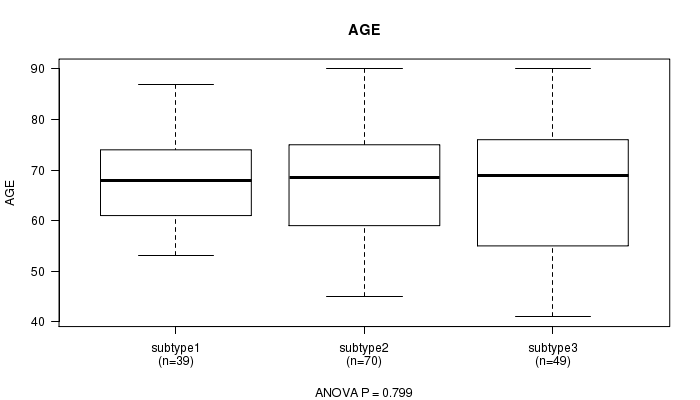
P value = 0.799 (ANOVA), Q value = 1
Table S59. Clustering Approach #6: 'MIRSEQ CHIERARCHICAL' versus Clinical Feature #2: 'AGE'
| nPatients | Mean (Std.Dev) | |
|---|---|---|
| ALL | 158 | 67.5 (10.6) |
| subtype1 | 39 | 67.8 (8.4) |
| subtype2 | 70 | 68.0 (10.1) |
| subtype3 | 49 | 66.7 (12.7) |
Figure S53. Get High-res Image Clustering Approach #6: 'MIRSEQ CHIERARCHICAL' versus Clinical Feature #2: 'AGE'
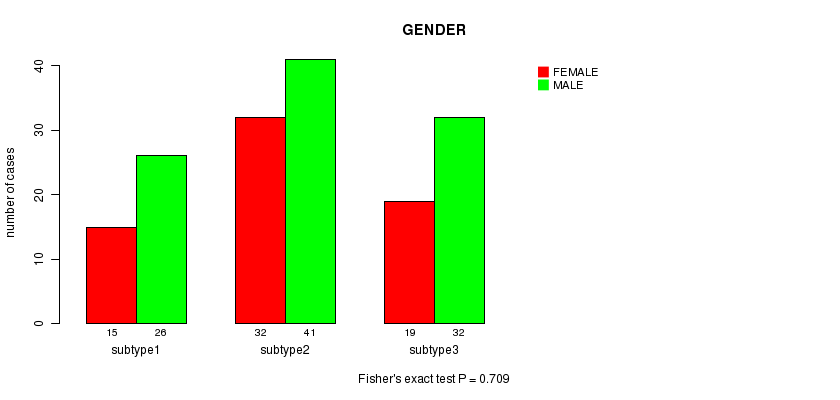
P value = 0.709 (Fisher's exact test), Q value = 1
Table S60. Clustering Approach #6: 'MIRSEQ CHIERARCHICAL' versus Clinical Feature #3: 'GENDER'
| nPatients | FEMALE | MALE |
|---|---|---|
| ALL | 66 | 99 |
| subtype1 | 15 | 26 |
| subtype2 | 32 | 41 |
| subtype3 | 19 | 32 |
Figure S54. Get High-res Image Clustering Approach #6: 'MIRSEQ CHIERARCHICAL' versus Clinical Feature #3: 'GENDER'
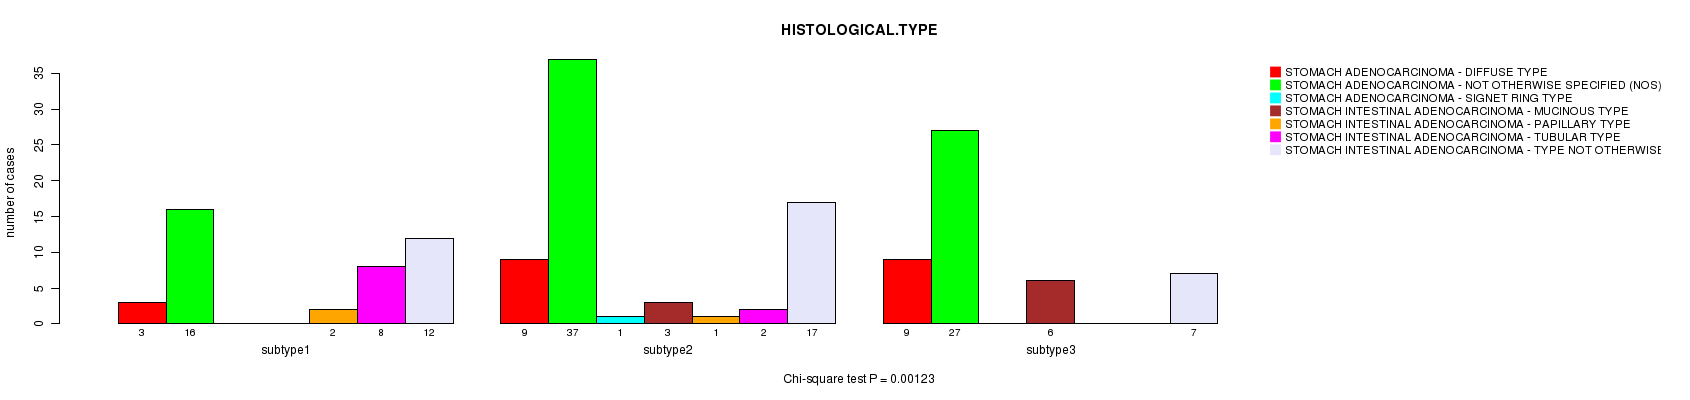
P value = 0.00123 (Chi-square test), Q value = 0.079
Table S61. Clustering Approach #6: 'MIRSEQ CHIERARCHICAL' versus Clinical Feature #4: 'HISTOLOGICAL.TYPE'
| nPatients | STOMACH ADENOCARCINOMA - DIFFUSE TYPE | STOMACH ADENOCARCINOMA - NOT OTHERWISE SPECIFIED (NOS) | STOMACH ADENOCARCINOMA - SIGNET RING TYPE | STOMACH INTESTINAL ADENOCARCINOMA - MUCINOUS TYPE | STOMACH INTESTINAL ADENOCARCINOMA - PAPILLARY TYPE | STOMACH INTESTINAL ADENOCARCINOMA - TUBULAR TYPE | STOMACH INTESTINAL ADENOCARCINOMA - TYPE NOT OTHERWISE SPECIFIED (NOS) |
|---|---|---|---|---|---|---|---|
| ALL | 21 | 80 | 1 | 9 | 3 | 10 | 36 |
| subtype1 | 3 | 16 | 0 | 0 | 2 | 8 | 12 |
| subtype2 | 9 | 37 | 1 | 3 | 1 | 2 | 17 |
| subtype3 | 9 | 27 | 0 | 6 | 0 | 0 | 7 |
Figure S55. Get High-res Image Clustering Approach #6: 'MIRSEQ CHIERARCHICAL' versus Clinical Feature #4: 'HISTOLOGICAL.TYPE'
P value = 0.175 (Chi-square test), Q value = 1
Table S62. Clustering Approach #6: 'MIRSEQ CHIERARCHICAL' versus Clinical Feature #5: 'PATHOLOGY.T'
| nPatients | T1 | T2 | T3 | T4 |
|---|---|---|---|---|
| ALL | 6 | 53 | 62 | 34 |
| subtype1 | 0 | 12 | 17 | 10 |
| subtype2 | 5 | 28 | 26 | 10 |
| subtype3 | 1 | 13 | 19 | 14 |
Figure S56. Get High-res Image Clustering Approach #6: 'MIRSEQ CHIERARCHICAL' versus Clinical Feature #5: 'PATHOLOGY.T'
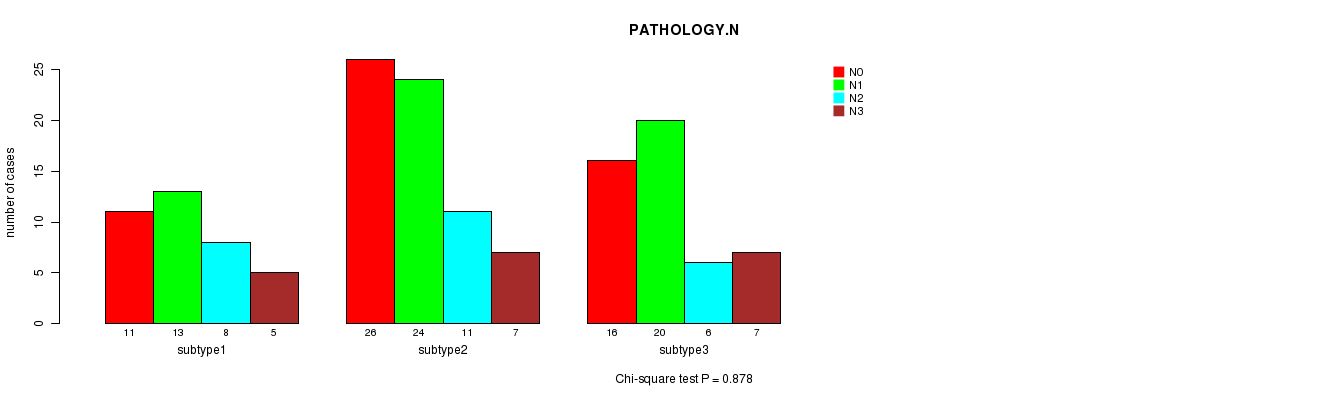
P value = 0.878 (Chi-square test), Q value = 1
Table S63. Clustering Approach #6: 'MIRSEQ CHIERARCHICAL' versus Clinical Feature #6: 'PATHOLOGY.N'
| nPatients | N0 | N1 | N2 | N3 |
|---|---|---|---|---|
| ALL | 53 | 57 | 25 | 19 |
| subtype1 | 11 | 13 | 8 | 5 |
| subtype2 | 26 | 24 | 11 | 7 |
| subtype3 | 16 | 20 | 6 | 7 |
Figure S57. Get High-res Image Clustering Approach #6: 'MIRSEQ CHIERARCHICAL' versus Clinical Feature #6: 'PATHOLOGY.N'
P value = 0.795 (Chi-square test), Q value = 1
Table S64. Clustering Approach #6: 'MIRSEQ CHIERARCHICAL' versus Clinical Feature #7: 'PATHOLOGICSPREAD(M)'
| nPatients | M0 | M1 | MX |
|---|---|---|---|
| ALL | 134 | 18 | 13 |
| subtype1 | 34 | 3 | 4 |
| subtype2 | 57 | 10 | 6 |
| subtype3 | 43 | 5 | 3 |
Figure S58. Get High-res Image Clustering Approach #6: 'MIRSEQ CHIERARCHICAL' versus Clinical Feature #7: 'PATHOLOGICSPREAD(M)'

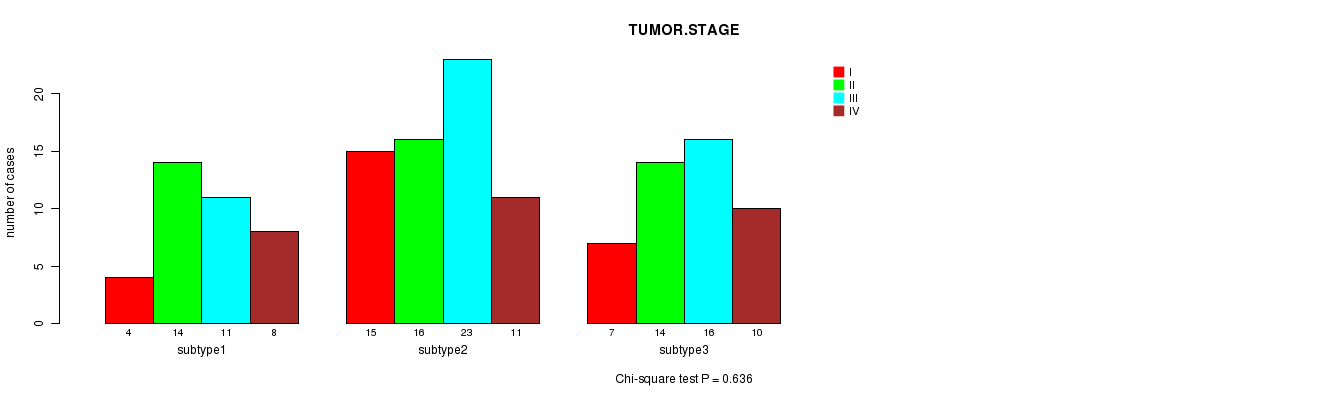
P value = 0.636 (Chi-square test), Q value = 1
Table S65. Clustering Approach #6: 'MIRSEQ CHIERARCHICAL' versus Clinical Feature #8: 'TUMOR.STAGE'
| nPatients | I | II | III | IV |
|---|---|---|---|---|
| ALL | 26 | 44 | 50 | 29 |
| subtype1 | 4 | 14 | 11 | 8 |
| subtype2 | 15 | 16 | 23 | 11 |
| subtype3 | 7 | 14 | 16 | 10 |
Figure S59. Get High-res Image Clustering Approach #6: 'MIRSEQ CHIERARCHICAL' versus Clinical Feature #8: 'TUMOR.STAGE'
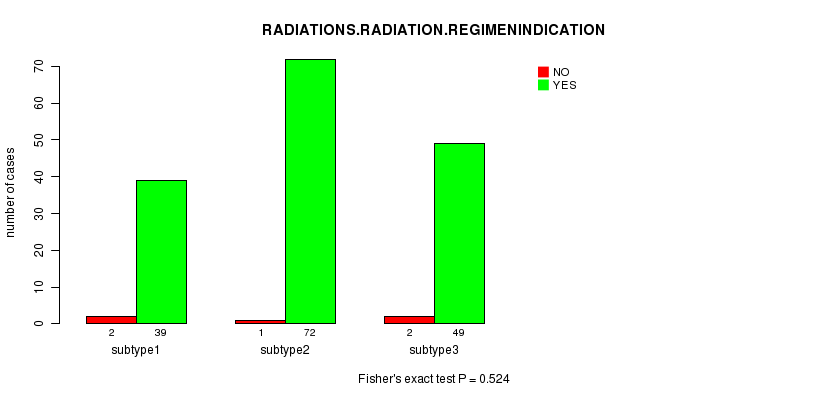
P value = 0.524 (Fisher's exact test), Q value = 1
Table S66. Clustering Approach #6: 'MIRSEQ CHIERARCHICAL' versus Clinical Feature #9: 'RADIATIONS.RADIATION.REGIMENINDICATION'
| nPatients | NO | YES |
|---|---|---|
| ALL | 5 | 160 |
| subtype1 | 2 | 39 |
| subtype2 | 1 | 72 |
| subtype3 | 2 | 49 |
Figure S60. Get High-res Image Clustering Approach #6: 'MIRSEQ CHIERARCHICAL' versus Clinical Feature #9: 'RADIATIONS.RADIATION.REGIMENINDICATION'
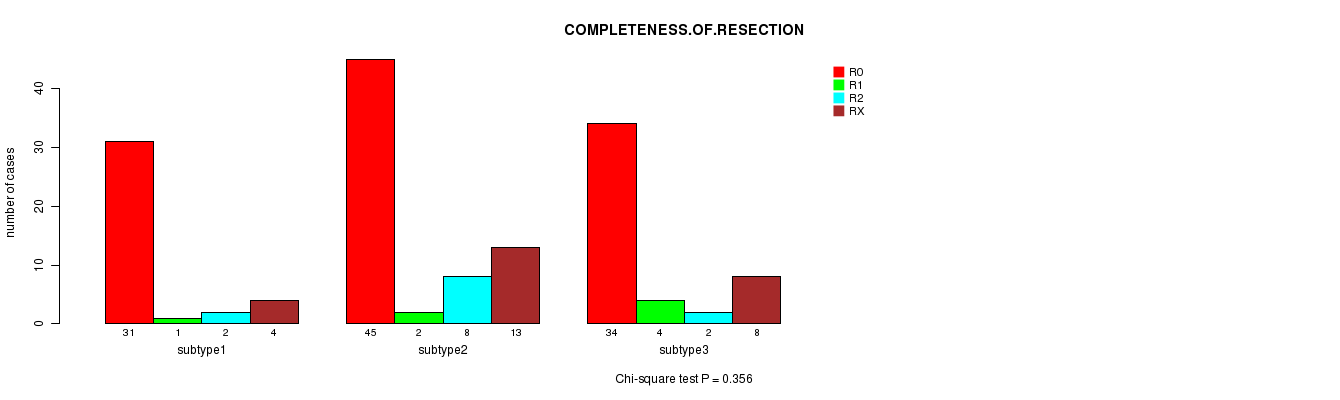
P value = 0.356 (Chi-square test), Q value = 1
Table S67. Clustering Approach #6: 'MIRSEQ CHIERARCHICAL' versus Clinical Feature #10: 'COMPLETENESS.OF.RESECTION'
| nPatients | R0 | R1 | R2 | RX |
|---|---|---|---|---|
| ALL | 110 | 7 | 12 | 25 |
| subtype1 | 31 | 1 | 2 | 4 |
| subtype2 | 45 | 2 | 8 | 13 |
| subtype3 | 34 | 4 | 2 | 8 |
Figure S61. Get High-res Image Clustering Approach #6: 'MIRSEQ CHIERARCHICAL' versus Clinical Feature #10: 'COMPLETENESS.OF.RESECTION'
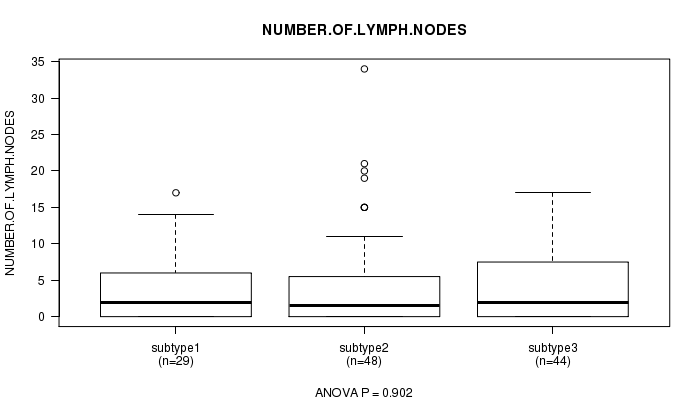
P value = 0.902 (ANOVA), Q value = 1
Table S68. Clustering Approach #6: 'MIRSEQ CHIERARCHICAL' versus Clinical Feature #11: 'NUMBER.OF.LYMPH.NODES'
| nPatients | Mean (Std.Dev) | |
|---|---|---|
| ALL | 121 | 4.2 (5.8) |
| subtype1 | 29 | 4.0 (4.7) |
| subtype2 | 48 | 4.5 (7.2) |
| subtype3 | 44 | 4.0 (4.8) |
Figure S62. Get High-res Image Clustering Approach #6: 'MIRSEQ CHIERARCHICAL' versus Clinical Feature #11: 'NUMBER.OF.LYMPH.NODES'
-
Cluster data file = STAD-TP.mergedcluster.txt
-
Clinical data file = STAD-TP.clin.merged.picked.txt
-
Number of patients = 178
-
Number of clustering approaches = 6
-
Number of selected clinical features = 11
-
Exclude small clusters that include fewer than K patients, K = 3
consensus non-negative matrix factorization clustering approach (Brunet et al. 2004)
Resampling-based clustering method (Monti et al. 2003)
For survival clinical features, the Kaplan-Meier survival curves of tumors with and without gene mutations were plotted and the statistical significance P values were estimated by logrank test (Bland and Altman 2004) using the 'survdiff' function in R
For continuous numerical clinical features, one-way analysis of variance (Howell 2002) was applied to compare the clinical values between tumor subtypes using 'anova' function in R
For binary clinical features, two-tailed Fisher's exact tests (Fisher 1922) were used to estimate the P values using the 'fisher.test' function in R
For multi-class clinical features (nominal or ordinal), Chi-square tests (Greenwood and Nikulin 1996) were used to estimate the P values using the 'chisq.test' function in R
For continuous numerical clinical features, two-tailed Student's t test with unequal variance (Lehmann and Romano 2005) was applied to compare the clinical values between two tumor subtypes using 't.test' function in R
For multiple hypothesis correction, Q value is the False Discovery Rate (FDR) analogue of the P value (Benjamini and Hochberg 1995), defined as the minimum FDR at which the test may be called significant. We used the 'Benjamini and Hochberg' method of 'p.adjust' function in R to convert P values into Q values.
This is an experimental feature. The full results of the analysis summarized in this report can be downloaded from the TCGA Data Coordination Center.