(primary solid tumor cohort)
This pipeline computes the correlation between significant copy number variation (cnv focal) genes and selected clinical features.
Testing the association between copy number variation 25 arm-level results and 15 clinical features across 309 patients, 15 significant findings detected with Q value < 0.25.
-
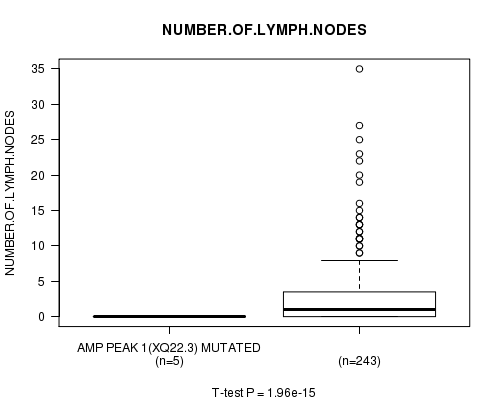
Amp Peak 1(Xq22.3) cnv correlated to 'NUMBER.OF.LYMPH.NODES'.
-
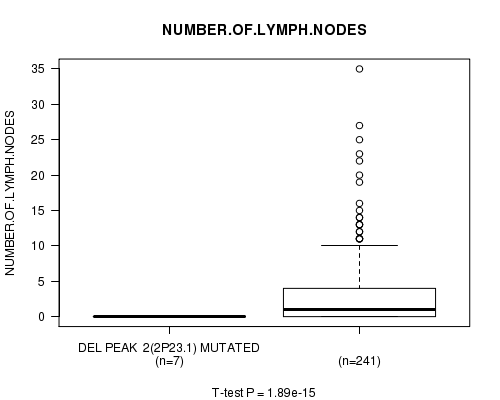
Del Peak 2(2p23.1) cnv correlated to 'NUMBER.OF.LYMPH.NODES' and 'NEOPLASM.DISEASESTAGE'.
-
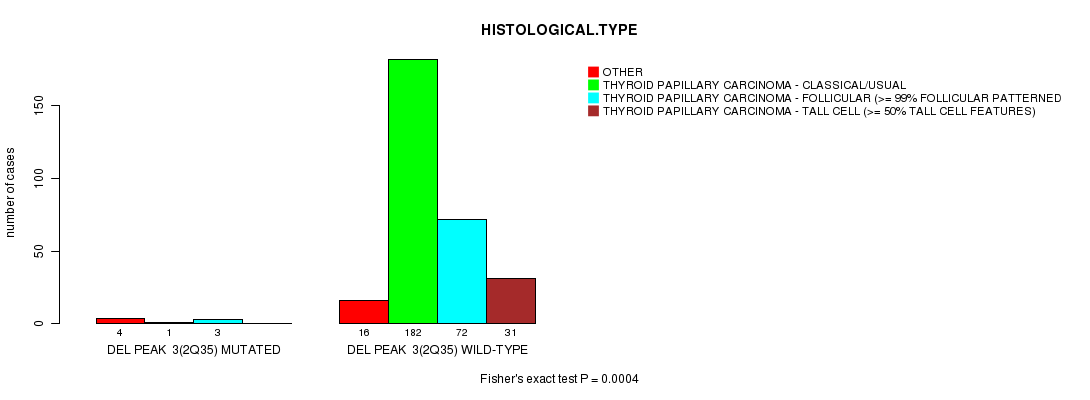
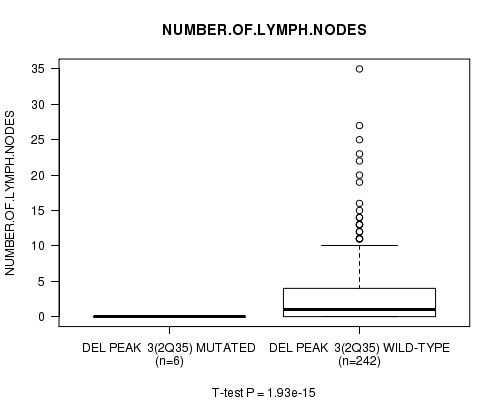
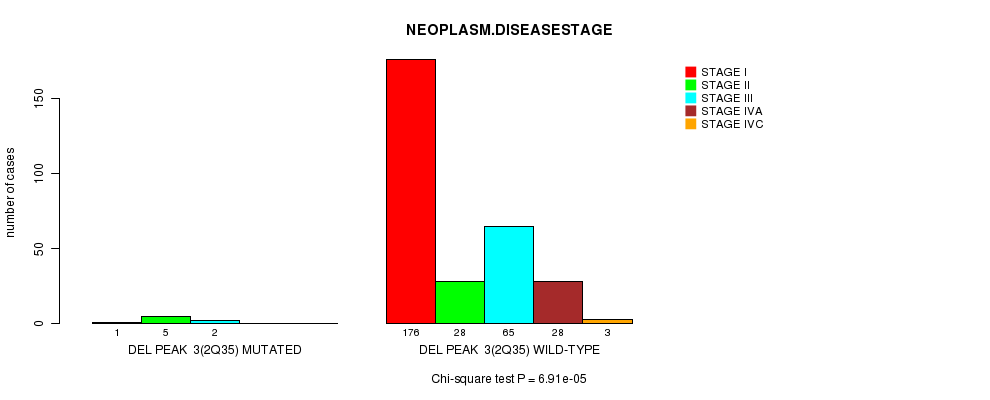
Del Peak 3(2q35) cnv correlated to 'HISTOLOGICAL.TYPE', 'NUMBER.OF.LYMPH.NODES', and 'NEOPLASM.DISEASESTAGE'.
-
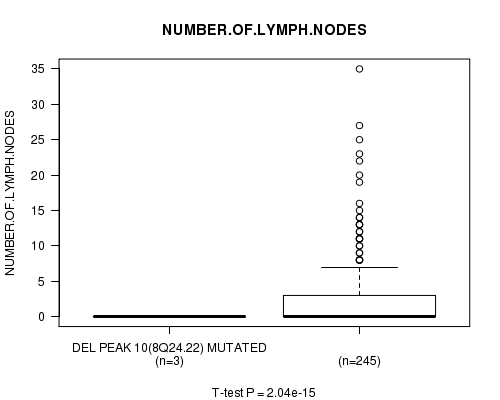
Del Peak 10(8q24.22) cnv correlated to 'NUMBER.OF.LYMPH.NODES'.
-
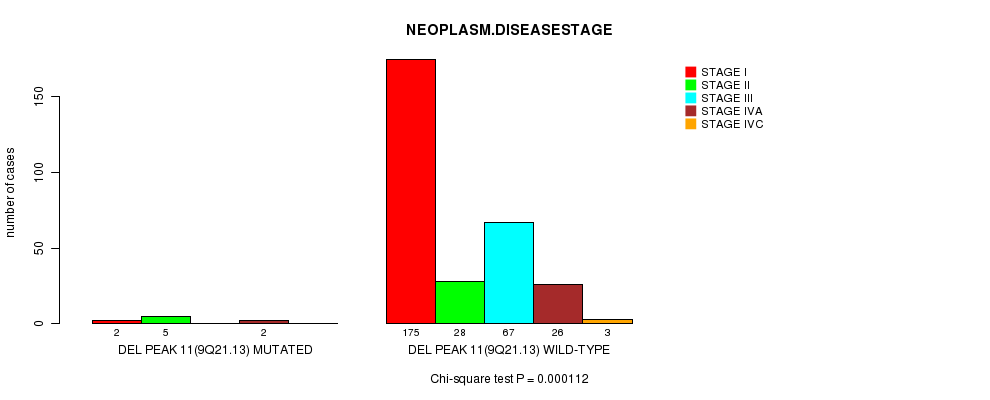
Del Peak 11(9q21.13) cnv correlated to 'NEOPLASM.DISEASESTAGE'.
-
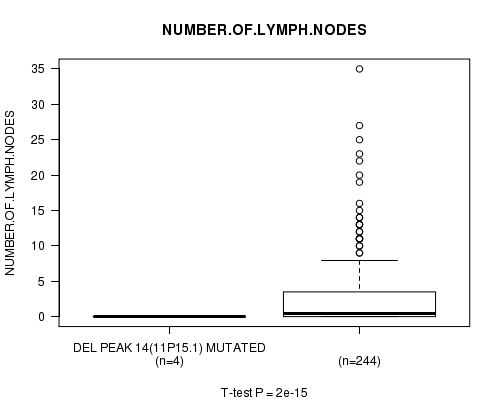
Del Peak 14(11p15.1) cnv correlated to 'NUMBER.OF.LYMPH.NODES'.
-
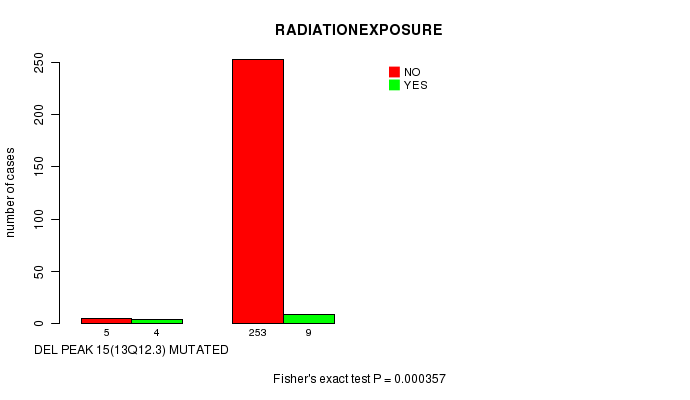
Del Peak 15(13q12.3) cnv correlated to 'RADIATIONEXPOSURE'.
-
Del Peak 17(15q25.3) cnv correlated to 'NUMBER.OF.LYMPH.NODES'.
-
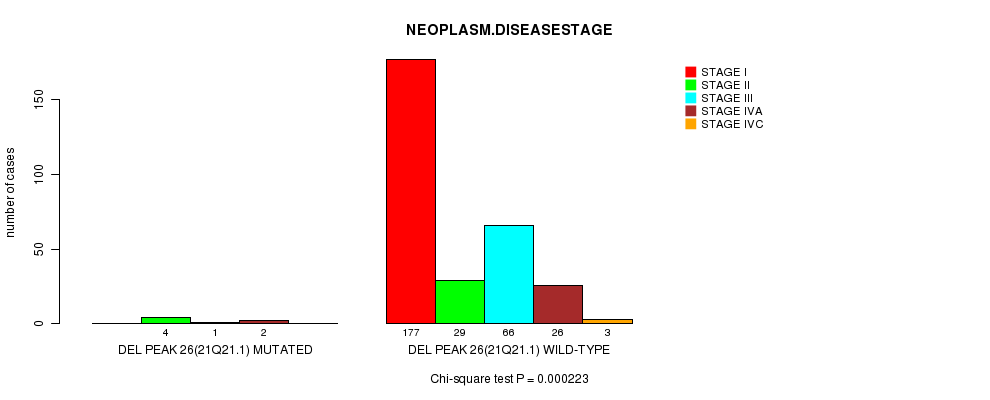
Del Peak 26(21q21.1) cnv correlated to 'NEOPLASM.DISEASESTAGE'.
-
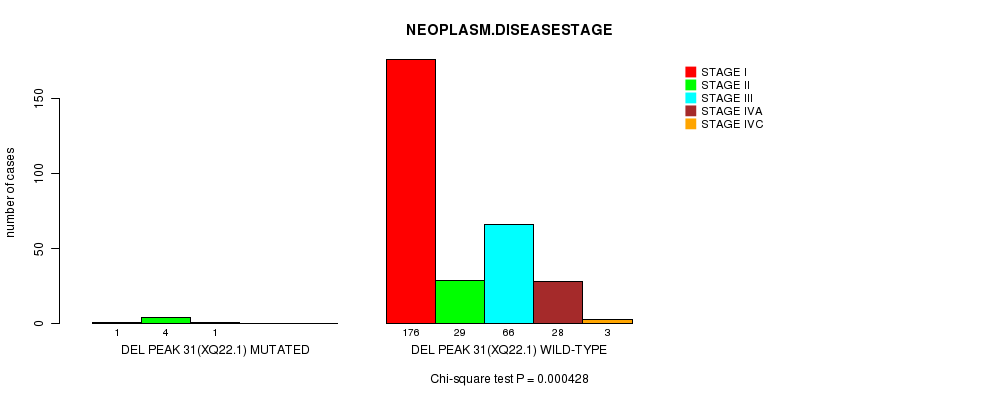
Del Peak 31(Xq22.1) cnv correlated to 'NEOPLASM.DISEASESTAGE'.
-
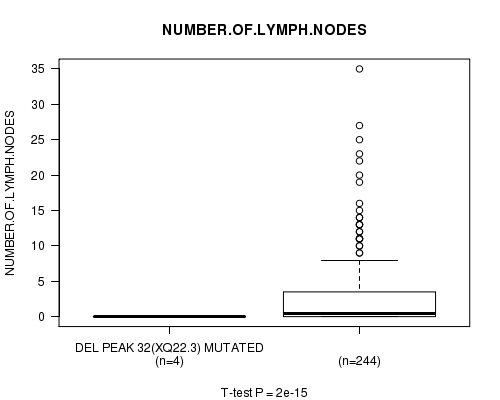
Del Peak 32(Xq22.3) cnv correlated to 'NUMBER.OF.LYMPH.NODES' and 'NEOPLASM.DISEASESTAGE'.
Table 1. Get Full Table Overview of the association between significant copy number variation of 25 arm-level results and 15 clinical features. Shown in the table are P values (Q values). Thresholded by Q value < 0.25, 15 significant findings detected.
|
Clinical Features |
Time to Death |
AGE | GENDER |
HISTOLOGICAL TYPE |
RADIATIONS RADIATION REGIMENINDICATION |
RADIATIONEXPOSURE |
DISTANT METASTASIS |
EXTRATHYROIDAL EXTENSION |
LYMPH NODE METASTASIS |
COMPLETENESS OF RESECTION |
NUMBER OF LYMPH NODES |
TUMOR STAGECODE |
NEOPLASM DISEASESTAGE |
MULTIFOCALITY |
TUMOR SIZE |
||
| nCNV (%) | nWild-Type | logrank test | t-test | Fisher's exact test | Fisher's exact test | Fisher's exact test | Fisher's exact test | Fisher's exact test | Fisher's exact test | Chi-square test | Fisher's exact test | t-test | t-test | Chi-square test | Fisher's exact test | t-test | |
| Del Peak 3(2q35) | 8 (3%) | 301 |
1 (1.00) |
0.0119 (1.00) |
0.685 (1.00) |
0.0004 (0.134) |
1 (1.00) |
1 (1.00) |
0.356 (1.00) |
0.733 (1.00) |
0.174 (1.00) |
0.172 (1.00) |
1.93e-15 (6.67e-13) |
6.91e-05 (0.0234) |
1 (1.00) |
0.134 (1.00) |
|
| Del Peak 2(2p23 1) | 9 (3%) | 300 |
1 (1.00) |
0.151 (1.00) |
0.461 (1.00) |
0.0193 (1.00) |
1 (1.00) |
1 (1.00) |
0.268 (1.00) |
0.27 (1.00) |
0.144 (1.00) |
0.581 (1.00) |
1.89e-15 (6.57e-13) |
0.000558 (0.186) |
1 (1.00) |
0.869 (1.00) |
|
| Del Peak 32(Xq22 3) | 4 (1%) | 305 |
1 (1.00) |
0.0625 (1.00) |
0.0474 (1.00) |
0.202 (1.00) |
1 (1.00) |
0.138 (1.00) |
0.168 (1.00) |
0.609 (1.00) |
0.374 (1.00) |
0.288 (1.00) |
2e-15 (6.88e-13) |
8.3e-07 (0.000282) |
1 (1.00) |
0.385 (1.00) |
|
| Amp Peak 1(Xq22 3) | 7 (2%) | 302 |
1 (1.00) |
0.098 (1.00) |
0.2 (1.00) |
0.133 (1.00) |
1 (1.00) |
1 (1.00) |
0.2 (1.00) |
1 (1.00) |
0.342 (1.00) |
0.477 (1.00) |
1.96e-15 (6.77e-13) |
0.462 (1.00) |
1 (1.00) |
0.323 (1.00) |
|
| Del Peak 10(8q24 22) | 5 (2%) | 304 |
1 (1.00) |
0.0552 (1.00) |
0.0976 (1.00) |
0.0281 (1.00) |
1 (1.00) |
1 (1.00) |
0.696 (1.00) |
1 (1.00) |
0.463 (1.00) |
0.355 (1.00) |
2.04e-15 (6.94e-13) |
0.0034 (1.00) |
1 (1.00) |
0.158 (1.00) |
|
| Del Peak 11(9q21 13) | 9 (3%) | 300 |
1 (1.00) |
0.257 (1.00) |
1 (1.00) |
0.202 (1.00) |
0.345 (1.00) |
0.329 (1.00) |
0.268 (1.00) |
0.27 (1.00) |
0.274 (1.00) |
0.581 (1.00) |
0.845 (1.00) |
0.000112 (0.0378) |
1 (1.00) |
0.327 (1.00) |
|
| Del Peak 14(11p15 1) | 4 (1%) | 305 |
0.00468 (1.00) |
0.0308 (1.00) |
0.254 (1.00) |
0.141 (1.00) |
0.17 (1.00) |
1 (1.00) |
0.168 (1.00) |
0.609 (1.00) |
0.374 (1.00) |
0.288 (1.00) |
2e-15 (6.88e-13) |
0.492 (1.00) |
0.622 (1.00) |
0.203 (1.00) |
|
| Del Peak 15(13q12 3) | 10 (3%) | 299 |
0.00468 (1.00) |
0.0126 (1.00) |
0.0702 (1.00) |
0.106 (1.00) |
0.375 (1.00) |
0.000357 (0.12) |
0.217 (1.00) |
0.562 (1.00) |
0.29 (1.00) |
0.464 (1.00) |
0.0381 (1.00) |
0.099 (1.00) |
0.75 (1.00) |
0.105 (1.00) |
|
| Del Peak 17(15q25 3) | 4 (1%) | 305 |
1 (1.00) |
0.24 (1.00) |
0.575 (1.00) |
0.141 (1.00) |
1 (1.00) |
1 (1.00) |
0.168 (1.00) |
1 (1.00) |
0.374 (1.00) |
0.478 (1.00) |
2e-15 (6.88e-13) |
0.0394 (1.00) |
0.622 (1.00) |
0.527 (1.00) |
|
| Del Peak 26(21q21 1) | 7 (2%) | 302 |
1 (1.00) |
0.00405 (1.00) |
0.682 (1.00) |
0.439 (1.00) |
1 (1.00) |
1 (1.00) |
0.498 (1.00) |
1 (1.00) |
0.341 (1.00) |
0.188 (1.00) |
0.979 (1.00) |
0.000223 (0.075) |
1 (1.00) |
0.595 (1.00) |
|
| Del Peak 31(Xq22 1) | 6 (2%) | 303 |
1 (1.00) |
0.174 (1.00) |
0.034 (1.00) |
0.133 (1.00) |
1 (1.00) |
0.219 (1.00) |
0.275 (1.00) |
0.418 (1.00) |
0.465 (1.00) |
0.23 (1.00) |
0.676 (1.00) |
0.000428 (0.143) |
0.684 (1.00) |
0.803 (1.00) |
|
| Del Peak 6(6q22 31) | 4 (1%) | 305 |
0.00468 (1.00) |
0.194 (1.00) |
1 (1.00) |
0.798 (1.00) |
0.17 (1.00) |
1 (1.00) |
0.168 (1.00) |
0.609 (1.00) |
0.773 (1.00) |
1 (1.00) |
0.00876 (1.00) |
0.0665 (1.00) |
0.622 (1.00) |
0.0277 (1.00) |
|
| Del Peak 8(7q34) | 4 (1%) | 305 |
1 (1.00) |
0.749 (1.00) |
1 (1.00) |
0.244 (1.00) |
1 (1.00) |
1 (1.00) |
1 (1.00) |
0.609 (1.00) |
0.773 (1.00) |
1 (1.00) |
0.401 (1.00) |
0.685 (1.00) |
0.622 (1.00) |
0.256 (1.00) |
|
| Del Peak 12(10q21 2) | 7 (2%) | 302 |
1 (1.00) |
0.551 (1.00) |
0.682 (1.00) |
0.0648 (1.00) |
0.28 (1.00) |
1 (1.00) |
1 (1.00) |
1 (1.00) |
0.588 (1.00) |
0.682 (1.00) |
0.319 (1.00) |
0.581 (1.00) |
1 (1.00) |
0.0189 (1.00) |
|
| Del Peak 13(10q23 31) | 8 (3%) | 301 |
1 (1.00) |
0.0192 (1.00) |
0.412 (1.00) |
0.0233 (1.00) |
1 (1.00) |
1 (1.00) |
0.752 (1.00) |
0.733 (1.00) |
0.233 (1.00) |
1 (1.00) |
0.0686 (1.00) |
0.0078 (1.00) |
1 (1.00) |
0.03 (1.00) |
|
| Del Peak 16(13q14 3) | 13 (4%) | 296 |
0.00468 (1.00) |
0.171 (1.00) |
0.32 (1.00) |
0.164 (1.00) |
0.112 (1.00) |
0.000886 (0.294) |
0.33 (1.00) |
0.459 (1.00) |
0.157 (1.00) |
0.845 (1.00) |
0.0445 (1.00) |
0.484 (1.00) |
0.378 (1.00) |
0.274 (1.00) |
|
| Del Peak 19(16q23 3) | 3 (1%) | 306 |
1 (1.00) |
0.316 (1.00) |
1 (1.00) |
0.0215 (1.00) |
1 (1.00) |
0.138 (1.00) |
1 (1.00) |
0.198 (1.00) |
0.709 (1.00) |
0.219 (1.00) |
0.0653 (1.00) |
0.143 (1.00) |
1 (1.00) |
||
| Del Peak 20(17p13 1) | 5 (2%) | 304 |
1 (1.00) |
0.928 (1.00) |
0.339 (1.00) |
0.363 (1.00) |
0.0177 (1.00) |
1 (1.00) |
0.412 (1.00) |
0.11 (1.00) |
0.281 (1.00) |
1 (1.00) |
0.319 (1.00) |
0.188 (1.00) |
0.371 (1.00) |
0.277 (1.00) |
|
| Del Peak 21(18p11 21) | 3 (1%) | 306 |
1 (1.00) |
0.971 (1.00) |
1 (1.00) |
1 (1.00) |
1 (1.00) |
1 (1.00) |
1 (1.00) |
1 (1.00) |
0.861 (1.00) |
1 (1.00) |
0.0653 (1.00) |
0.0384 (1.00) |
1 (1.00) |
0.655 (1.00) |
|
| Del Peak 22(18q22 2) | 3 (1%) | 306 |
1 (1.00) |
0.971 (1.00) |
1 (1.00) |
1 (1.00) |
1 (1.00) |
1 (1.00) |
1 (1.00) |
1 (1.00) |
0.861 (1.00) |
1 (1.00) |
0.0653 (1.00) |
0.0384 (1.00) |
1 (1.00) |
0.655 (1.00) |
|
| Del Peak 23(19p13 2) | 3 (1%) | 306 |
1 (1.00) |
0.109 (1.00) |
0.573 (1.00) |
0.0425 (1.00) |
1 (1.00) |
1 (1.00) |
0.627 (1.00) |
0.592 (1.00) |
0.0257 (1.00) |
0.219 (1.00) |
0.691 (1.00) |
0.247 (1.00) |
|||
| Del Peak 27(22q13 1) | 55 (18%) | 254 |
0.724 (1.00) |
0.647 (1.00) |
0.73 (1.00) |
0.0651 (1.00) |
0.478 (1.00) |
0.473 (1.00) |
0.826 (1.00) |
0.386 (1.00) |
0.575 (1.00) |
0.467 (1.00) |
0.566 (1.00) |
0.845 (1.00) |
0.226 (1.00) |
0.321 (1.00) |
|
| Del Peak 28(22q13 2) | 55 (18%) | 254 |
0.724 (1.00) |
0.647 (1.00) |
0.73 (1.00) |
0.0651 (1.00) |
0.478 (1.00) |
0.473 (1.00) |
0.826 (1.00) |
0.386 (1.00) |
0.575 (1.00) |
0.467 (1.00) |
0.566 (1.00) |
0.845 (1.00) |
0.226 (1.00) |
0.321 (1.00) |
|
| Del Peak 29(22q13 31) | 55 (18%) | 254 |
0.724 (1.00) |
0.647 (1.00) |
0.73 (1.00) |
0.0651 (1.00) |
0.478 (1.00) |
0.473 (1.00) |
0.826 (1.00) |
0.386 (1.00) |
0.575 (1.00) |
0.467 (1.00) |
0.566 (1.00) |
0.845 (1.00) |
0.226 (1.00) |
0.321 (1.00) |
|
| Del Peak 30(22q13 32) | 56 (18%) | 253 |
0.724 (1.00) |
0.692 (1.00) |
0.61 (1.00) |
0.0377 (1.00) |
0.478 (1.00) |
0.473 (1.00) |
0.838 (1.00) |
0.386 (1.00) |
0.517 (1.00) |
0.467 (1.00) |
0.5 (1.00) |
0.854 (1.00) |
0.176 (1.00) |
0.321 (1.00) |
P value = 1.96e-15 (t-test), Q value = 6.8e-13
Table S1. Gene #1: 'Amp Peak 1(Xq22.3) mutation analysis' versus Clinical Feature #11: 'NUMBER.OF.LYMPH.NODES'
| nPatients | Mean (Std.Dev) | |
|---|---|---|
| ALL | 248 | 2.7 (5.1) |
| AMP PEAK 1(XQ22.3) MUTATED | 5 | 0.0 (0.0) |
| AMP PEAK 1(XQ22.3) WILD-TYPE | 243 | 2.8 (5.1) |
Figure S1. Get High-res Image Gene #1: 'Amp Peak 1(Xq22.3) mutation analysis' versus Clinical Feature #11: 'NUMBER.OF.LYMPH.NODES'
P value = 1.89e-15 (t-test), Q value = 6.6e-13
Table S2. Gene #2: 'Del Peak 2(2p23.1) mutation analysis' versus Clinical Feature #11: 'NUMBER.OF.LYMPH.NODES'
| nPatients | Mean (Std.Dev) | |
|---|---|---|
| ALL | 248 | 2.7 (5.1) |
| DEL PEAK 2(2P23.1) MUTATED | 7 | 0.0 (0.0) |
| DEL PEAK 2(2P23.1) WILD-TYPE | 241 | 2.8 (5.1) |
Figure S2. Get High-res Image Gene #2: 'Del Peak 2(2p23.1) mutation analysis' versus Clinical Feature #11: 'NUMBER.OF.LYMPH.NODES'
P value = 0.000558 (Chi-square test), Q value = 0.19
Table S3. Gene #2: 'Del Peak 2(2p23.1) mutation analysis' versus Clinical Feature #13: 'NEOPLASM.DISEASESTAGE'
| nPatients | STAGE I | STAGE II | STAGE III | STAGE IVA | STAGE IVC |
|---|---|---|---|---|---|
| ALL | 177 | 33 | 67 | 28 | 3 |
| DEL PEAK 2(2P23.1) MUTATED | 3 | 5 | 1 | 0 | 0 |
| DEL PEAK 2(2P23.1) WILD-TYPE | 174 | 28 | 66 | 28 | 3 |
Figure S3. Get High-res Image Gene #2: 'Del Peak 2(2p23.1) mutation analysis' versus Clinical Feature #13: 'NEOPLASM.DISEASESTAGE'

P value = 4e-04 (Fisher's exact test), Q value = 0.13
Table S4. Gene #3: 'Del Peak 3(2q35) mutation analysis' versus Clinical Feature #4: 'HISTOLOGICAL.TYPE'
| nPatients | OTHER | THYROID PAPILLARY CARCINOMA - CLASSICAL/USUAL | THYROID PAPILLARY CARCINOMA - FOLLICULAR (>= 99% FOLLICULAR PATTERNED) | THYROID PAPILLARY CARCINOMA - TALL CELL (>= 50% TALL CELL FEATURES) |
|---|---|---|---|---|
| ALL | 20 | 183 | 75 | 31 |
| DEL PEAK 3(2Q35) MUTATED | 4 | 1 | 3 | 0 |
| DEL PEAK 3(2Q35) WILD-TYPE | 16 | 182 | 72 | 31 |
Figure S4. Get High-res Image Gene #3: 'Del Peak 3(2q35) mutation analysis' versus Clinical Feature #4: 'HISTOLOGICAL.TYPE'
P value = 1.93e-15 (t-test), Q value = 6.7e-13
Table S5. Gene #3: 'Del Peak 3(2q35) mutation analysis' versus Clinical Feature #11: 'NUMBER.OF.LYMPH.NODES'
| nPatients | Mean (Std.Dev) | |
|---|---|---|
| ALL | 248 | 2.7 (5.1) |
| DEL PEAK 3(2Q35) MUTATED | 6 | 0.0 (0.0) |
| DEL PEAK 3(2Q35) WILD-TYPE | 242 | 2.8 (5.1) |
Figure S5. Get High-res Image Gene #3: 'Del Peak 3(2q35) mutation analysis' versus Clinical Feature #11: 'NUMBER.OF.LYMPH.NODES'
P value = 6.91e-05 (Chi-square test), Q value = 0.023
Table S6. Gene #3: 'Del Peak 3(2q35) mutation analysis' versus Clinical Feature #13: 'NEOPLASM.DISEASESTAGE'
| nPatients | STAGE I | STAGE II | STAGE III | STAGE IVA | STAGE IVC |
|---|---|---|---|---|---|
| ALL | 177 | 33 | 67 | 28 | 3 |
| DEL PEAK 3(2Q35) MUTATED | 1 | 5 | 2 | 0 | 0 |
| DEL PEAK 3(2Q35) WILD-TYPE | 176 | 28 | 65 | 28 | 3 |
Figure S6. Get High-res Image Gene #3: 'Del Peak 3(2q35) mutation analysis' versus Clinical Feature #13: 'NEOPLASM.DISEASESTAGE'
P value = 2.04e-15 (t-test), Q value = 6.9e-13
Table S7. Gene #6: 'Del Peak 10(8q24.22) mutation analysis' versus Clinical Feature #11: 'NUMBER.OF.LYMPH.NODES'
| nPatients | Mean (Std.Dev) | |
|---|---|---|
| ALL | 248 | 2.7 (5.1) |
| DEL PEAK 10(8Q24.22) MUTATED | 3 | 0.0 (0.0) |
| DEL PEAK 10(8Q24.22) WILD-TYPE | 245 | 2.8 (5.1) |
Figure S7. Get High-res Image Gene #6: 'Del Peak 10(8q24.22) mutation analysis' versus Clinical Feature #11: 'NUMBER.OF.LYMPH.NODES'
P value = 0.000112 (Chi-square test), Q value = 0.038
Table S8. Gene #7: 'Del Peak 11(9q21.13) mutation analysis' versus Clinical Feature #13: 'NEOPLASM.DISEASESTAGE'
| nPatients | STAGE I | STAGE II | STAGE III | STAGE IVA | STAGE IVC |
|---|---|---|---|---|---|
| ALL | 177 | 33 | 67 | 28 | 3 |
| DEL PEAK 11(9Q21.13) MUTATED | 2 | 5 | 0 | 2 | 0 |
| DEL PEAK 11(9Q21.13) WILD-TYPE | 175 | 28 | 67 | 26 | 3 |
Figure S8. Get High-res Image Gene #7: 'Del Peak 11(9q21.13) mutation analysis' versus Clinical Feature #13: 'NEOPLASM.DISEASESTAGE'
P value = 2e-15 (t-test), Q value = 6.9e-13
Table S9. Gene #10: 'Del Peak 14(11p15.1) mutation analysis' versus Clinical Feature #11: 'NUMBER.OF.LYMPH.NODES'
| nPatients | Mean (Std.Dev) | |
|---|---|---|
| ALL | 248 | 2.7 (5.1) |
| DEL PEAK 14(11P15.1) MUTATED | 4 | 0.0 (0.0) |
| DEL PEAK 14(11P15.1) WILD-TYPE | 244 | 2.8 (5.1) |
Figure S9. Get High-res Image Gene #10: 'Del Peak 14(11p15.1) mutation analysis' versus Clinical Feature #11: 'NUMBER.OF.LYMPH.NODES'
P value = 0.000357 (Fisher's exact test), Q value = 0.12
Table S10. Gene #11: 'Del Peak 15(13q12.3) mutation analysis' versus Clinical Feature #6: 'RADIATIONEXPOSURE'
| nPatients | NO | YES |
|---|---|---|
| ALL | 258 | 13 |
| DEL PEAK 15(13Q12.3) MUTATED | 5 | 4 |
| DEL PEAK 15(13Q12.3) WILD-TYPE | 253 | 9 |
Figure S10. Get High-res Image Gene #11: 'Del Peak 15(13q12.3) mutation analysis' versus Clinical Feature #6: 'RADIATIONEXPOSURE'
P value = 2e-15 (t-test), Q value = 6.9e-13
Table S11. Gene #13: 'Del Peak 17(15q25.3) mutation analysis' versus Clinical Feature #11: 'NUMBER.OF.LYMPH.NODES'
| nPatients | Mean (Std.Dev) | |
|---|---|---|
| ALL | 248 | 2.7 (5.1) |
| DEL PEAK 17(15Q25.3) MUTATED | 4 | 0.0 (0.0) |
| DEL PEAK 17(15Q25.3) WILD-TYPE | 244 | 2.8 (5.1) |
Figure S11. Get High-res Image Gene #13: 'Del Peak 17(15q25.3) mutation analysis' versus Clinical Feature #11: 'NUMBER.OF.LYMPH.NODES'

P value = 0.000223 (Chi-square test), Q value = 0.075
Table S12. Gene #19: 'Del Peak 26(21q21.1) mutation analysis' versus Clinical Feature #13: 'NEOPLASM.DISEASESTAGE'
| nPatients | STAGE I | STAGE II | STAGE III | STAGE IVA | STAGE IVC |
|---|---|---|---|---|---|
| ALL | 177 | 33 | 67 | 28 | 3 |
| DEL PEAK 26(21Q21.1) MUTATED | 0 | 4 | 1 | 2 | 0 |
| DEL PEAK 26(21Q21.1) WILD-TYPE | 177 | 29 | 66 | 26 | 3 |
Figure S12. Get High-res Image Gene #19: 'Del Peak 26(21q21.1) mutation analysis' versus Clinical Feature #13: 'NEOPLASM.DISEASESTAGE'
P value = 0.000428 (Chi-square test), Q value = 0.14
Table S13. Gene #24: 'Del Peak 31(Xq22.1) mutation analysis' versus Clinical Feature #13: 'NEOPLASM.DISEASESTAGE'
| nPatients | STAGE I | STAGE II | STAGE III | STAGE IVA | STAGE IVC |
|---|---|---|---|---|---|
| ALL | 177 | 33 | 67 | 28 | 3 |
| DEL PEAK 31(XQ22.1) MUTATED | 1 | 4 | 1 | 0 | 0 |
| DEL PEAK 31(XQ22.1) WILD-TYPE | 176 | 29 | 66 | 28 | 3 |
Figure S13. Get High-res Image Gene #24: 'Del Peak 31(Xq22.1) mutation analysis' versus Clinical Feature #13: 'NEOPLASM.DISEASESTAGE'
P value = 2e-15 (t-test), Q value = 6.9e-13
Table S14. Gene #25: 'Del Peak 32(Xq22.3) mutation analysis' versus Clinical Feature #11: 'NUMBER.OF.LYMPH.NODES'
| nPatients | Mean (Std.Dev) | |
|---|---|---|
| ALL | 248 | 2.7 (5.1) |
| DEL PEAK 32(XQ22.3) MUTATED | 4 | 0.0 (0.0) |
| DEL PEAK 32(XQ22.3) WILD-TYPE | 244 | 2.8 (5.1) |
Figure S14. Get High-res Image Gene #25: 'Del Peak 32(Xq22.3) mutation analysis' versus Clinical Feature #11: 'NUMBER.OF.LYMPH.NODES'
P value = 8.3e-07 (Chi-square test), Q value = 0.00028
Table S15. Gene #25: 'Del Peak 32(Xq22.3) mutation analysis' versus Clinical Feature #13: 'NEOPLASM.DISEASESTAGE'
| nPatients | STAGE I | STAGE II | STAGE III | STAGE IVA | STAGE IVC |
|---|---|---|---|---|---|
| ALL | 177 | 33 | 67 | 28 | 3 |
| DEL PEAK 32(XQ22.3) MUTATED | 0 | 4 | 0 | 0 | 0 |
| DEL PEAK 32(XQ22.3) WILD-TYPE | 177 | 29 | 67 | 28 | 3 |
Figure S15. Get High-res Image Gene #25: 'Del Peak 32(Xq22.3) mutation analysis' versus Clinical Feature #13: 'NEOPLASM.DISEASESTAGE'

-
Mutation data file = all_lesions.conf_99.cnv.cluster.txt
-
Clinical data file = THCA-TP.clin.merged.picked.txt
-
Number of patients = 309
-
Number of significantly arm-level cnvs = 25
-
Number of selected clinical features = 15
-
Exclude genes that fewer than K tumors have mutations, K = 3
For survival clinical features, the Kaplan-Meier survival curves of tumors with and without gene mutations were plotted and the statistical significance P values were estimated by logrank test (Bland and Altman 2004) using the 'survdiff' function in R
For continuous numerical clinical features, two-tailed Student's t test with unequal variance (Lehmann and Romano 2005) was applied to compare the clinical values between tumors with and without gene mutations using 't.test' function in R
For binary or multi-class clinical features (nominal or ordinal), two-tailed Fisher's exact tests (Fisher 1922) were used to estimate the P values using the 'fisher.test' function in R
For multi-class clinical features (nominal or ordinal), Chi-square tests (Greenwood and Nikulin 1996) were used to estimate the P values using the 'chisq.test' function in R
For multiple hypothesis correction, Q value is the False Discovery Rate (FDR) analogue of the P value (Benjamini and Hochberg 1995), defined as the minimum FDR at which the test may be called significant. We used the 'Benjamini and Hochberg' method of 'p.adjust' function in R to convert P values into Q values.
This is an experimental feature. The full results of the analysis summarized in this report can be downloaded from the TCGA Data Coordination Center.