(primary solid tumor cohort)
This pipeline computes the correlation between significant arm-level copy number variations (cnvs) and selected clinical features.
Testing the association between copy number variation 36 arm-level results and 15 clinical features across 309 patients, 29 significant findings detected with Q value < 0.25.
-
4p gain cnv correlated to 'NUMBER.OF.LYMPH.NODES'.
-
4q gain cnv correlated to 'NUMBER.OF.LYMPH.NODES'.
-
5p gain cnv correlated to 'NUMBER.OF.LYMPH.NODES'.
-
5q gain cnv correlated to 'NUMBER.OF.LYMPH.NODES'.
-
7p gain cnv correlated to 'NUMBER.OF.LYMPH.NODES'.
-
7q gain cnv correlated to 'NUMBER.OF.LYMPH.NODES'.
-
12p gain cnv correlated to 'NUMBER.OF.LYMPH.NODES'.
-
12q gain cnv correlated to 'NUMBER.OF.LYMPH.NODES'.
-
14q gain cnv correlated to 'NUMBER.OF.LYMPH.NODES'.
-
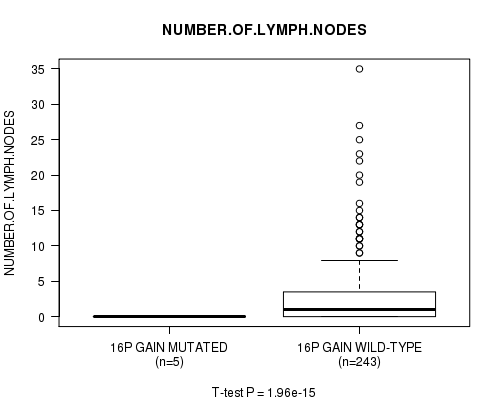
16p gain cnv correlated to 'NUMBER.OF.LYMPH.NODES'.
-
16q gain cnv correlated to 'NUMBER.OF.LYMPH.NODES'.
-
17p gain cnv correlated to 'NUMBER.OF.LYMPH.NODES'.
-
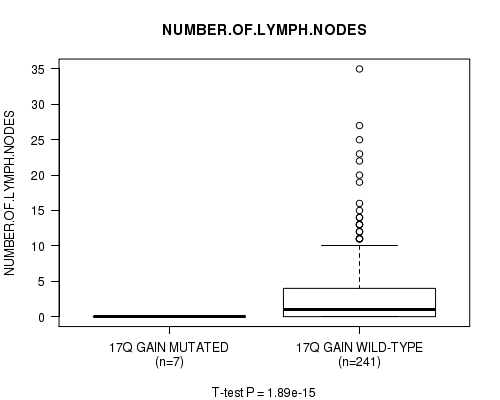
17q gain cnv correlated to 'NUMBER.OF.LYMPH.NODES'.
-
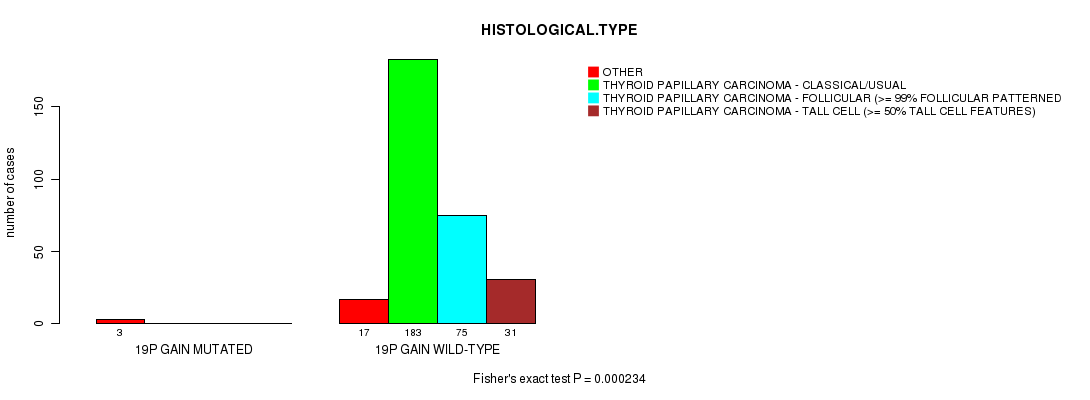
19p gain cnv correlated to 'HISTOLOGICAL.TYPE' and 'NUMBER.OF.LYMPH.NODES'.
-
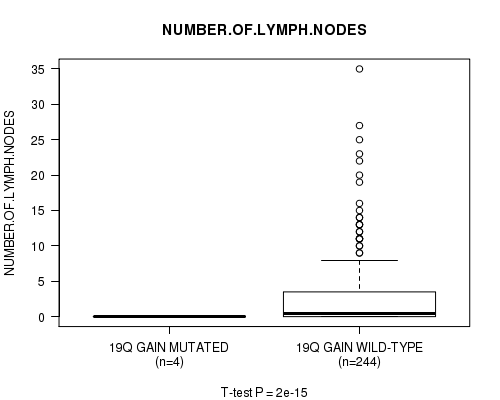
19q gain cnv correlated to 'NUMBER.OF.LYMPH.NODES'.
-
20p gain cnv correlated to 'NUMBER.OF.LYMPH.NODES'.
-
20q gain cnv correlated to 'NUMBER.OF.LYMPH.NODES'.
-
2p loss cnv correlated to 'NUMBER.OF.LYMPH.NODES'.
-
2q loss cnv correlated to 'NUMBER.OF.LYMPH.NODES' and 'NEOPLASM.DISEASESTAGE'.
-
3q loss cnv correlated to 'NUMBER.OF.LYMPH.NODES'.
-
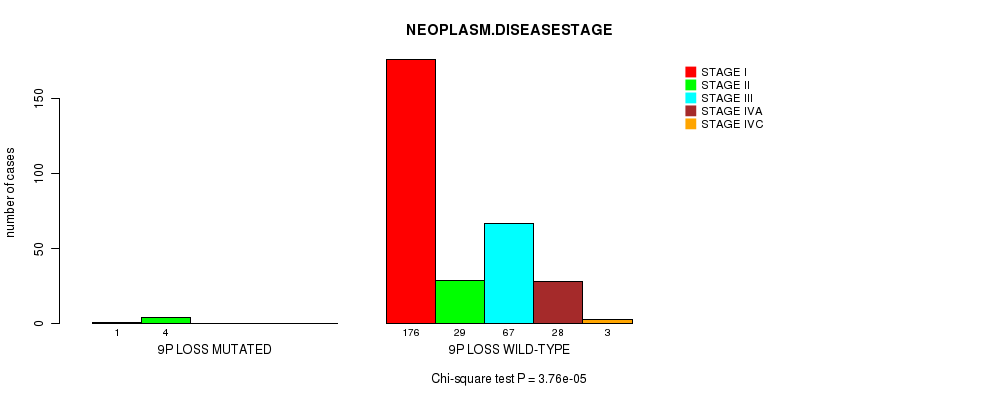
9p loss cnv correlated to 'NEOPLASM.DISEASESTAGE'.
-
9q loss cnv correlated to 'NEOPLASM.DISEASESTAGE'.
-
10p loss cnv correlated to 'NUMBER.OF.LYMPH.NODES'.
-
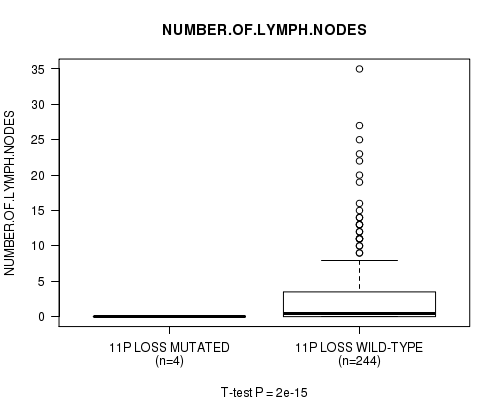
11p loss cnv correlated to 'NUMBER.OF.LYMPH.NODES'.
-
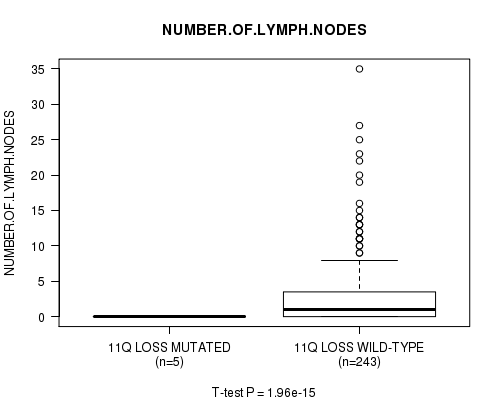
11q loss cnv correlated to 'NUMBER.OF.LYMPH.NODES'.
-
13q loss cnv correlated to 'NUMBER.OF.LYMPH.NODES'.
-
15q loss cnv correlated to 'NUMBER.OF.LYMPH.NODES'.
Table 1. Get Full Table Overview of the association between significant copy number variation of 36 arm-level results and 15 clinical features. Shown in the table are P values (Q values). Thresholded by Q value < 0.25, 29 significant findings detected.
|
Clinical Features |
Time to Death |
AGE | GENDER |
HISTOLOGICAL TYPE |
RADIATIONS RADIATION REGIMENINDICATION |
RADIATIONEXPOSURE |
DISTANT METASTASIS |
EXTRATHYROIDAL EXTENSION |
LYMPH NODE METASTASIS |
COMPLETENESS OF RESECTION |
NUMBER OF LYMPH NODES |
TUMOR STAGECODE |
NEOPLASM DISEASESTAGE |
MULTIFOCALITY |
TUMOR SIZE |
||
| nCNV (%) | nWild-Type | logrank test | t-test | Fisher's exact test | Fisher's exact test | Fisher's exact test | Fisher's exact test | Fisher's exact test | Fisher's exact test | Chi-square test | Fisher's exact test | t-test | t-test | Chi-square test | Fisher's exact test | t-test | |
| 19p gain | 3 (1%) | 306 |
1 (1.00) |
0.186 (1.00) |
1 (1.00) |
0.000234 (0.11) |
1 (1.00) |
1 (1.00) |
0.277 (1.00) |
1 (1.00) |
0.53 (1.00) |
0.219 (1.00) |
2.04e-15 (9.77e-13) |
0.691 (1.00) |
1 (1.00) |
0.557 (1.00) |
|
| 2q loss | 6 (2%) | 303 |
1 (1.00) |
0.0372 (1.00) |
1 (1.00) |
0.018 (1.00) |
1 (1.00) |
1 (1.00) |
0.275 (1.00) |
0.418 (1.00) |
0.171 (1.00) |
0.418 (1.00) |
1.93e-15 (9.45e-13) |
0.000428 (0.201) |
0.684 (1.00) |
0.322 (1.00) |
|
| 4p gain | 4 (1%) | 305 |
0.00468 (1.00) |
0.118 (1.00) |
1 (1.00) |
0.365 (1.00) |
0.17 (1.00) |
1 (1.00) |
0.168 (1.00) |
1 (1.00) |
0.374 (1.00) |
0.288 (1.00) |
2e-15 (9.72e-13) |
0.492 (1.00) |
0.622 (1.00) |
0.429 (1.00) |
|
| 4q gain | 4 (1%) | 305 |
0.00468 (1.00) |
0.118 (1.00) |
1 (1.00) |
0.365 (1.00) |
0.17 (1.00) |
1 (1.00) |
0.168 (1.00) |
1 (1.00) |
0.374 (1.00) |
0.288 (1.00) |
2e-15 (9.72e-13) |
0.492 (1.00) |
0.622 (1.00) |
0.429 (1.00) |
|
| 5p gain | 9 (3%) | 300 |
0.00468 (1.00) |
0.0351 (1.00) |
1 (1.00) |
0.0193 (1.00) |
0.345 (1.00) |
1 (1.00) |
0.00842 (1.00) |
0.745 (1.00) |
0.149 (1.00) |
0.581 (1.00) |
1.89e-15 (9.39e-13) |
0.00967 (1.00) |
0.501 (1.00) |
0.0735 (1.00) |
|
| 5q gain | 9 (3%) | 300 |
0.00468 (1.00) |
0.0351 (1.00) |
1 (1.00) |
0.0193 (1.00) |
0.345 (1.00) |
1 (1.00) |
0.00842 (1.00) |
0.745 (1.00) |
0.149 (1.00) |
0.581 (1.00) |
1.89e-15 (9.39e-13) |
0.00967 (1.00) |
0.501 (1.00) |
0.0735 (1.00) |
|
| 7p gain | 11 (4%) | 298 |
1 (1.00) |
0.036 (1.00) |
1 (1.00) |
0.0257 (1.00) |
1 (1.00) |
1 (1.00) |
0.023 (1.00) |
0.449 (1.00) |
0.0924 (1.00) |
0.299 (1.00) |
1.82e-15 (9.1e-13) |
0.00306 (1.00) |
0.541 (1.00) |
0.17 (1.00) |
|
| 7q gain | 13 (4%) | 296 |
1 (1.00) |
0.02 (1.00) |
0.742 (1.00) |
0.00409 (1.00) |
1 (1.00) |
1 (1.00) |
0.0478 (1.00) |
0.803 (1.00) |
0.0137 (1.00) |
0.114 (1.00) |
1.82e-15 (9.1e-13) |
0.00986 (1.00) |
0.572 (1.00) |
0.161 (1.00) |
|
| 12p gain | 9 (3%) | 300 |
1 (1.00) |
0.181 (1.00) |
0.461 (1.00) |
0.0193 (1.00) |
1 (1.00) |
1 (1.00) |
0.00842 (1.00) |
0.745 (1.00) |
0.149 (1.00) |
0.581 (1.00) |
1.89e-15 (9.39e-13) |
0.0196 (1.00) |
0.501 (1.00) |
0.367 (1.00) |
|
| 12q gain | 10 (3%) | 299 |
1 (1.00) |
0.141 (1.00) |
0.46 (1.00) |
0.0134 (1.00) |
1 (1.00) |
1 (1.00) |
0.00361 (1.00) |
0.562 (1.00) |
0.054 (1.00) |
0.627 (1.00) |
1.89e-15 (9.39e-13) |
0.0426 (1.00) |
0.75 (1.00) |
0.367 (1.00) |
|
| 14q gain | 6 (2%) | 303 |
1 (1.00) |
0.256 (1.00) |
0.342 (1.00) |
0.0844 (1.00) |
1 (1.00) |
1 (1.00) |
0.0574 (1.00) |
1 (1.00) |
0.183 (1.00) |
0.418 (1.00) |
2e-15 (9.72e-13) |
0.0384 (1.00) |
0.214 (1.00) |
0.468 (1.00) |
|
| 16p gain | 8 (3%) | 301 |
1 (1.00) |
0.251 (1.00) |
0.207 (1.00) |
0.183 (1.00) |
1 (1.00) |
1 (1.00) |
0.356 (1.00) |
1 (1.00) |
0.0428 (1.00) |
0.172 (1.00) |
1.96e-15 (9.58e-13) |
0.139 (1.00) |
1 (1.00) |
0.475 (1.00) |
|
| 16q gain | 6 (2%) | 303 |
1 (1.00) |
0.152 (1.00) |
0.342 (1.00) |
0.501 (1.00) |
1 (1.00) |
1 (1.00) |
0.275 (1.00) |
1 (1.00) |
0.183 (1.00) |
0.418 (1.00) |
2e-15 (9.72e-13) |
0.0384 (1.00) |
0.684 (1.00) |
0.425 (1.00) |
|
| 17p gain | 8 (3%) | 301 |
1 (1.00) |
0.306 (1.00) |
0.207 (1.00) |
0.0216 (1.00) |
1 (1.00) |
1 (1.00) |
0.161 (1.00) |
0.327 (1.00) |
0.174 (1.00) |
0.531 (1.00) |
1.93e-15 (9.45e-13) |
0.00888 (1.00) |
0.723 (1.00) |
0.476 (1.00) |
|
| 17q gain | 9 (3%) | 300 |
1 (1.00) |
0.466 (1.00) |
0.119 (1.00) |
0.0429 (1.00) |
1 (1.00) |
1 (1.00) |
0.0682 (1.00) |
0.27 (1.00) |
0.149 (1.00) |
0.581 (1.00) |
1.89e-15 (9.39e-13) |
0.0212 (1.00) |
1 (1.00) |
0.75 (1.00) |
|
| 19q gain | 4 (1%) | 305 |
0.00468 (1.00) |
0.0697 (1.00) |
1 (1.00) |
0.00146 (0.683) |
0.17 (1.00) |
1 (1.00) |
0.168 (1.00) |
0.609 (1.00) |
0.374 (1.00) |
0.288 (1.00) |
2e-15 (9.72e-13) |
0.492 (1.00) |
1 (1.00) |
0.311 (1.00) |
|
| 20p gain | 5 (2%) | 304 |
1 (1.00) |
0.279 (1.00) |
0.339 (1.00) |
0.0281 (1.00) |
1 (1.00) |
1 (1.00) |
0.121 (1.00) |
0.406 (1.00) |
0.149 (1.00) |
1 (1.00) |
2.04e-15 (9.77e-13) |
0.00997 (1.00) |
1 (1.00) |
0.149 (1.00) |
|
| 20q gain | 5 (2%) | 304 |
1 (1.00) |
0.279 (1.00) |
0.339 (1.00) |
0.0281 (1.00) |
1 (1.00) |
1 (1.00) |
0.121 (1.00) |
0.406 (1.00) |
0.149 (1.00) |
1 (1.00) |
2.04e-15 (9.77e-13) |
0.00997 (1.00) |
1 (1.00) |
0.149 (1.00) |
|
| 2p loss | 7 (2%) | 302 |
1 (1.00) |
0.189 (1.00) |
1 (1.00) |
0.0482 (1.00) |
1 (1.00) |
1 (1.00) |
0.2 (1.00) |
0.309 (1.00) |
0.112 (1.00) |
0.477 (1.00) |
1.89e-15 (9.39e-13) |
0.00258 (1.00) |
1 (1.00) |
0.896 (1.00) |
|
| 3q loss | 3 (1%) | 306 |
1 (1.00) |
0.2 (1.00) |
0.573 (1.00) |
0.0563 (1.00) |
1 (1.00) |
1 (1.00) |
0.277 (1.00) |
1 (1.00) |
0.53 (1.00) |
1 (1.00) |
2.04e-15 (9.77e-13) |
0.0256 (1.00) |
1 (1.00) |
0.147 (1.00) |
|
| 9p loss | 5 (2%) | 304 |
1 (1.00) |
0.923 (1.00) |
0.339 (1.00) |
0.554 (1.00) |
1 (1.00) |
1 (1.00) |
1 (1.00) |
0.406 (1.00) |
0.552 (1.00) |
1 (1.00) |
0.47 (1.00) |
3.76e-05 (0.0178) |
1 (1.00) |
0.467 (1.00) |
|
| 9q loss | 7 (2%) | 302 |
1 (1.00) |
0.34 (1.00) |
1 (1.00) |
0.158 (1.00) |
0.28 (1.00) |
0.294 (1.00) |
0.498 (1.00) |
0.309 (1.00) |
0.512 (1.00) |
1 (1.00) |
0.734 (1.00) |
8.55e-06 (0.00405) |
1 (1.00) |
0.486 (1.00) |
|
| 10p loss | 4 (1%) | 305 |
1 (1.00) |
0.0668 (1.00) |
1 (1.00) |
0.202 (1.00) |
1 (1.00) |
1 (1.00) |
0.643 (1.00) |
0.609 (1.00) |
0.374 (1.00) |
1 (1.00) |
2.04e-15 (9.77e-13) |
0.00104 (0.486) |
1 (1.00) |
0.147 (1.00) |
|
| 11p loss | 4 (1%) | 305 |
0.00468 (1.00) |
0.0308 (1.00) |
0.254 (1.00) |
0.141 (1.00) |
0.17 (1.00) |
1 (1.00) |
0.168 (1.00) |
0.609 (1.00) |
0.374 (1.00) |
0.288 (1.00) |
2e-15 (9.72e-13) |
0.492 (1.00) |
0.622 (1.00) |
0.203 (1.00) |
|
| 11q loss | 5 (2%) | 304 |
0.00468 (1.00) |
0.0185 (1.00) |
0.0976 (1.00) |
0.0947 (1.00) |
0.208 (1.00) |
1 (1.00) |
0.121 (1.00) |
0.406 (1.00) |
0.256 (1.00) |
0.355 (1.00) |
1.96e-15 (9.58e-13) |
0.159 (1.00) |
1 (1.00) |
0.203 (1.00) |
|
| 13q loss | 9 (3%) | 300 |
0.00468 (1.00) |
0.0329 (1.00) |
0.231 (1.00) |
0.0651 (1.00) |
0.345 (1.00) |
0.00424 (1.00) |
0.268 (1.00) |
0.745 (1.00) |
0.144 (1.00) |
0.408 (1.00) |
1.86e-15 (9.24e-13) |
0.143 (1.00) |
0.501 (1.00) |
0.402 (1.00) |
|
| 15q loss | 3 (1%) | 306 |
1 (1.00) |
0.405 (1.00) |
1 (1.00) |
0.0425 (1.00) |
1 (1.00) |
1 (1.00) |
0.277 (1.00) |
1 (1.00) |
0.53 (1.00) |
1 (1.00) |
2.04e-15 (9.77e-13) |
0.0256 (1.00) |
1 (1.00) |
0.354 (1.00) |
|
| 1q gain | 10 (3%) | 299 |
1 (1.00) |
0.133 (1.00) |
0.712 (1.00) |
0.153 (1.00) |
0.375 (1.00) |
1 (1.00) |
1 (1.00) |
0.00345 (1.00) |
0.357 (1.00) |
0.157 (1.00) |
0.402 (1.00) |
0.1 (1.00) |
0.335 (1.00) |
0.277 (1.00) |
|
| 11p gain | 3 (1%) | 306 |
1 (1.00) |
0.718 (1.00) |
0.573 (1.00) |
0.0143 (1.00) |
1 (1.00) |
1 (1.00) |
0.277 (1.00) |
1 (1.00) |
0.544 (1.00) |
1 (1.00) |
0.441 (1.00) |
1 (1.00) |
0.0131 (1.00) |
||
| 1p loss | 3 (1%) | 306 |
1 (1.00) |
0.181 (1.00) |
1 (1.00) |
0.431 (1.00) |
1 (1.00) |
1 (1.00) |
1 (1.00) |
1 (1.00) |
0.53 (1.00) |
1 (1.00) |
0.0256 (1.00) |
1 (1.00) |
|||
| 10q loss | 3 (1%) | 306 |
1 (1.00) |
0.0336 (1.00) |
0.573 (1.00) |
0.431 (1.00) |
1 (1.00) |
1 (1.00) |
1 (1.00) |
1 (1.00) |
0.53 (1.00) |
1 (1.00) |
0.0256 (1.00) |
1 (1.00) |
|||
| 17p loss | 4 (1%) | 305 |
1 (1.00) |
0.525 (1.00) |
0.575 (1.00) |
0.798 (1.00) |
0.0109 (1.00) |
1 (1.00) |
0.643 (1.00) |
0.0488 (1.00) |
0.291 (1.00) |
1 (1.00) |
0.587 (1.00) |
0.071 (1.00) |
0.622 (1.00) |
0.227 (1.00) |
|
| 18p loss | 3 (1%) | 306 |
1 (1.00) |
0.971 (1.00) |
1 (1.00) |
1 (1.00) |
1 (1.00) |
1 (1.00) |
1 (1.00) |
1 (1.00) |
0.861 (1.00) |
1 (1.00) |
0.0653 (1.00) |
0.0384 (1.00) |
1 (1.00) |
0.655 (1.00) |
|
| 18q loss | 3 (1%) | 306 |
1 (1.00) |
0.971 (1.00) |
1 (1.00) |
1 (1.00) |
1 (1.00) |
1 (1.00) |
1 (1.00) |
1 (1.00) |
0.861 (1.00) |
1 (1.00) |
0.0653 (1.00) |
0.0384 (1.00) |
1 (1.00) |
0.655 (1.00) |
|
| 21q loss | 5 (2%) | 304 |
1 (1.00) |
0.0267 (1.00) |
0.6 (1.00) |
0.314 (1.00) |
1 (1.00) |
1 (1.00) |
0.412 (1.00) |
0.406 (1.00) |
0.552 (1.00) |
0.557 (1.00) |
0.981 (1.00) |
0.00437 (1.00) |
0.371 (1.00) |
0.683 (1.00) |
|
| 22q loss | 42 (14%) | 267 |
1 (1.00) |
0.277 (1.00) |
1 (1.00) |
0.00071 (0.333) |
0.23 (1.00) |
0.699 (1.00) |
0.575 (1.00) |
0.111 (1.00) |
0.189 (1.00) |
0.614 (1.00) |
0.611 (1.00) |
0.364 (1.00) |
0.406 (1.00) |
0.559 (1.00) |
P value = 2e-15 (t-test), Q value = 9.7e-13
Table S1. Gene #2: '4p gain mutation analysis' versus Clinical Feature #11: 'NUMBER.OF.LYMPH.NODES'
| nPatients | Mean (Std.Dev) | |
|---|---|---|
| ALL | 248 | 2.7 (5.1) |
| 4P GAIN MUTATED | 4 | 0.0 (0.0) |
| 4P GAIN WILD-TYPE | 244 | 2.8 (5.1) |
Figure S1. Get High-res Image Gene #2: '4p gain mutation analysis' versus Clinical Feature #11: 'NUMBER.OF.LYMPH.NODES'

P value = 2e-15 (t-test), Q value = 9.7e-13
Table S2. Gene #3: '4q gain mutation analysis' versus Clinical Feature #11: 'NUMBER.OF.LYMPH.NODES'
| nPatients | Mean (Std.Dev) | |
|---|---|---|
| ALL | 248 | 2.7 (5.1) |
| 4Q GAIN MUTATED | 4 | 0.0 (0.0) |
| 4Q GAIN WILD-TYPE | 244 | 2.8 (5.1) |
Figure S2. Get High-res Image Gene #3: '4q gain mutation analysis' versus Clinical Feature #11: 'NUMBER.OF.LYMPH.NODES'

P value = 1.89e-15 (t-test), Q value = 9.4e-13
Table S3. Gene #4: '5p gain mutation analysis' versus Clinical Feature #11: 'NUMBER.OF.LYMPH.NODES'
| nPatients | Mean (Std.Dev) | |
|---|---|---|
| ALL | 248 | 2.7 (5.1) |
| 5P GAIN MUTATED | 7 | 0.0 (0.0) |
| 5P GAIN WILD-TYPE | 241 | 2.8 (5.1) |
Figure S3. Get High-res Image Gene #4: '5p gain mutation analysis' versus Clinical Feature #11: 'NUMBER.OF.LYMPH.NODES'

P value = 1.89e-15 (t-test), Q value = 9.4e-13
Table S4. Gene #5: '5q gain mutation analysis' versus Clinical Feature #11: 'NUMBER.OF.LYMPH.NODES'
| nPatients | Mean (Std.Dev) | |
|---|---|---|
| ALL | 248 | 2.7 (5.1) |
| 5Q GAIN MUTATED | 7 | 0.0 (0.0) |
| 5Q GAIN WILD-TYPE | 241 | 2.8 (5.1) |
Figure S4. Get High-res Image Gene #5: '5q gain mutation analysis' versus Clinical Feature #11: 'NUMBER.OF.LYMPH.NODES'

P value = 1.82e-15 (t-test), Q value = 9.1e-13
Table S5. Gene #6: '7p gain mutation analysis' versus Clinical Feature #11: 'NUMBER.OF.LYMPH.NODES'
| nPatients | Mean (Std.Dev) | |
|---|---|---|
| ALL | 248 | 2.7 (5.1) |
| 7P GAIN MUTATED | 9 | 0.0 (0.0) |
| 7P GAIN WILD-TYPE | 239 | 2.8 (5.1) |
Figure S5. Get High-res Image Gene #6: '7p gain mutation analysis' versus Clinical Feature #11: 'NUMBER.OF.LYMPH.NODES'

P value = 1.82e-15 (t-test), Q value = 9.1e-13
Table S6. Gene #7: '7q gain mutation analysis' versus Clinical Feature #11: 'NUMBER.OF.LYMPH.NODES'
| nPatients | Mean (Std.Dev) | |
|---|---|---|
| ALL | 248 | 2.7 (5.1) |
| 7Q GAIN MUTATED | 9 | 0.0 (0.0) |
| 7Q GAIN WILD-TYPE | 239 | 2.8 (5.1) |
Figure S6. Get High-res Image Gene #7: '7q gain mutation analysis' versus Clinical Feature #11: 'NUMBER.OF.LYMPH.NODES'

P value = 1.89e-15 (t-test), Q value = 9.4e-13
Table S7. Gene #9: '12p gain mutation analysis' versus Clinical Feature #11: 'NUMBER.OF.LYMPH.NODES'
| nPatients | Mean (Std.Dev) | |
|---|---|---|
| ALL | 248 | 2.7 (5.1) |
| 12P GAIN MUTATED | 7 | 0.0 (0.0) |
| 12P GAIN WILD-TYPE | 241 | 2.8 (5.1) |
Figure S7. Get High-res Image Gene #9: '12p gain mutation analysis' versus Clinical Feature #11: 'NUMBER.OF.LYMPH.NODES'

P value = 1.89e-15 (t-test), Q value = 9.4e-13
Table S8. Gene #10: '12q gain mutation analysis' versus Clinical Feature #11: 'NUMBER.OF.LYMPH.NODES'
| nPatients | Mean (Std.Dev) | |
|---|---|---|
| ALL | 248 | 2.7 (5.1) |
| 12Q GAIN MUTATED | 7 | 0.0 (0.0) |
| 12Q GAIN WILD-TYPE | 241 | 2.8 (5.1) |
Figure S8. Get High-res Image Gene #10: '12q gain mutation analysis' versus Clinical Feature #11: 'NUMBER.OF.LYMPH.NODES'

P value = 2e-15 (t-test), Q value = 9.7e-13
Table S9. Gene #11: '14q gain mutation analysis' versus Clinical Feature #11: 'NUMBER.OF.LYMPH.NODES'
| nPatients | Mean (Std.Dev) | |
|---|---|---|
| ALL | 248 | 2.7 (5.1) |
| 14Q GAIN MUTATED | 4 | 0.0 (0.0) |
| 14Q GAIN WILD-TYPE | 244 | 2.8 (5.1) |
Figure S9. Get High-res Image Gene #11: '14q gain mutation analysis' versus Clinical Feature #11: 'NUMBER.OF.LYMPH.NODES'

P value = 1.96e-15 (t-test), Q value = 9.6e-13
Table S10. Gene #12: '16p gain mutation analysis' versus Clinical Feature #11: 'NUMBER.OF.LYMPH.NODES'
| nPatients | Mean (Std.Dev) | |
|---|---|---|
| ALL | 248 | 2.7 (5.1) |
| 16P GAIN MUTATED | 5 | 0.0 (0.0) |
| 16P GAIN WILD-TYPE | 243 | 2.8 (5.1) |
Figure S10. Get High-res Image Gene #12: '16p gain mutation analysis' versus Clinical Feature #11: 'NUMBER.OF.LYMPH.NODES'
P value = 2e-15 (t-test), Q value = 9.7e-13
Table S11. Gene #13: '16q gain mutation analysis' versus Clinical Feature #11: 'NUMBER.OF.LYMPH.NODES'
| nPatients | Mean (Std.Dev) | |
|---|---|---|
| ALL | 248 | 2.7 (5.1) |
| 16Q GAIN MUTATED | 4 | 0.0 (0.0) |
| 16Q GAIN WILD-TYPE | 244 | 2.8 (5.1) |
Figure S11. Get High-res Image Gene #13: '16q gain mutation analysis' versus Clinical Feature #11: 'NUMBER.OF.LYMPH.NODES'

P value = 1.93e-15 (t-test), Q value = 9.4e-13
Table S12. Gene #14: '17p gain mutation analysis' versus Clinical Feature #11: 'NUMBER.OF.LYMPH.NODES'
| nPatients | Mean (Std.Dev) | |
|---|---|---|
| ALL | 248 | 2.7 (5.1) |
| 17P GAIN MUTATED | 6 | 0.0 (0.0) |
| 17P GAIN WILD-TYPE | 242 | 2.8 (5.1) |
Figure S12. Get High-res Image Gene #14: '17p gain mutation analysis' versus Clinical Feature #11: 'NUMBER.OF.LYMPH.NODES'

P value = 1.89e-15 (t-test), Q value = 9.4e-13
Table S13. Gene #15: '17q gain mutation analysis' versus Clinical Feature #11: 'NUMBER.OF.LYMPH.NODES'
| nPatients | Mean (Std.Dev) | |
|---|---|---|
| ALL | 248 | 2.7 (5.1) |
| 17Q GAIN MUTATED | 7 | 0.0 (0.0) |
| 17Q GAIN WILD-TYPE | 241 | 2.8 (5.1) |
Figure S13. Get High-res Image Gene #15: '17q gain mutation analysis' versus Clinical Feature #11: 'NUMBER.OF.LYMPH.NODES'
P value = 0.000234 (Fisher's exact test), Q value = 0.11
Table S14. Gene #16: '19p gain mutation analysis' versus Clinical Feature #4: 'HISTOLOGICAL.TYPE'
| nPatients | OTHER | THYROID PAPILLARY CARCINOMA - CLASSICAL/USUAL | THYROID PAPILLARY CARCINOMA - FOLLICULAR (>= 99% FOLLICULAR PATTERNED) | THYROID PAPILLARY CARCINOMA - TALL CELL (>= 50% TALL CELL FEATURES) |
|---|---|---|---|---|
| ALL | 20 | 183 | 75 | 31 |
| 19P GAIN MUTATED | 3 | 0 | 0 | 0 |
| 19P GAIN WILD-TYPE | 17 | 183 | 75 | 31 |
Figure S14. Get High-res Image Gene #16: '19p gain mutation analysis' versus Clinical Feature #4: 'HISTOLOGICAL.TYPE'
P value = 2.04e-15 (t-test), Q value = 9.8e-13
Table S15. Gene #16: '19p gain mutation analysis' versus Clinical Feature #11: 'NUMBER.OF.LYMPH.NODES'
| nPatients | Mean (Std.Dev) | |
|---|---|---|
| ALL | 248 | 2.7 (5.1) |
| 19P GAIN MUTATED | 3 | 0.0 (0.0) |
| 19P GAIN WILD-TYPE | 245 | 2.8 (5.1) |
Figure S15. Get High-res Image Gene #16: '19p gain mutation analysis' versus Clinical Feature #11: 'NUMBER.OF.LYMPH.NODES'

P value = 2e-15 (t-test), Q value = 9.7e-13
Table S16. Gene #17: '19q gain mutation analysis' versus Clinical Feature #11: 'NUMBER.OF.LYMPH.NODES'
| nPatients | Mean (Std.Dev) | |
|---|---|---|
| ALL | 248 | 2.7 (5.1) |
| 19Q GAIN MUTATED | 4 | 0.0 (0.0) |
| 19Q GAIN WILD-TYPE | 244 | 2.8 (5.1) |
Figure S16. Get High-res Image Gene #17: '19q gain mutation analysis' versus Clinical Feature #11: 'NUMBER.OF.LYMPH.NODES'
P value = 2.04e-15 (t-test), Q value = 9.8e-13
Table S17. Gene #18: '20p gain mutation analysis' versus Clinical Feature #11: 'NUMBER.OF.LYMPH.NODES'
| nPatients | Mean (Std.Dev) | |
|---|---|---|
| ALL | 248 | 2.7 (5.1) |
| 20P GAIN MUTATED | 3 | 0.0 (0.0) |
| 20P GAIN WILD-TYPE | 245 | 2.8 (5.1) |
Figure S17. Get High-res Image Gene #18: '20p gain mutation analysis' versus Clinical Feature #11: 'NUMBER.OF.LYMPH.NODES'

P value = 2.04e-15 (t-test), Q value = 9.8e-13
Table S18. Gene #19: '20q gain mutation analysis' versus Clinical Feature #11: 'NUMBER.OF.LYMPH.NODES'
| nPatients | Mean (Std.Dev) | |
|---|---|---|
| ALL | 248 | 2.7 (5.1) |
| 20Q GAIN MUTATED | 3 | 0.0 (0.0) |
| 20Q GAIN WILD-TYPE | 245 | 2.8 (5.1) |
Figure S18. Get High-res Image Gene #19: '20q gain mutation analysis' versus Clinical Feature #11: 'NUMBER.OF.LYMPH.NODES'

P value = 1.89e-15 (t-test), Q value = 9.4e-13
Table S19. Gene #21: '2p loss mutation analysis' versus Clinical Feature #11: 'NUMBER.OF.LYMPH.NODES'
| nPatients | Mean (Std.Dev) | |
|---|---|---|
| ALL | 248 | 2.7 (5.1) |
| 2P LOSS MUTATED | 7 | 0.0 (0.0) |
| 2P LOSS WILD-TYPE | 241 | 2.8 (5.1) |
Figure S19. Get High-res Image Gene #21: '2p loss mutation analysis' versus Clinical Feature #11: 'NUMBER.OF.LYMPH.NODES'

P value = 1.93e-15 (t-test), Q value = 9.4e-13
Table S20. Gene #22: '2q loss mutation analysis' versus Clinical Feature #11: 'NUMBER.OF.LYMPH.NODES'
| nPatients | Mean (Std.Dev) | |
|---|---|---|
| ALL | 248 | 2.7 (5.1) |
| 2Q LOSS MUTATED | 6 | 0.0 (0.0) |
| 2Q LOSS WILD-TYPE | 242 | 2.8 (5.1) |
Figure S20. Get High-res Image Gene #22: '2q loss mutation analysis' versus Clinical Feature #11: 'NUMBER.OF.LYMPH.NODES'

P value = 0.000428 (Chi-square test), Q value = 0.2
Table S21. Gene #22: '2q loss mutation analysis' versus Clinical Feature #13: 'NEOPLASM.DISEASESTAGE'
| nPatients | STAGE I | STAGE II | STAGE III | STAGE IVA | STAGE IVC |
|---|---|---|---|---|---|
| ALL | 177 | 33 | 67 | 28 | 3 |
| 2Q LOSS MUTATED | 1 | 4 | 1 | 0 | 0 |
| 2Q LOSS WILD-TYPE | 176 | 29 | 66 | 28 | 3 |
Figure S21. Get High-res Image Gene #22: '2q loss mutation analysis' versus Clinical Feature #13: 'NEOPLASM.DISEASESTAGE'

P value = 2.04e-15 (t-test), Q value = 9.8e-13
Table S22. Gene #23: '3q loss mutation analysis' versus Clinical Feature #11: 'NUMBER.OF.LYMPH.NODES'
| nPatients | Mean (Std.Dev) | |
|---|---|---|
| ALL | 248 | 2.7 (5.1) |
| 3Q LOSS MUTATED | 3 | 0.0 (0.0) |
| 3Q LOSS WILD-TYPE | 245 | 2.8 (5.1) |
Figure S22. Get High-res Image Gene #23: '3q loss mutation analysis' versus Clinical Feature #11: 'NUMBER.OF.LYMPH.NODES'

P value = 3.76e-05 (Chi-square test), Q value = 0.018
Table S23. Gene #24: '9p loss mutation analysis' versus Clinical Feature #13: 'NEOPLASM.DISEASESTAGE'
| nPatients | STAGE I | STAGE II | STAGE III | STAGE IVA | STAGE IVC |
|---|---|---|---|---|---|
| ALL | 177 | 33 | 67 | 28 | 3 |
| 9P LOSS MUTATED | 1 | 4 | 0 | 0 | 0 |
| 9P LOSS WILD-TYPE | 176 | 29 | 67 | 28 | 3 |
Figure S23. Get High-res Image Gene #24: '9p loss mutation analysis' versus Clinical Feature #13: 'NEOPLASM.DISEASESTAGE'
P value = 8.55e-06 (Chi-square test), Q value = 0.0041
Table S24. Gene #25: '9q loss mutation analysis' versus Clinical Feature #13: 'NEOPLASM.DISEASESTAGE'
| nPatients | STAGE I | STAGE II | STAGE III | STAGE IVA | STAGE IVC |
|---|---|---|---|---|---|
| ALL | 177 | 33 | 67 | 28 | 3 |
| 9Q LOSS MUTATED | 1 | 5 | 0 | 1 | 0 |
| 9Q LOSS WILD-TYPE | 176 | 28 | 67 | 27 | 3 |
Figure S24. Get High-res Image Gene #25: '9q loss mutation analysis' versus Clinical Feature #13: 'NEOPLASM.DISEASESTAGE'

P value = 2.04e-15 (t-test), Q value = 9.8e-13
Table S25. Gene #26: '10p loss mutation analysis' versus Clinical Feature #11: 'NUMBER.OF.LYMPH.NODES'
| nPatients | Mean (Std.Dev) | |
|---|---|---|
| ALL | 248 | 2.7 (5.1) |
| 10P LOSS MUTATED | 3 | 0.0 (0.0) |
| 10P LOSS WILD-TYPE | 245 | 2.8 (5.1) |
Figure S25. Get High-res Image Gene #26: '10p loss mutation analysis' versus Clinical Feature #11: 'NUMBER.OF.LYMPH.NODES'

P value = 2e-15 (t-test), Q value = 9.7e-13
Table S26. Gene #28: '11p loss mutation analysis' versus Clinical Feature #11: 'NUMBER.OF.LYMPH.NODES'
| nPatients | Mean (Std.Dev) | |
|---|---|---|
| ALL | 248 | 2.7 (5.1) |
| 11P LOSS MUTATED | 4 | 0.0 (0.0) |
| 11P LOSS WILD-TYPE | 244 | 2.8 (5.1) |
Figure S26. Get High-res Image Gene #28: '11p loss mutation analysis' versus Clinical Feature #11: 'NUMBER.OF.LYMPH.NODES'
P value = 1.96e-15 (t-test), Q value = 9.6e-13
Table S27. Gene #29: '11q loss mutation analysis' versus Clinical Feature #11: 'NUMBER.OF.LYMPH.NODES'
| nPatients | Mean (Std.Dev) | |
|---|---|---|
| ALL | 248 | 2.7 (5.1) |
| 11Q LOSS MUTATED | 5 | 0.0 (0.0) |
| 11Q LOSS WILD-TYPE | 243 | 2.8 (5.1) |
Figure S27. Get High-res Image Gene #29: '11q loss mutation analysis' versus Clinical Feature #11: 'NUMBER.OF.LYMPH.NODES'
P value = 1.86e-15 (t-test), Q value = 9.2e-13
Table S28. Gene #30: '13q loss mutation analysis' versus Clinical Feature #11: 'NUMBER.OF.LYMPH.NODES'
| nPatients | Mean (Std.Dev) | |
|---|---|---|
| ALL | 248 | 2.7 (5.1) |
| 13Q LOSS MUTATED | 8 | 0.0 (0.0) |
| 13Q LOSS WILD-TYPE | 240 | 2.8 (5.1) |
Figure S28. Get High-res Image Gene #30: '13q loss mutation analysis' versus Clinical Feature #11: 'NUMBER.OF.LYMPH.NODES'

P value = 2.04e-15 (t-test), Q value = 9.8e-13
Table S29. Gene #31: '15q loss mutation analysis' versus Clinical Feature #11: 'NUMBER.OF.LYMPH.NODES'
| nPatients | Mean (Std.Dev) | |
|---|---|---|
| ALL | 248 | 2.7 (5.1) |
| 15Q LOSS MUTATED | 3 | 0.0 (0.0) |
| 15Q LOSS WILD-TYPE | 245 | 2.8 (5.1) |
Figure S29. Get High-res Image Gene #31: '15q loss mutation analysis' versus Clinical Feature #11: 'NUMBER.OF.LYMPH.NODES'

-
Mutation data file = broad_values_by_arm.mutsig.cluster.txt
-
Clinical data file = THCA-TP.clin.merged.picked.txt
-
Number of patients = 309
-
Number of significantly arm-level cnvs = 36
-
Number of selected clinical features = 15
-
Exclude genes that fewer than K tumors have mutations, K = 3
For survival clinical features, the Kaplan-Meier survival curves of tumors with and without gene mutations were plotted and the statistical significance P values were estimated by logrank test (Bland and Altman 2004) using the 'survdiff' function in R
For continuous numerical clinical features, two-tailed Student's t test with unequal variance (Lehmann and Romano 2005) was applied to compare the clinical values between tumors with and without gene mutations using 't.test' function in R
For binary or multi-class clinical features (nominal or ordinal), two-tailed Fisher's exact tests (Fisher 1922) were used to estimate the P values using the 'fisher.test' function in R
For multi-class clinical features (nominal or ordinal), Chi-square tests (Greenwood and Nikulin 1996) were used to estimate the P values using the 'chisq.test' function in R
For multiple hypothesis correction, Q value is the False Discovery Rate (FDR) analogue of the P value (Benjamini and Hochberg 1995), defined as the minimum FDR at which the test may be called significant. We used the 'Benjamini and Hochberg' method of 'p.adjust' function in R to convert P values into Q values.
This is an experimental feature. The full results of the analysis summarized in this report can be downloaded from the TCGA Data Coordination Center.