(primary solid tumor cohort)
This pipeline computes the correlation between significantly recurrent gene mutations and selected clinical features.
Testing the association between mutation status of 27 genes and 14 clinical features across 241 patients, 8 significant findings detected with Q value < 0.25.
-
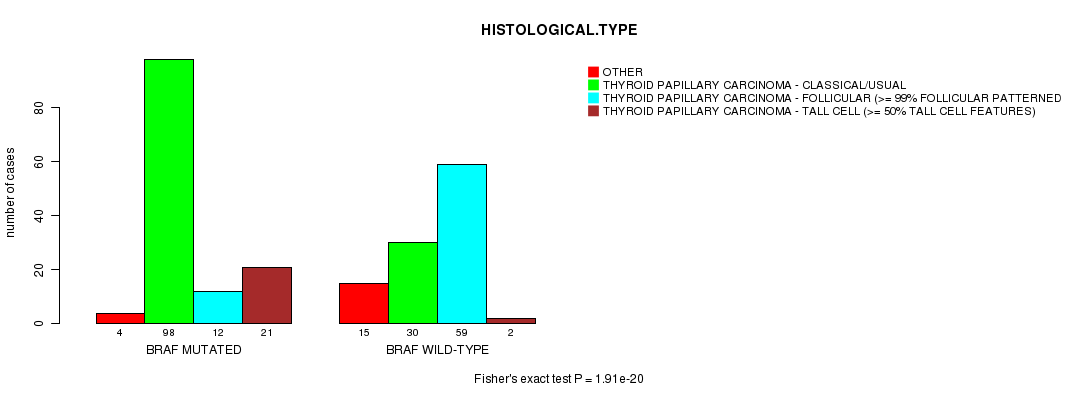
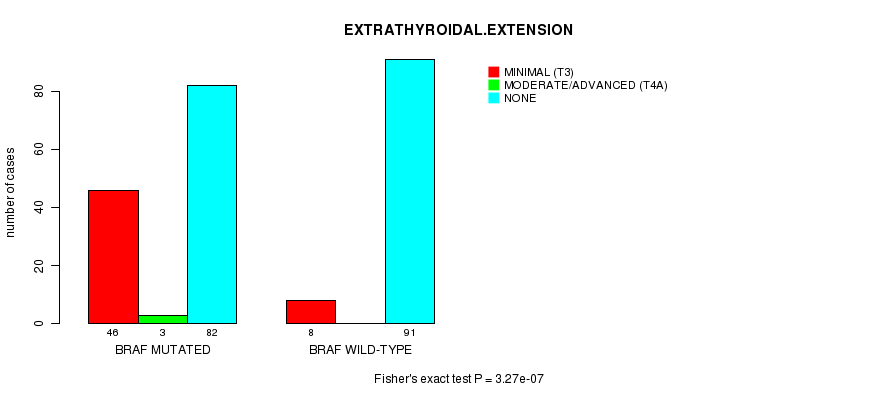
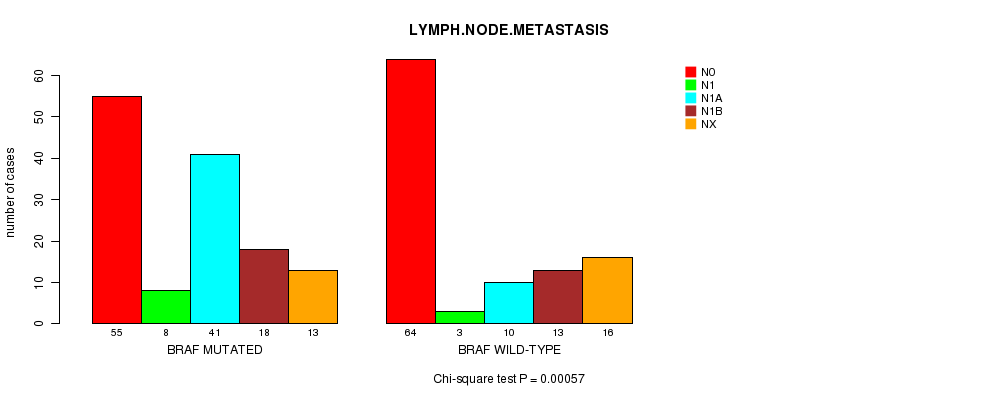
BRAF mutation correlated to 'HISTOLOGICAL.TYPE', 'EXTRATHYROIDAL.EXTENSION', and 'LYMPH.NODE.METASTASIS'.
-
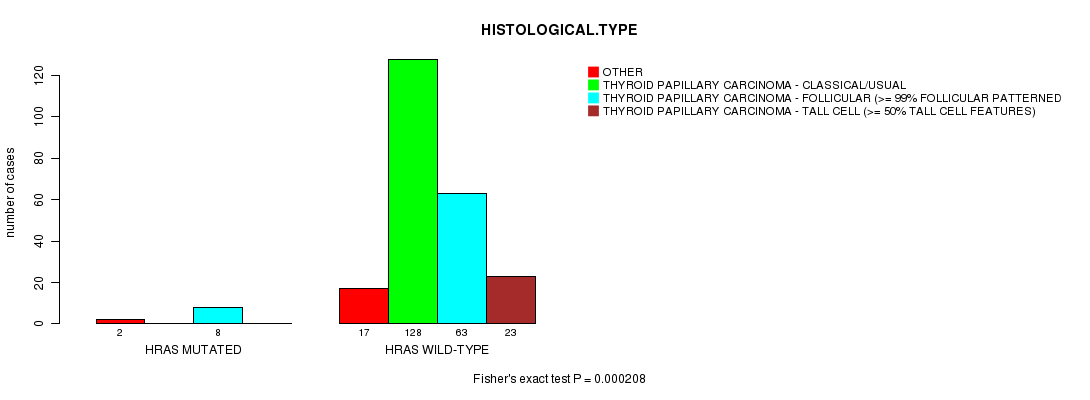
HRAS mutation correlated to 'HISTOLOGICAL.TYPE'.
-
NRAS mutation correlated to 'HISTOLOGICAL.TYPE'.
-
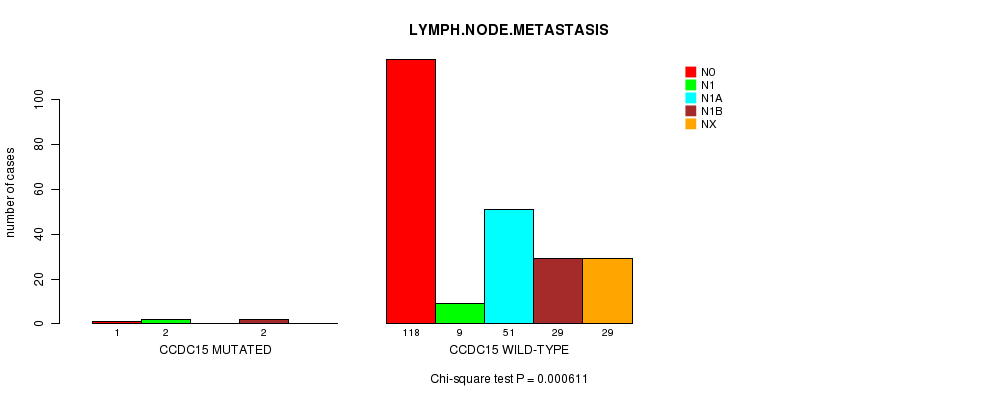
CCDC15 mutation correlated to 'LYMPH.NODE.METASTASIS'.
-
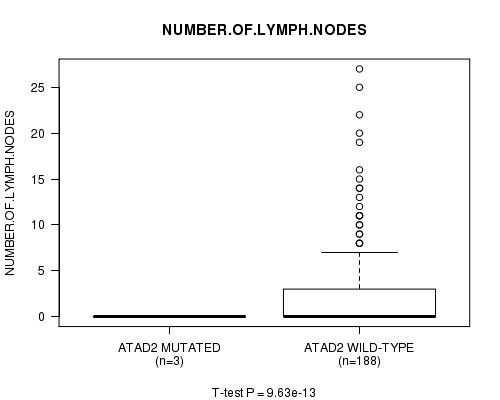
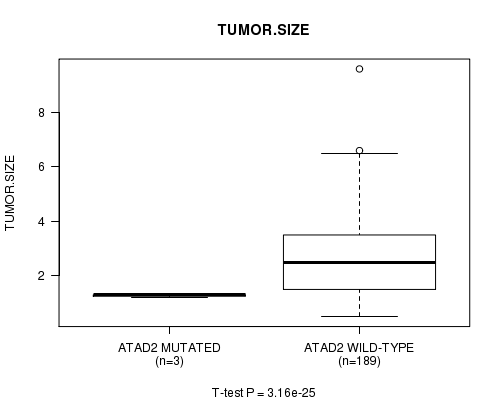
ATAD2 mutation correlated to 'NUMBER.OF.LYMPH.NODES' and 'TUMOR.SIZE'.
Table 1. Get Full Table Overview of the association between mutation status of 27 genes and 14 clinical features. Shown in the table are P values (Q values). Thresholded by Q value < 0.25, 8 significant findings detected.
|
Clinical Features |
AGE | GENDER |
HISTOLOGICAL TYPE |
RADIATIONS RADIATION REGIMENINDICATION |
RADIATIONEXPOSURE |
DISTANT METASTASIS |
EXTRATHYROIDAL EXTENSION |
LYMPH NODE METASTASIS |
COMPLETENESS OF RESECTION |
NUMBER OF LYMPH NODES |
TUMOR STAGECODE |
NEOPLASM DISEASESTAGE |
MULTIFOCALITY |
TUMOR SIZE |
||
| nMutated (%) | nWild-Type | t-test | Fisher's exact test | Fisher's exact test | Fisher's exact test | Fisher's exact test | Fisher's exact test | Fisher's exact test | Chi-square test | Fisher's exact test | t-test | t-test | Chi-square test | Fisher's exact test | t-test | |
| BRAF | 135 (56%) | 106 |
0.547 (1.00) |
0.375 (1.00) |
1.91e-20 (6.32e-18) |
0.014 (1.00) |
1 (1.00) |
0.43 (1.00) |
3.27e-07 (0.000107) |
0.00057 (0.186) |
0.513 (1.00) |
0.0873 (1.00) |
0.0492 (1.00) |
1 (1.00) |
0.0585 (1.00) |
|
| ATAD2 | 3 (1%) | 238 |
0.6 (1.00) |
0.571 (1.00) |
1 (1.00) |
1 (1.00) |
1 (1.00) |
1 (1.00) |
1 (1.00) |
0.539 (1.00) |
1 (1.00) |
9.63e-13 (3.18e-10) |
0.669 (1.00) |
0.249 (1.00) |
3.16e-25 (1.05e-22) |
|
| HRAS | 10 (4%) | 231 |
0.712 (1.00) |
0.72 (1.00) |
0.000208 (0.0682) |
1 (1.00) |
1 (1.00) |
0.133 (1.00) |
1 (1.00) |
0.23 (1.00) |
0.115 (1.00) |
0.808 (1.00) |
0.0312 (1.00) |
0.342 (1.00) |
0.412 (1.00) |
|
| NRAS | 21 (9%) | 220 |
0.623 (1.00) |
0.436 (1.00) |
5.23e-08 (1.72e-05) |
0.607 (1.00) |
1 (1.00) |
0.28 (1.00) |
0.0208 (1.00) |
0.00306 (0.987) |
1 (1.00) |
0.0122 (1.00) |
0.0402 (1.00) |
0.366 (1.00) |
0.974 (1.00) |
|
| CCDC15 | 5 (2%) | 236 |
0.147 (1.00) |
1 (1.00) |
0.394 (1.00) |
1 (1.00) |
1 (1.00) |
0.215 (1.00) |
1 (1.00) |
0.000611 (0.198) |
1 (1.00) |
0.196 (1.00) |
0.641 (1.00) |
0.19 (1.00) |
0.384 (1.00) |
|
| EMG1 | 5 (2%) | 236 |
0.954 (1.00) |
0.332 (1.00) |
0.353 (1.00) |
1 (1.00) |
1 (1.00) |
0.44 (1.00) |
1 (1.00) |
0.865 (1.00) |
0.159 (1.00) |
0.0759 (1.00) |
0.32 (1.00) |
0.668 (1.00) |
0.249 (1.00) |
|
| RPTN | 7 (3%) | 234 |
0.94 (1.00) |
1 (1.00) |
0.345 (1.00) |
1 (1.00) |
1 (1.00) |
0.502 (1.00) |
0.701 (1.00) |
0.0198 (1.00) |
1 (1.00) |
0.139 (1.00) |
0.581 (1.00) |
1 (1.00) |
0.589 (1.00) |
|
| EIF1AX | 3 (1%) | 238 |
0.429 (1.00) |
0.163 (1.00) |
0.0756 (1.00) |
1 (1.00) |
1 (1.00) |
1 (1.00) |
1 (1.00) |
0.0645 (1.00) |
0.196 (1.00) |
0.724 (1.00) |
1 (1.00) |
0.3 (1.00) |
||
| ZNF845 | 5 (2%) | 236 |
0.869 (1.00) |
1 (1.00) |
0.394 (1.00) |
1 (1.00) |
0.178 (1.00) |
0.673 (1.00) |
1 (1.00) |
0.541 (1.00) |
1 (1.00) |
0.965 (1.00) |
0.246 (1.00) |
1 (1.00) |
0.882 (1.00) |
|
| TG | 12 (5%) | 229 |
0.952 (1.00) |
1 (1.00) |
0.0205 (1.00) |
1 (1.00) |
1 (1.00) |
1 (1.00) |
0.775 (1.00) |
0.919 (1.00) |
0.823 (1.00) |
0.622 (1.00) |
0.969 (1.00) |
0.774 (1.00) |
0.873 (1.00) |
|
| PRB2 | 3 (1%) | 238 |
0.277 (1.00) |
1 (1.00) |
0.601 (1.00) |
1 (1.00) |
1 (1.00) |
1 (1.00) |
0.576 (1.00) |
0.644 (1.00) |
1 (1.00) |
0.724 (1.00) |
1 (1.00) |
0.396 (1.00) |
||
| R3HDM2 | 4 (2%) | 237 |
0.991 (1.00) |
1 (1.00) |
0.364 (1.00) |
1 (1.00) |
1 (1.00) |
0.66 (1.00) |
0.597 (1.00) |
0.613 (1.00) |
1 (1.00) |
0.924 (1.00) |
1 (1.00) |
0.468 (1.00) |
||
| PPTC7 | 3 (1%) | 238 |
0.74 (1.00) |
0.163 (1.00) |
0.601 (1.00) |
1 (1.00) |
1 (1.00) |
0.589 (1.00) |
1 (1.00) |
0.863 (1.00) |
1 (1.00) |
0.00108 (0.349) |
0.93 (1.00) |
1 (1.00) |
0.844 (1.00) |
|
| LYPD3 | 3 (1%) | 238 |
0.271 (1.00) |
1 (1.00) |
0.0998 (1.00) |
1 (1.00) |
1 (1.00) |
0.589 (1.00) |
0.576 (1.00) |
0.863 (1.00) |
0.196 (1.00) |
0.623 (1.00) |
0.93 (1.00) |
0.249 (1.00) |
0.00362 (1.00) |
|
| TMEM90B | 3 (1%) | 238 |
0.413 (1.00) |
0.571 (1.00) |
0.216 (1.00) |
1 (1.00) |
1 (1.00) |
0.589 (1.00) |
0.175 (1.00) |
0.863 (1.00) |
1 (1.00) |
0.623 (1.00) |
0.468 (1.00) |
0.249 (1.00) |
||
| ZNF799 | 4 (2%) | 237 |
0.559 (1.00) |
1 (1.00) |
1 (1.00) |
1 (1.00) |
1 (1.00) |
1 (1.00) |
0.597 (1.00) |
0.0332 (1.00) |
1 (1.00) |
0.73 (1.00) |
0.344 (1.00) |
|||
| PPM1D | 5 (2%) | 236 |
0.53 (1.00) |
1 (1.00) |
0.869 (1.00) |
1 (1.00) |
1 (1.00) |
1 (1.00) |
0.384 (1.00) |
0.223 (1.00) |
1 (1.00) |
0.0772 (1.00) |
0.0443 (1.00) |
1 (1.00) |
0.736 (1.00) |
|
| KRAS | 3 (1%) | 238 |
0.873 (1.00) |
0.571 (1.00) |
0.149 (1.00) |
1 (1.00) |
1 (1.00) |
0.589 (1.00) |
0.863 (1.00) |
0.93 (1.00) |
1 (1.00) |
|||||
| SLC5A11 | 3 (1%) | 238 |
0.273 (1.00) |
0.571 (1.00) |
0.601 (1.00) |
1 (1.00) |
1 (1.00) |
1 (1.00) |
1 (1.00) |
0.727 (1.00) |
1 (1.00) |
0.93 (1.00) |
0.602 (1.00) |
|||
| PRG4 | 3 (1%) | 238 |
0.666 (1.00) |
1 (1.00) |
0.216 (1.00) |
1 (1.00) |
1 (1.00) |
0.106 (1.00) |
1 (1.00) |
0.403 (1.00) |
1 (1.00) |
0.825 (1.00) |
0.93 (1.00) |
0.249 (1.00) |
0.0214 (1.00) |
|
| SLC26A11 | 3 (1%) | 238 |
0.406 (1.00) |
0.163 (1.00) |
0.291 (1.00) |
1 (1.00) |
1 (1.00) |
0.106 (1.00) |
1 (1.00) |
0.863 (1.00) |
1 (1.00) |
0.433 (1.00) |
0.669 (1.00) |
1 (1.00) |
0.211 (1.00) |
|
| ANKRD30A | 3 (1%) | 238 |
0.298 (1.00) |
1 (1.00) |
1 (1.00) |
1 (1.00) |
1 (1.00) |
0.589 (1.00) |
0.677 (1.00) |
0.987 (1.00) |
0.425 (1.00) |
1 (1.00) |
||||
| FAM155A | 3 (1%) | 238 |
0.165 (1.00) |
1 (1.00) |
0.216 (1.00) |
1 (1.00) |
1 (1.00) |
0.294 (1.00) |
1 (1.00) |
0.863 (1.00) |
1 (1.00) |
0.785 (1.00) |
0.93 (1.00) |
0.249 (1.00) |
||
| ZFHX3 | 5 (2%) | 236 |
0.97 (1.00) |
1 (1.00) |
0.315 (1.00) |
0.227 (1.00) |
1 (1.00) |
1 (1.00) |
0.147 (1.00) |
0.238 (1.00) |
0.555 (1.00) |
0.402 (1.00) |
0.341 (1.00) |
0.0621 (1.00) |
0.576 (1.00) |
|
| ARMCX3 | 3 (1%) | 238 |
0.534 (1.00) |
0.571 (1.00) |
1 (1.00) |
1 (1.00) |
1 (1.00) |
1 (1.00) |
1 (1.00) |
0.539 (1.00) |
1 (1.00) |
0.669 (1.00) |
0.602 (1.00) |
0.0389 (1.00) |
||
| COL5A3 | 5 (2%) | 236 |
0.413 (1.00) |
0.332 (1.00) |
0.753 (1.00) |
1 (1.00) |
1 (1.00) |
0.44 (1.00) |
1 (1.00) |
0.883 (1.00) |
0.555 (1.00) |
0.282 (1.00) |
0.641 (1.00) |
0.374 (1.00) |
0.274 (1.00) |
|
| CDC27 | 3 (1%) | 238 |
0.787 (1.00) |
0.571 (1.00) |
1 (1.00) |
1 (1.00) |
0.136 (1.00) |
0.589 (1.00) |
0.576 (1.00) |
0.539 (1.00) |
1 (1.00) |
0.779 (1.00) |
1 (1.00) |
P value = 1.91e-20 (Fisher's exact test), Q value = 6.3e-18
Table S1. Gene #1: 'BRAF MUTATION STATUS' versus Clinical Feature #3: 'HISTOLOGICAL.TYPE'
| nPatients | OTHER | THYROID PAPILLARY CARCINOMA - CLASSICAL/USUAL | THYROID PAPILLARY CARCINOMA - FOLLICULAR (>= 99% FOLLICULAR PATTERNED) | THYROID PAPILLARY CARCINOMA - TALL CELL (>= 50% TALL CELL FEATURES) |
|---|---|---|---|---|
| ALL | 19 | 128 | 71 | 23 |
| BRAF MUTATED | 4 | 98 | 12 | 21 |
| BRAF WILD-TYPE | 15 | 30 | 59 | 2 |
Figure S1. Get High-res Image Gene #1: 'BRAF MUTATION STATUS' versus Clinical Feature #3: 'HISTOLOGICAL.TYPE'
P value = 3.27e-07 (Fisher's exact test), Q value = 0.00011
Table S2. Gene #1: 'BRAF MUTATION STATUS' versus Clinical Feature #7: 'EXTRATHYROIDAL.EXTENSION'
| nPatients | MINIMAL (T3) | MODERATE/ADVANCED (T4A) | NONE |
|---|---|---|---|
| ALL | 54 | 3 | 173 |
| BRAF MUTATED | 46 | 3 | 82 |
| BRAF WILD-TYPE | 8 | 0 | 91 |
Figure S2. Get High-res Image Gene #1: 'BRAF MUTATION STATUS' versus Clinical Feature #7: 'EXTRATHYROIDAL.EXTENSION'
P value = 0.00057 (Chi-square test), Q value = 0.19
Table S3. Gene #1: 'BRAF MUTATION STATUS' versus Clinical Feature #8: 'LYMPH.NODE.METASTASIS'
| nPatients | N0 | N1 | N1A | N1B | NX |
|---|---|---|---|---|---|
| ALL | 119 | 11 | 51 | 31 | 29 |
| BRAF MUTATED | 55 | 8 | 41 | 18 | 13 |
| BRAF WILD-TYPE | 64 | 3 | 10 | 13 | 16 |
Figure S3. Get High-res Image Gene #1: 'BRAF MUTATION STATUS' versus Clinical Feature #8: 'LYMPH.NODE.METASTASIS'
P value = 0.000208 (Fisher's exact test), Q value = 0.068
Table S4. Gene #3: 'HRAS MUTATION STATUS' versus Clinical Feature #3: 'HISTOLOGICAL.TYPE'
| nPatients | OTHER | THYROID PAPILLARY CARCINOMA - CLASSICAL/USUAL | THYROID PAPILLARY CARCINOMA - FOLLICULAR (>= 99% FOLLICULAR PATTERNED) | THYROID PAPILLARY CARCINOMA - TALL CELL (>= 50% TALL CELL FEATURES) |
|---|---|---|---|---|
| ALL | 19 | 128 | 71 | 23 |
| HRAS MUTATED | 2 | 0 | 8 | 0 |
| HRAS WILD-TYPE | 17 | 128 | 63 | 23 |
Figure S4. Get High-res Image Gene #3: 'HRAS MUTATION STATUS' versus Clinical Feature #3: 'HISTOLOGICAL.TYPE'
P value = 5.23e-08 (Fisher's exact test), Q value = 1.7e-05
Table S5. Gene #4: 'NRAS MUTATION STATUS' versus Clinical Feature #3: 'HISTOLOGICAL.TYPE'
| nPatients | OTHER | THYROID PAPILLARY CARCINOMA - CLASSICAL/USUAL | THYROID PAPILLARY CARCINOMA - FOLLICULAR (>= 99% FOLLICULAR PATTERNED) | THYROID PAPILLARY CARCINOMA - TALL CELL (>= 50% TALL CELL FEATURES) |
|---|---|---|---|---|
| ALL | 19 | 128 | 71 | 23 |
| NRAS MUTATED | 2 | 1 | 18 | 0 |
| NRAS WILD-TYPE | 17 | 127 | 53 | 23 |
Figure S5. Get High-res Image Gene #4: 'NRAS MUTATION STATUS' versus Clinical Feature #3: 'HISTOLOGICAL.TYPE'

P value = 0.000611 (Chi-square test), Q value = 0.2
Table S6. Gene #7: 'CCDC15 MUTATION STATUS' versus Clinical Feature #8: 'LYMPH.NODE.METASTASIS'
| nPatients | N0 | N1 | N1A | N1B | NX |
|---|---|---|---|---|---|
| ALL | 119 | 11 | 51 | 31 | 29 |
| CCDC15 MUTATED | 1 | 2 | 0 | 2 | 0 |
| CCDC15 WILD-TYPE | 118 | 9 | 51 | 29 | 29 |
Figure S6. Get High-res Image Gene #7: 'CCDC15 MUTATION STATUS' versus Clinical Feature #8: 'LYMPH.NODE.METASTASIS'
P value = 9.63e-13 (t-test), Q value = 3.2e-10
Table S7. Gene #17: 'ATAD2 MUTATION STATUS' versus Clinical Feature #10: 'NUMBER.OF.LYMPH.NODES'
| nPatients | Mean (Std.Dev) | |
|---|---|---|
| ALL | 191 | 2.6 (4.7) |
| ATAD2 MUTATED | 3 | 0.0 (0.0) |
| ATAD2 WILD-TYPE | 188 | 2.7 (4.8) |
Figure S7. Get High-res Image Gene #17: 'ATAD2 MUTATION STATUS' versus Clinical Feature #10: 'NUMBER.OF.LYMPH.NODES'
P value = 3.16e-25 (t-test), Q value = 1.1e-22
Table S8. Gene #17: 'ATAD2 MUTATION STATUS' versus Clinical Feature #14: 'TUMOR.SIZE'
| nPatients | Mean (Std.Dev) | |
|---|---|---|
| ALL | 192 | 2.8 (1.5) |
| ATAD2 MUTATED | 3 | 1.3 (0.1) |
| ATAD2 WILD-TYPE | 189 | 2.8 (1.5) |
Figure S8. Get High-res Image Gene #17: 'ATAD2 MUTATION STATUS' versus Clinical Feature #14: 'TUMOR.SIZE'
-
Mutation data file = THCA-TP.mutsig.cluster.txt
-
Clinical data file = THCA-TP.clin.merged.picked.txt
-
Number of patients = 241
-
Number of significantly mutated genes = 27
-
Number of selected clinical features = 14
-
Exclude genes that fewer than K tumors have mutations, K = 3
For continuous numerical clinical features, two-tailed Student's t test with unequal variance (Lehmann and Romano 2005) was applied to compare the clinical values between tumors with and without gene mutations using 't.test' function in R
For binary or multi-class clinical features (nominal or ordinal), two-tailed Fisher's exact tests (Fisher 1922) were used to estimate the P values using the 'fisher.test' function in R
For multi-class clinical features (nominal or ordinal), Chi-square tests (Greenwood and Nikulin 1996) were used to estimate the P values using the 'chisq.test' function in R
For multiple hypothesis correction, Q value is the False Discovery Rate (FDR) analogue of the P value (Benjamini and Hochberg 1995), defined as the minimum FDR at which the test may be called significant. We used the 'Benjamini and Hochberg' method of 'p.adjust' function in R to convert P values into Q values.
This is an experimental feature. The full results of the analysis summarized in this report can be downloaded from the TCGA Data Coordination Center.