(primary solid tumor cohort)
This pipeline computes the correlation between significant arm-level copy number variations (cnvs) and subtypes.
Testing the association between copy number variation 45 arm-level results and 8 molecular subtypes across 470 patients, 99 significant findings detected with Q value < 0.25.
-
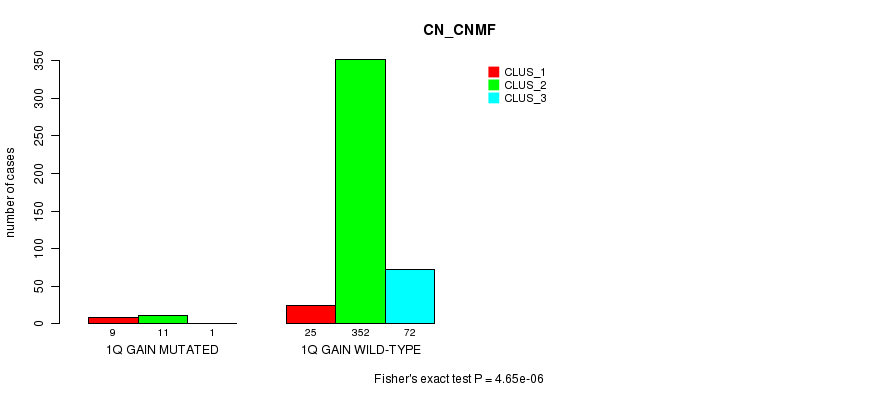
1q gain cnv correlated to 'CN_CNMF'.
-
4p gain cnv correlated to 'CN_CNMF'.
-
4q gain cnv correlated to 'CN_CNMF'.
-
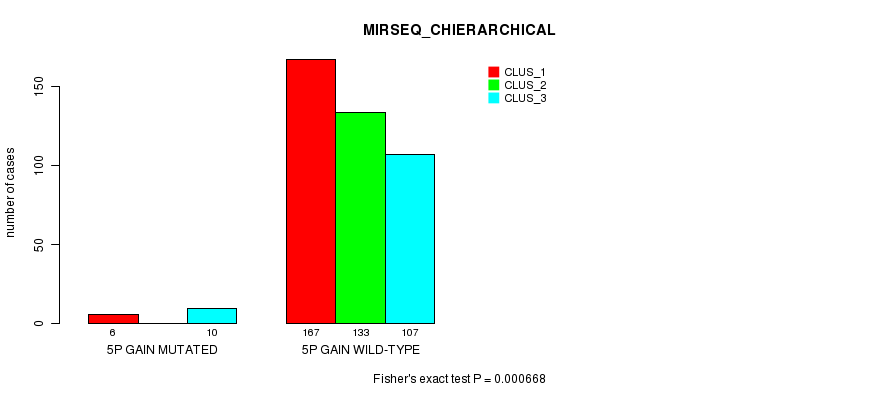
5p gain cnv correlated to 'CN_CNMF', 'METHLYATION_CNMF', and 'MIRSEQ_CHIERARCHICAL'.
-
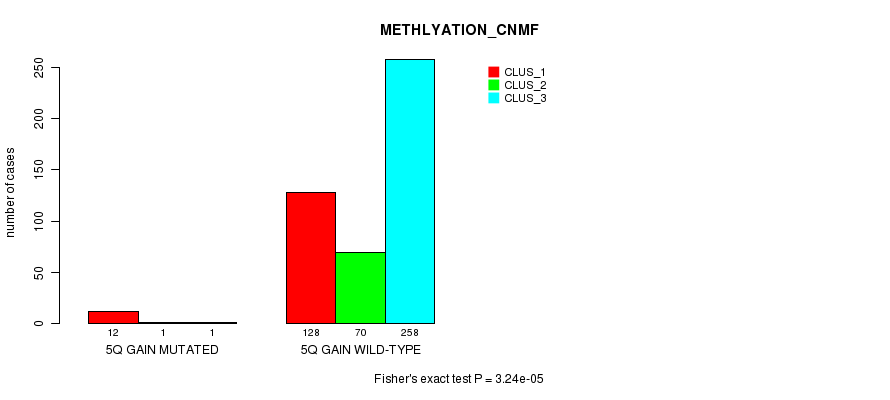
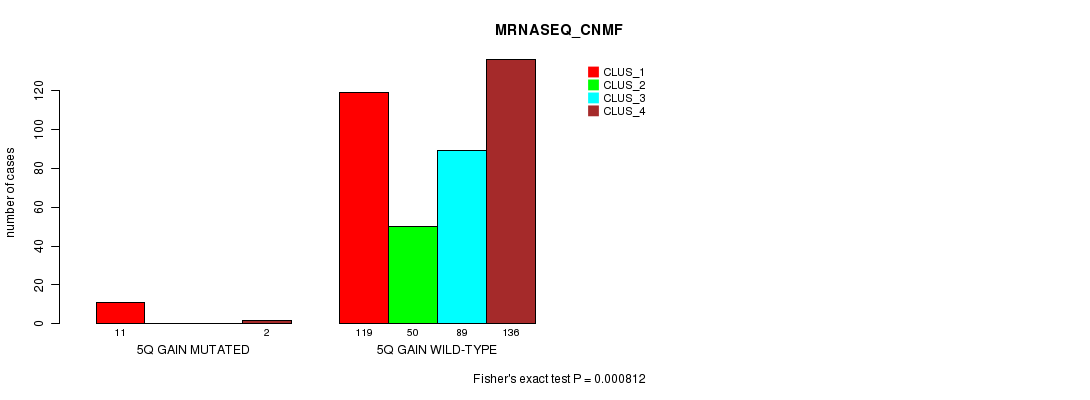
5q gain cnv correlated to 'CN_CNMF', 'METHLYATION_CNMF', 'MRNASEQ_CNMF', 'MRNASEQ_CHIERARCHICAL', 'MIRSEQ_CNMF', and 'MIRSEQ_CHIERARCHICAL'.
-
7p gain cnv correlated to 'CN_CNMF', 'METHLYATION_CNMF', 'MRNASEQ_CNMF', 'MRNASEQ_CHIERARCHICAL', and 'MIRSEQ_CHIERARCHICAL'.
-
7q gain cnv correlated to 'CN_CNMF', 'METHLYATION_CNMF', 'MRNASEQ_CNMF', 'MRNASEQ_CHIERARCHICAL', 'MIRSEQ_CNMF', and 'MIRSEQ_CHIERARCHICAL'.
-
11q gain cnv correlated to 'CN_CNMF'.
-
12p gain cnv correlated to 'CN_CNMF', 'METHLYATION_CNMF', 'MRNASEQ_CNMF', 'MRNASEQ_CHIERARCHICAL', 'MIRSEQ_CNMF', and 'MIRSEQ_CHIERARCHICAL'.
-
12q gain cnv correlated to 'CN_CNMF', 'METHLYATION_CNMF', 'MRNASEQ_CNMF', 'MRNASEQ_CHIERARCHICAL', 'MIRSEQ_CNMF', and 'MIRSEQ_CHIERARCHICAL'.
-
13q gain cnv correlated to 'CN_CNMF'.
-
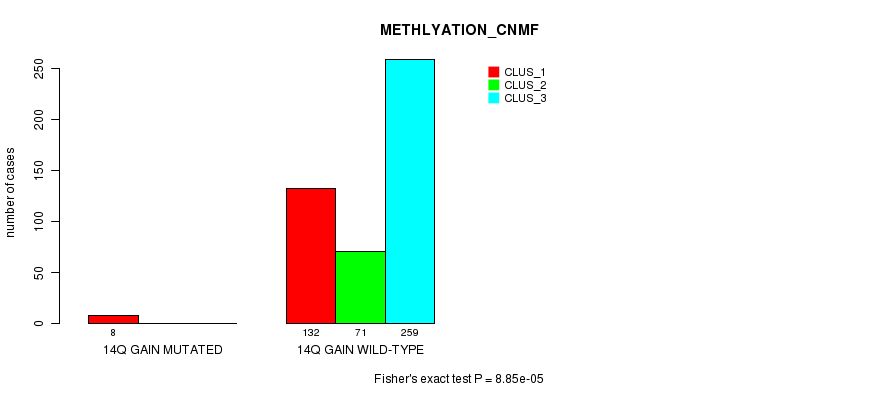
14q gain cnv correlated to 'CN_CNMF' and 'METHLYATION_CNMF'.
-
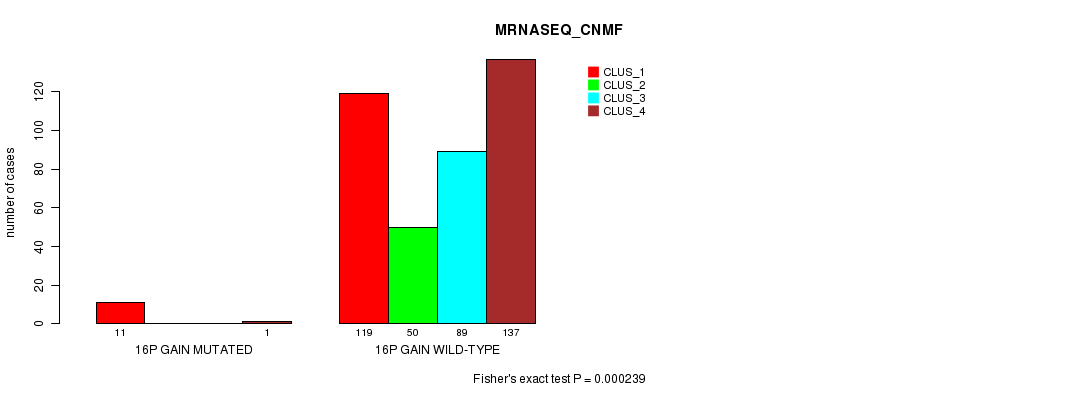
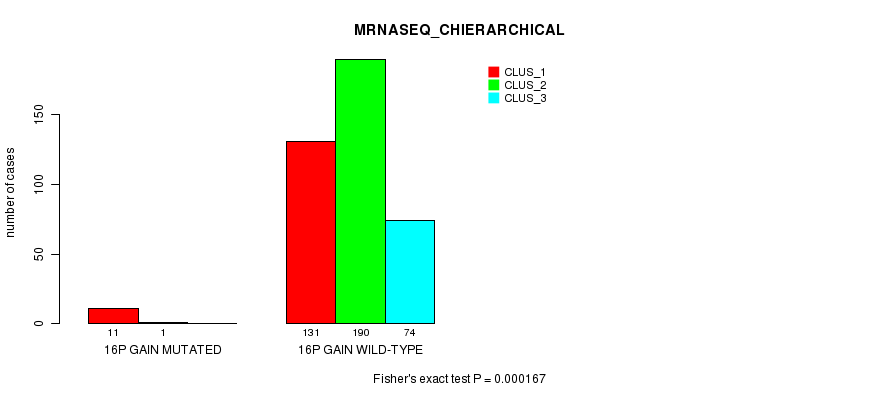
16p gain cnv correlated to 'CN_CNMF', 'METHLYATION_CNMF', 'MRNASEQ_CNMF', 'MRNASEQ_CHIERARCHICAL', 'MIRSEQ_CNMF', and 'MIRSEQ_CHIERARCHICAL'.
-
16q gain cnv correlated to 'CN_CNMF', 'METHLYATION_CNMF', 'MIRSEQ_CNMF', and 'MIRSEQ_CHIERARCHICAL'.
-
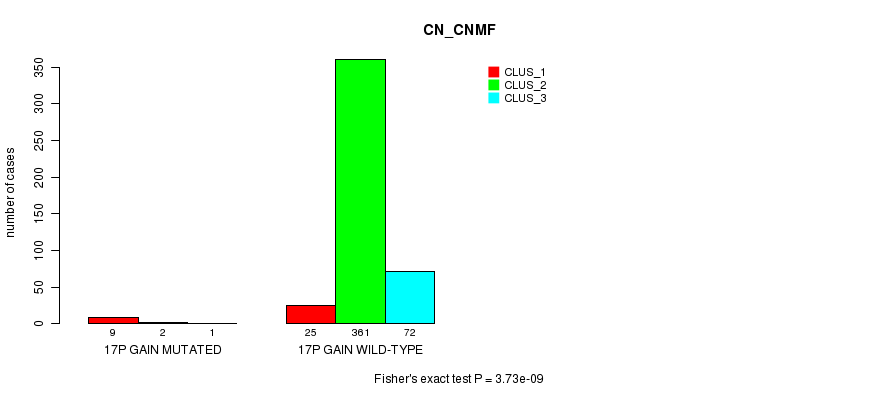
17p gain cnv correlated to 'CN_CNMF', 'METHLYATION_CNMF', 'MRNASEQ_CNMF', 'MRNASEQ_CHIERARCHICAL', 'MIRSEQ_CNMF', and 'MIRSEQ_CHIERARCHICAL'.
-
17q gain cnv correlated to 'CN_CNMF', 'METHLYATION_CNMF', 'MRNASEQ_CNMF', 'MRNASEQ_CHIERARCHICAL', 'MIRSEQ_CNMF', and 'MIRSEQ_CHIERARCHICAL'.
-
19p gain cnv correlated to 'CN_CNMF'.
-
19q gain cnv correlated to 'CN_CNMF'.
-
20p gain cnv correlated to 'CN_CNMF' and 'METHLYATION_CNMF'.
-
20q gain cnv correlated to 'CN_CNMF' and 'METHLYATION_CNMF'.
-
1p loss cnv correlated to 'CN_CNMF'.
-
2p loss cnv correlated to 'CN_CNMF', 'METHLYATION_CNMF', 'MRNASEQ_CNMF', 'MRNASEQ_CHIERARCHICAL', 'MIRSEQ_CNMF', and 'MIRSEQ_CHIERARCHICAL'.
-
2q loss cnv correlated to 'CN_CNMF', 'METHLYATION_CNMF', 'MIRSEQ_CNMF', and 'MIRSEQ_CHIERARCHICAL'.
-
3q loss cnv correlated to 'CN_CNMF'.
-
8p loss cnv correlated to 'CN_CNMF'.
-
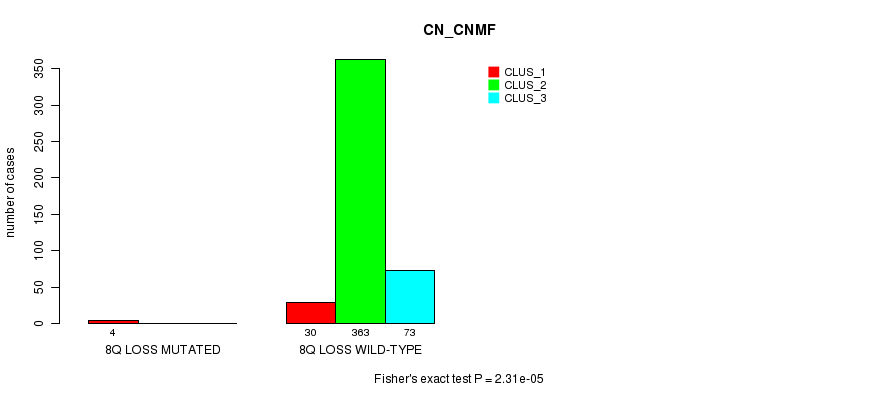
8q loss cnv correlated to 'CN_CNMF'.
-
9p loss cnv correlated to 'CN_CNMF'.
-
9q loss cnv correlated to 'CN_CNMF'.
-
10p loss cnv correlated to 'CN_CNMF'.
-
10q loss cnv correlated to 'CN_CNMF'.
-
11p loss cnv correlated to 'CN_CNMF'.
-
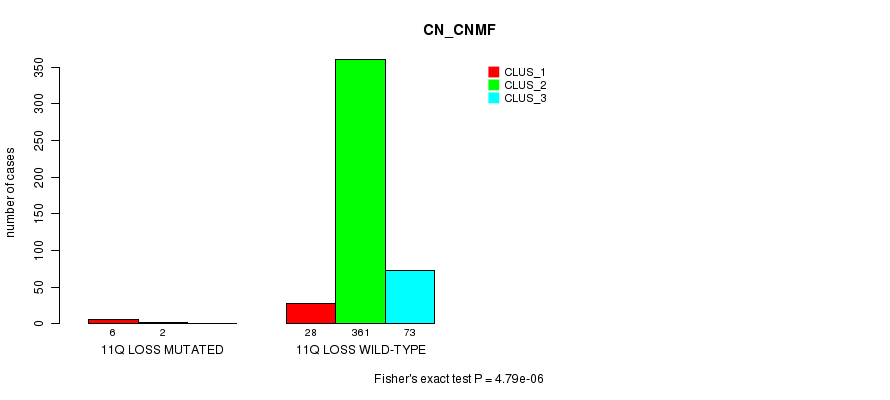
11q loss cnv correlated to 'CN_CNMF'.
-
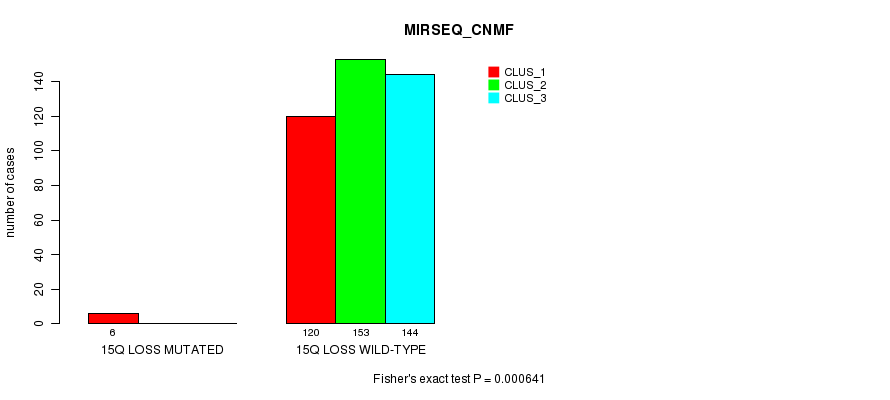
15q loss cnv correlated to 'CN_CNMF', 'MIRSEQ_CNMF', and 'MIRSEQ_CHIERARCHICAL'.
-
18p loss cnv correlated to 'CN_CNMF'.
-
18q loss cnv correlated to 'CN_CNMF'.
-
21q loss cnv correlated to 'CN_CNMF'.
-
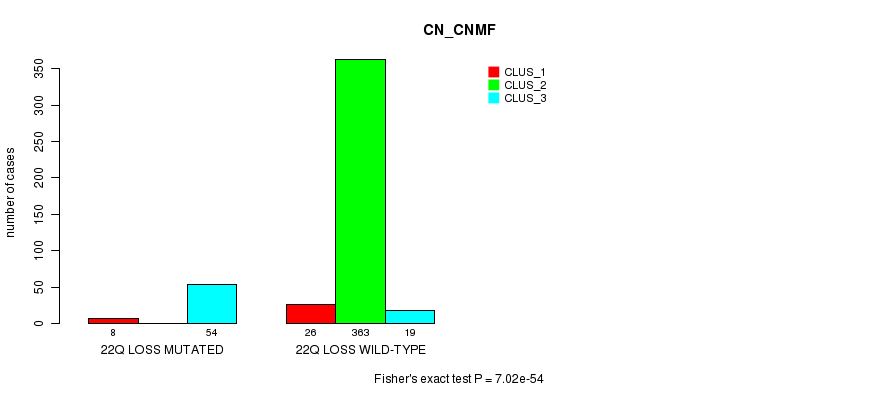
22q loss cnv correlated to 'CN_CNMF', 'METHLYATION_CNMF', 'MRNASEQ_CNMF', 'MRNASEQ_CHIERARCHICAL', 'MIRSEQ_CNMF', and 'MIRSEQ_CHIERARCHICAL'.
Table 1. Get Full Table Overview of the association between significant copy number variation of 45 arm-level results and 8 molecular subtypes. Shown in the table are P values (Q values). Thresholded by Q value < 0.25, 99 significant findings detected.
|
Molecular subtypes |
CN CNMF |
METHLYATION CNMF |
RPPA CNMF |
RPPA CHIERARCHICAL |
MRNASEQ CNMF |
MRNASEQ CHIERARCHICAL |
MIRSEQ CNMF |
MIRSEQ CHIERARCHICAL |
||
| nCNV (%) | nWild-Type | Fisher's exact test | Fisher's exact test | Fisher's exact test | Fisher's exact test | Fisher's exact test | Fisher's exact test | Fisher's exact test | Fisher's exact test | |
| 5q gain | 14 (3%) | 456 |
5.75e-18 (1.79e-15) |
3.24e-05 (0.00851) |
0.901 (1.00) |
0.0299 (1.00) |
0.000812 (0.179) |
0.000952 (0.209) |
0.00104 (0.229) |
0.00014 (0.0351) |
| 7q gain | 19 (4%) | 451 |
4.86e-23 (1.53e-20) |
3.72e-05 (0.00968) |
0.689 (1.00) |
0.00298 (0.6) |
0.000286 (0.0687) |
0.000176 (0.0438) |
0.000214 (0.0526) |
4.94e-05 (0.0127) |
| 12p gain | 11 (2%) | 459 |
1.79e-12 (5.52e-10) |
3.2e-06 (0.000926) |
0.901 (1.00) |
0.0299 (1.00) |
1.83e-05 (0.00506) |
1.93e-05 (0.00526) |
3.39e-05 (0.00888) |
1.87e-05 (0.00515) |
| 12q gain | 12 (3%) | 458 |
2.23e-12 (6.85e-10) |
6.84e-07 (2e-04) |
0.901 (1.00) |
0.0299 (1.00) |
7.78e-06 (0.00219) |
4.91e-06 (0.0014) |
1.09e-05 (0.00303) |
5.32e-06 (0.00151) |
| 16p gain | 12 (3%) | 458 |
1.02e-13 (3.17e-11) |
2.89e-05 (0.00764) |
1 (1.00) |
0.0445 (1.00) |
0.000239 (0.0587) |
0.000167 (0.0418) |
9.46e-05 (0.0239) |
7.74e-05 (0.0198) |
| 17p gain | 12 (3%) | 458 |
3.73e-09 (1.13e-06) |
6.84e-07 (2e-04) |
0.772 (1.00) |
0.0179 (1.00) |
1.83e-05 (0.00506) |
1.93e-05 (0.00526) |
3.39e-05 (0.00888) |
1.87e-05 (0.00515) |
| 17q gain | 13 (3%) | 457 |
5.93e-09 (1.78e-06) |
1.53e-07 (4.49e-05) |
0.795 (1.00) |
0.0206 (1.00) |
7.78e-06 (0.00219) |
4.91e-06 (0.0014) |
1.09e-05 (0.00303) |
5.32e-06 (0.00151) |
| 2p loss | 8 (2%) | 462 |
7.39e-09 (2.21e-06) |
8.85e-05 (0.0226) |
1 (1.00) |
0.0817 (1.00) |
0.000731 (0.164) |
0.000334 (0.0799) |
5.28e-05 (0.0136) |
2.87e-05 (0.0076) |
| 22q loss | 62 (13%) | 408 |
7.02e-54 (2.22e-51) |
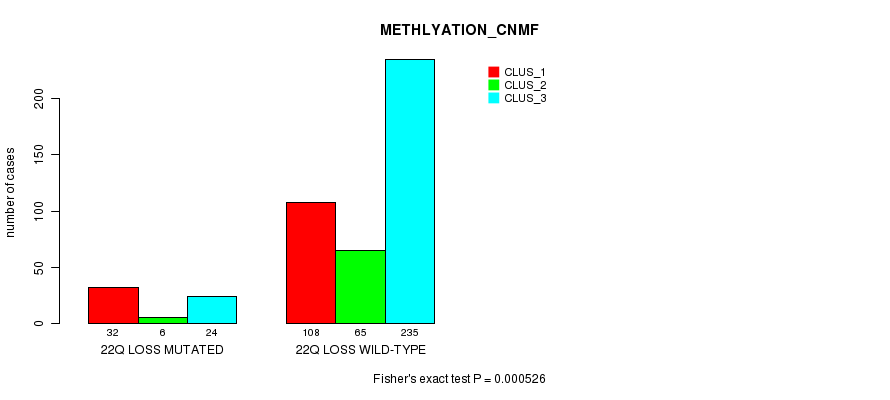
0.000526 (0.122) |
0.114 (1.00) |
0.0835 (1.00) |
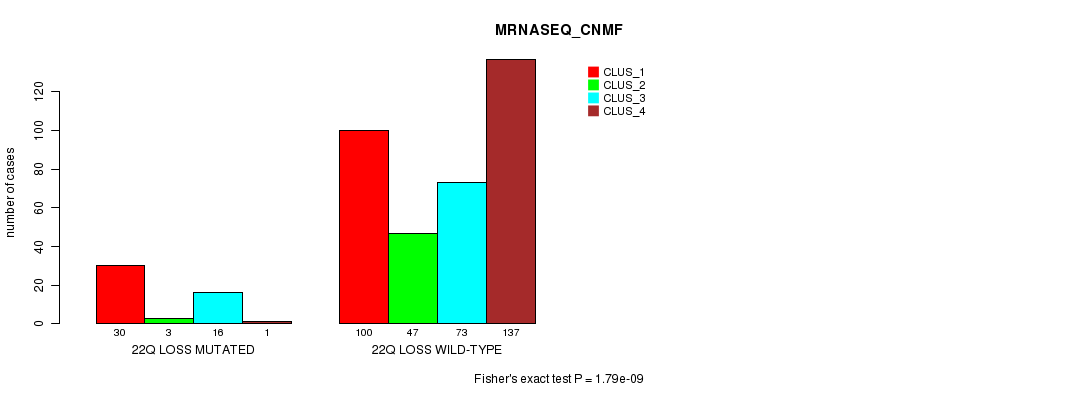
1.79e-09 (5.41e-07) |
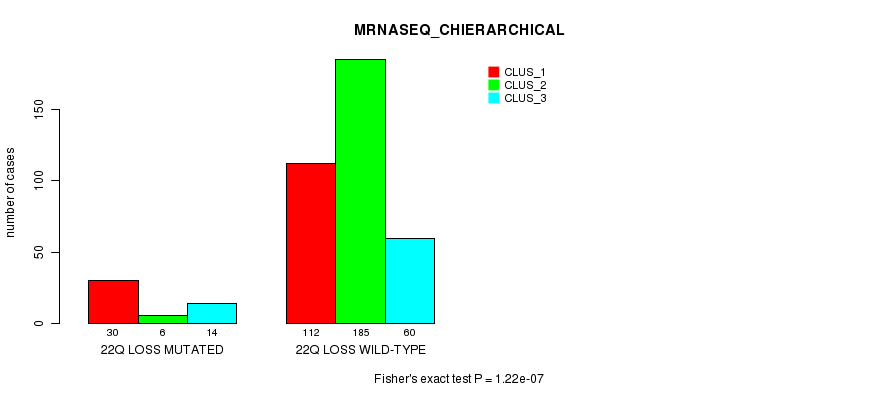
1.22e-07 (3.59e-05) |
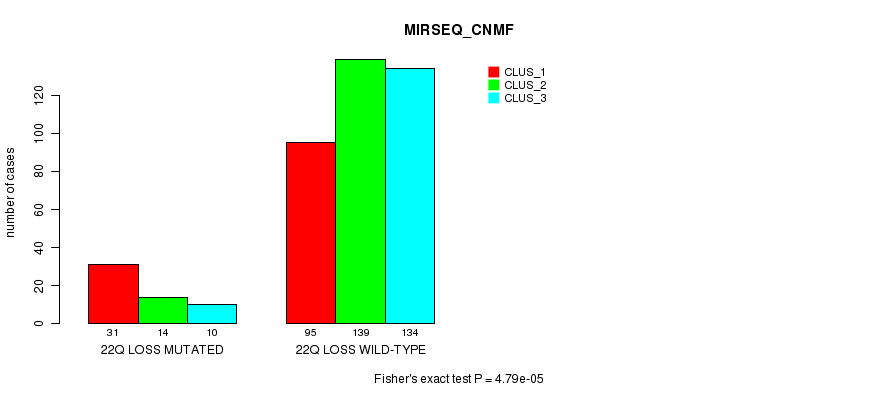
4.79e-05 (0.0124) |
4.64e-06 (0.00134) |
| 7p gain | 17 (4%) | 453 |
4.17e-22 (1.31e-19) |
0.000198 (0.0489) |
1 (1.00) |
0.0129 (1.00) |
0.000704 (0.16) |
0.000607 (0.14) |
0.00178 (0.377) |
0.000414 (0.0965) |
| 16q gain | 10 (2%) | 460 |
9.96e-13 (3.08e-10) |
0.000255 (0.0615) |
0.856 (1.00) |
0.129 (1.00) |
0.00204 (0.429) |
0.00146 (0.313) |
0.00107 (0.233) |
0.000706 (0.16) |
| 2q loss | 7 (1%) | 463 |
5.6e-09 (1.68e-06) |
0.00038 (0.0892) |
0.837 (1.00) |
0.0549 (1.00) |
0.00213 (0.446) |
0.00122 (0.264) |
0.000185 (0.0458) |
0.000108 (0.0273) |
| 5p gain | 17 (4%) | 453 |
1.72e-19 (5.39e-17) |
0.000766 (0.172) |
1 (1.00) |
0.125 (1.00) |
0.00945 (1.00) |
0.01 (1.00) |
0.00564 (1.00) |
0.000668 (0.152) |
| 15q loss | 6 (1%) | 464 |
0.000427 (0.099) |
0.00547 (1.00) |
0.458 (1.00) |
0.256 (1.00) |
0.0173 (1.00) |
0.00933 (1.00) |
0.000641 (0.147) |
0.000407 (0.0953) |
| 14q gain | 8 (2%) | 462 |
7.39e-09 (2.21e-06) |
8.85e-05 (0.0226) |
1 (1.00) |
0.256 (1.00) |
0.00213 (0.446) |
0.00122 (0.264) |
0.00296 (0.597) |
0.00247 (0.509) |
| 20p gain | 9 (2%) | 461 |
1.84e-11 (5.6e-09) |
0.000789 (0.176) |
1 (1.00) |
0.0817 (1.00) |
0.0134 (1.00) |
0.0136 (1.00) |
0.0101 (1.00) |
0.00804 (1.00) |
| 20q gain | 9 (2%) | 461 |
1.84e-11 (5.6e-09) |
0.000789 (0.176) |
1 (1.00) |
0.0817 (1.00) |
0.0134 (1.00) |
0.0136 (1.00) |
0.0101 (1.00) |
0.00804 (1.00) |
| 1q gain | 21 (4%) | 449 |
4.65e-06 (0.00134) |
0.0818 (1.00) |
0.0153 (1.00) |
0.0826 (1.00) |
0.0325 (1.00) |
0.0233 (1.00) |
0.198 (1.00) |
0.242 (1.00) |
| 4p gain | 4 (1%) | 466 |
2.31e-05 (0.00624) |
0.0195 (1.00) |
0.0371 (1.00) |
0.0346 (1.00) |
0.073 (1.00) |
0.137 (1.00) |
||
| 4q gain | 4 (1%) | 466 |
2.31e-05 (0.00624) |
0.0195 (1.00) |
0.0371 (1.00) |
0.0346 (1.00) |
0.073 (1.00) |
0.137 (1.00) |
||
| 11q gain | 4 (1%) | 466 |
0.000241 (0.0587) |
0.0195 (1.00) |
0.0371 (1.00) |
0.0346 (1.00) |
0.00761 (1.00) |
0.00564 (1.00) |
||
| 13q gain | 3 (1%) | 467 |
0.000348 (0.0828) |
0.0496 (1.00) |
||||||
| 19p gain | 4 (1%) | 466 |
2.31e-05 (0.00624) |
0.0195 (1.00) |
0.101 (1.00) |
0.0821 (1.00) |
0.026 (1.00) |
0.0208 (1.00) |
||
| 19q gain | 5 (1%) | 465 |
1.49e-06 (0.000433) |
0.00437 (0.874) |
0.636 (1.00) |
0.0551 (1.00) |
0.0371 (1.00) |
0.0346 (1.00) |
0.00761 (1.00) |
0.00564 (1.00) |
| 1p loss | 3 (1%) | 467 |
0.000348 (0.0828) |
0.412 (1.00) |
0.487 (1.00) |
0.195 (1.00) |
0.202 (1.00) |
0.367 (1.00) |
||
| 3q loss | 3 (1%) | 467 |
0.000348 (0.0828) |
0.0496 (1.00) |
0.101 (1.00) |
0.0821 (1.00) |
0.026 (1.00) |
0.0208 (1.00) |
||
| 8p loss | 4 (1%) | 466 |
2.31e-05 (0.00624) |
0.0474 (1.00) |
0.0371 (1.00) |
0.0346 (1.00) |
0.00761 (1.00) |
0.00564 (1.00) |
||
| 8q loss | 4 (1%) | 466 |
2.31e-05 (0.00624) |
0.0474 (1.00) |
0.0371 (1.00) |
0.0346 (1.00) |
0.00761 (1.00) |
0.00564 (1.00) |
||
| 9p loss | 11 (2%) | 459 |
1.04e-11 (3.19e-09) |
0.365 (1.00) |
0.559 (1.00) |
0.206 (1.00) |
0.249 (1.00) |
0.527 (1.00) |
0.151 (1.00) |
0.192 (1.00) |
| 9q loss | 16 (3%) | 454 |
1.1e-13 (3.41e-11) |
0.288 (1.00) |
0.21 (1.00) |
0.00441 (0.874) |
0.441 (1.00) |
0.823 (1.00) |
0.193 (1.00) |
0.274 (1.00) |
| 10p loss | 6 (1%) | 464 |
9.28e-08 (2.75e-05) |
0.0793 (1.00) |
0.12 (1.00) |
0.0427 (1.00) |
0.0256 (1.00) |
0.0361 (1.00) |
||
| 10q loss | 5 (1%) | 465 |
1.49e-06 (0.000433) |
0.177 (1.00) |
0.242 (1.00) |
0.0893 (1.00) |
0.073 (1.00) |
0.137 (1.00) |
||
| 11p loss | 6 (1%) | 464 |
9.28e-08 (2.75e-05) |
0.0202 (1.00) |
0.499 (1.00) |
1 (1.00) |
0.0495 (1.00) |
0.166 (1.00) |
0.0256 (1.00) |
0.0361 (1.00) |
| 11q loss | 8 (2%) | 462 |
4.79e-06 (0.00137) |
0.0278 (1.00) |
0.388 (1.00) |
0.798 (1.00) |
0.0186 (1.00) |
0.0672 (1.00) |
0.00877 (1.00) |
0.00798 (1.00) |
| 18p loss | 4 (1%) | 466 |
0.000241 (0.0587) |
0.191 (1.00) |
1 (1.00) |
0.369 (1.00) |
0.242 (1.00) |
0.0893 (1.00) |
0.111 (1.00) |
0.0414 (1.00) |
| 18q loss | 4 (1%) | 466 |
0.000241 (0.0587) |
0.191 (1.00) |
1 (1.00) |
0.369 (1.00) |
0.242 (1.00) |
0.0893 (1.00) |
0.111 (1.00) |
0.0414 (1.00) |
| 21q loss | 5 (1%) | 465 |
1.96e-05 (0.00531) |
0.0132 (1.00) |
0.384 (1.00) |
0.0551 (1.00) |
0.0495 (1.00) |
0.166 (1.00) |
0.0256 (1.00) |
0.0361 (1.00) |
| 11p gain | 5 (1%) | 465 |
0.00151 (0.321) |
0.00437 (0.874) |
0.0173 (1.00) |
0.00933 (1.00) |
0.00222 (0.459) |
0.00152 (0.322) |
||
| 18p gain | 3 (1%) | 467 |
0.00273 (0.56) |
0.0496 (1.00) |
||||||
| 18q gain | 3 (1%) | 467 |
0.00273 (0.56) |
0.0496 (1.00) |
||||||
| 21q gain | 3 (1%) | 467 |
0.00273 (0.56) |
0.0496 (1.00) |
0.101 (1.00) |
0.0821 (1.00) |
0.026 (1.00) |
0.0208 (1.00) |
||
| 6q loss | 3 (1%) | 467 |
0.0234 (1.00) |
0.0496 (1.00) |
0.101 (1.00) |
0.0821 (1.00) |
0.026 (1.00) |
0.0208 (1.00) |
||
| 13q loss | 11 (2%) | 459 |
0.0136 (1.00) |
0.0184 (1.00) |
0.0779 (1.00) |
1 (1.00) |
0.0941 (1.00) |
0.116 (1.00) |
0.00769 (1.00) |
0.0142 (1.00) |
| 17p loss | 7 (1%) | 463 |
0.00134 (0.288) |
1 (1.00) |
1 (1.00) |
1 (1.00) |
0.826 (1.00) |
0.886 (1.00) |
0.403 (1.00) |
0.495 (1.00) |
| 19p loss | 4 (1%) | 466 |
0.138 (1.00) |
0.0195 (1.00) |
0.281 (1.00) |
0.369 (1.00) |
0.0371 (1.00) |
0.0346 (1.00) |
0.00761 (1.00) |
0.00564 (1.00) |
P value = 4.65e-06 (Fisher's exact test), Q value = 0.0013
Table S1. Gene #1: '1q gain mutation analysis' versus Clinical Feature #1: 'CN_CNMF'
| nPatients | CLUS_1 | CLUS_2 | CLUS_3 |
|---|---|---|---|
| ALL | 34 | 363 | 73 |
| 1Q GAIN MUTATED | 9 | 11 | 1 |
| 1Q GAIN WILD-TYPE | 25 | 352 | 72 |
Figure S1. Get High-res Image Gene #1: '1q gain mutation analysis' versus Clinical Feature #1: 'CN_CNMF'
P value = 2.31e-05 (Fisher's exact test), Q value = 0.0062
Table S2. Gene #2: '4p gain mutation analysis' versus Clinical Feature #1: 'CN_CNMF'
| nPatients | CLUS_1 | CLUS_2 | CLUS_3 |
|---|---|---|---|
| ALL | 34 | 363 | 73 |
| 4P GAIN MUTATED | 4 | 0 | 0 |
| 4P GAIN WILD-TYPE | 30 | 363 | 73 |
Figure S2. Get High-res Image Gene #2: '4p gain mutation analysis' versus Clinical Feature #1: 'CN_CNMF'

P value = 2.31e-05 (Fisher's exact test), Q value = 0.0062
Table S3. Gene #3: '4q gain mutation analysis' versus Clinical Feature #1: 'CN_CNMF'
| nPatients | CLUS_1 | CLUS_2 | CLUS_3 |
|---|---|---|---|
| ALL | 34 | 363 | 73 |
| 4Q GAIN MUTATED | 4 | 0 | 0 |
| 4Q GAIN WILD-TYPE | 30 | 363 | 73 |
Figure S3. Get High-res Image Gene #3: '4q gain mutation analysis' versus Clinical Feature #1: 'CN_CNMF'

P value = 1.72e-19 (Fisher's exact test), Q value = 5.4e-17
Table S4. Gene #4: '5p gain mutation analysis' versus Clinical Feature #1: 'CN_CNMF'
| nPatients | CLUS_1 | CLUS_2 | CLUS_3 |
|---|---|---|---|
| ALL | 34 | 363 | 73 |
| 5P GAIN MUTATED | 16 | 1 | 0 |
| 5P GAIN WILD-TYPE | 18 | 362 | 73 |
Figure S4. Get High-res Image Gene #4: '5p gain mutation analysis' versus Clinical Feature #1: 'CN_CNMF'

P value = 0.000766 (Fisher's exact test), Q value = 0.17
Table S5. Gene #4: '5p gain mutation analysis' versus Clinical Feature #2: 'METHLYATION_CNMF'
| nPatients | CLUS_1 | CLUS_2 | CLUS_3 |
|---|---|---|---|
| ALL | 140 | 71 | 259 |
| 5P GAIN MUTATED | 12 | 2 | 3 |
| 5P GAIN WILD-TYPE | 128 | 69 | 256 |
Figure S5. Get High-res Image Gene #4: '5p gain mutation analysis' versus Clinical Feature #2: 'METHLYATION_CNMF'

P value = 0.000668 (Fisher's exact test), Q value = 0.15
Table S6. Gene #4: '5p gain mutation analysis' versus Clinical Feature #8: 'MIRSEQ_CHIERARCHICAL'
| nPatients | CLUS_1 | CLUS_2 | CLUS_3 |
|---|---|---|---|
| ALL | 173 | 133 | 117 |
| 5P GAIN MUTATED | 6 | 0 | 10 |
| 5P GAIN WILD-TYPE | 167 | 133 | 107 |
Figure S6. Get High-res Image Gene #4: '5p gain mutation analysis' versus Clinical Feature #8: 'MIRSEQ_CHIERARCHICAL'
P value = 5.75e-18 (Fisher's exact test), Q value = 1.8e-15
Table S7. Gene #5: '5q gain mutation analysis' versus Clinical Feature #1: 'CN_CNMF'
| nPatients | CLUS_1 | CLUS_2 | CLUS_3 |
|---|---|---|---|
| ALL | 34 | 363 | 73 |
| 5Q GAIN MUTATED | 14 | 0 | 0 |
| 5Q GAIN WILD-TYPE | 20 | 363 | 73 |
Figure S7. Get High-res Image Gene #5: '5q gain mutation analysis' versus Clinical Feature #1: 'CN_CNMF'

P value = 3.24e-05 (Fisher's exact test), Q value = 0.0085
Table S8. Gene #5: '5q gain mutation analysis' versus Clinical Feature #2: 'METHLYATION_CNMF'
| nPatients | CLUS_1 | CLUS_2 | CLUS_3 |
|---|---|---|---|
| ALL | 140 | 71 | 259 |
| 5Q GAIN MUTATED | 12 | 1 | 1 |
| 5Q GAIN WILD-TYPE | 128 | 70 | 258 |
Figure S8. Get High-res Image Gene #5: '5q gain mutation analysis' versus Clinical Feature #2: 'METHLYATION_CNMF'
P value = 0.000812 (Fisher's exact test), Q value = 0.18
Table S9. Gene #5: '5q gain mutation analysis' versus Clinical Feature #5: 'MRNASEQ_CNMF'
| nPatients | CLUS_1 | CLUS_2 | CLUS_3 | CLUS_4 |
|---|---|---|---|---|
| ALL | 130 | 50 | 89 | 138 |
| 5Q GAIN MUTATED | 11 | 0 | 0 | 2 |
| 5Q GAIN WILD-TYPE | 119 | 50 | 89 | 136 |
Figure S9. Get High-res Image Gene #5: '5q gain mutation analysis' versus Clinical Feature #5: 'MRNASEQ_CNMF'
P value = 0.000952 (Fisher's exact test), Q value = 0.21
Table S10. Gene #5: '5q gain mutation analysis' versus Clinical Feature #6: 'MRNASEQ_CHIERARCHICAL'
| nPatients | CLUS_1 | CLUS_2 | CLUS_3 |
|---|---|---|---|
| ALL | 142 | 191 | 74 |
| 5Q GAIN MUTATED | 11 | 2 | 0 |
| 5Q GAIN WILD-TYPE | 131 | 189 | 74 |
Figure S10. Get High-res Image Gene #5: '5q gain mutation analysis' versus Clinical Feature #6: 'MRNASEQ_CHIERARCHICAL'

P value = 0.00104 (Fisher's exact test), Q value = 0.23
Table S11. Gene #5: '5q gain mutation analysis' versus Clinical Feature #7: 'MIRSEQ_CNMF'
| nPatients | CLUS_1 | CLUS_2 | CLUS_3 |
|---|---|---|---|
| ALL | 126 | 153 | 144 |
| 5Q GAIN MUTATED | 10 | 1 | 2 |
| 5Q GAIN WILD-TYPE | 116 | 152 | 142 |
Figure S11. Get High-res Image Gene #5: '5q gain mutation analysis' versus Clinical Feature #7: 'MIRSEQ_CNMF'

P value = 0.00014 (Fisher's exact test), Q value = 0.035
Table S12. Gene #5: '5q gain mutation analysis' versus Clinical Feature #8: 'MIRSEQ_CHIERARCHICAL'
| nPatients | CLUS_1 | CLUS_2 | CLUS_3 |
|---|---|---|---|
| ALL | 173 | 133 | 117 |
| 5Q GAIN MUTATED | 3 | 0 | 10 |
| 5Q GAIN WILD-TYPE | 170 | 133 | 107 |
Figure S12. Get High-res Image Gene #5: '5q gain mutation analysis' versus Clinical Feature #8: 'MIRSEQ_CHIERARCHICAL'

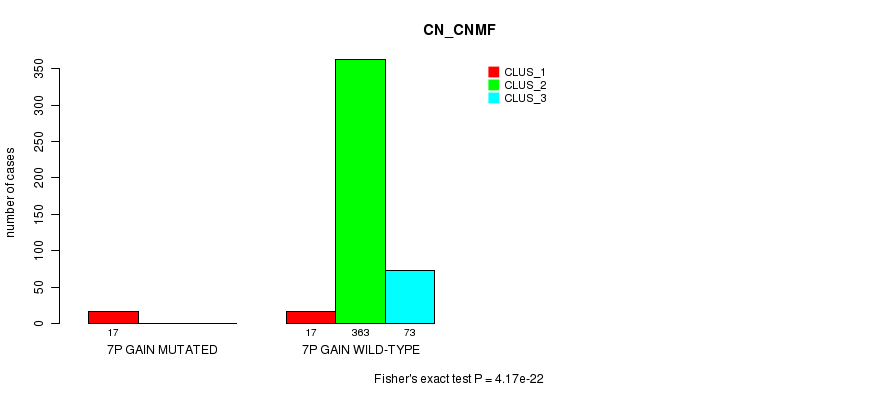
P value = 4.17e-22 (Fisher's exact test), Q value = 1.3e-19
Table S13. Gene #6: '7p gain mutation analysis' versus Clinical Feature #1: 'CN_CNMF'
| nPatients | CLUS_1 | CLUS_2 | CLUS_3 |
|---|---|---|---|
| ALL | 34 | 363 | 73 |
| 7P GAIN MUTATED | 17 | 0 | 0 |
| 7P GAIN WILD-TYPE | 17 | 363 | 73 |
Figure S13. Get High-res Image Gene #6: '7p gain mutation analysis' versus Clinical Feature #1: 'CN_CNMF'
P value = 0.000198 (Fisher's exact test), Q value = 0.049
Table S14. Gene #6: '7p gain mutation analysis' versus Clinical Feature #2: 'METHLYATION_CNMF'
| nPatients | CLUS_1 | CLUS_2 | CLUS_3 |
|---|---|---|---|
| ALL | 140 | 71 | 259 |
| 7P GAIN MUTATED | 12 | 3 | 2 |
| 7P GAIN WILD-TYPE | 128 | 68 | 257 |
Figure S14. Get High-res Image Gene #6: '7p gain mutation analysis' versus Clinical Feature #2: 'METHLYATION_CNMF'

P value = 0.000704 (Fisher's exact test), Q value = 0.16
Table S15. Gene #6: '7p gain mutation analysis' versus Clinical Feature #5: 'MRNASEQ_CNMF'
| nPatients | CLUS_1 | CLUS_2 | CLUS_3 | CLUS_4 |
|---|---|---|---|---|
| ALL | 130 | 50 | 89 | 138 |
| 7P GAIN MUTATED | 13 | 0 | 1 | 2 |
| 7P GAIN WILD-TYPE | 117 | 50 | 88 | 136 |
Figure S15. Get High-res Image Gene #6: '7p gain mutation analysis' versus Clinical Feature #5: 'MRNASEQ_CNMF'

P value = 0.000607 (Fisher's exact test), Q value = 0.14
Table S16. Gene #6: '7p gain mutation analysis' versus Clinical Feature #6: 'MRNASEQ_CHIERARCHICAL'
| nPatients | CLUS_1 | CLUS_2 | CLUS_3 |
|---|---|---|---|
| ALL | 142 | 191 | 74 |
| 7P GAIN MUTATED | 13 | 2 | 1 |
| 7P GAIN WILD-TYPE | 129 | 189 | 73 |
Figure S16. Get High-res Image Gene #6: '7p gain mutation analysis' versus Clinical Feature #6: 'MRNASEQ_CHIERARCHICAL'

P value = 0.000414 (Fisher's exact test), Q value = 0.097
Table S17. Gene #6: '7p gain mutation analysis' versus Clinical Feature #8: 'MIRSEQ_CHIERARCHICAL'
| nPatients | CLUS_1 | CLUS_2 | CLUS_3 |
|---|---|---|---|
| ALL | 173 | 133 | 117 |
| 7P GAIN MUTATED | 4 | 1 | 12 |
| 7P GAIN WILD-TYPE | 169 | 132 | 105 |
Figure S17. Get High-res Image Gene #6: '7p gain mutation analysis' versus Clinical Feature #8: 'MIRSEQ_CHIERARCHICAL'

P value = 4.86e-23 (Fisher's exact test), Q value = 1.5e-20
Table S18. Gene #7: '7q gain mutation analysis' versus Clinical Feature #1: 'CN_CNMF'
| nPatients | CLUS_1 | CLUS_2 | CLUS_3 |
|---|---|---|---|
| ALL | 34 | 363 | 73 |
| 7Q GAIN MUTATED | 18 | 0 | 1 |
| 7Q GAIN WILD-TYPE | 16 | 363 | 72 |
Figure S18. Get High-res Image Gene #7: '7q gain mutation analysis' versus Clinical Feature #1: 'CN_CNMF'

P value = 3.72e-05 (Fisher's exact test), Q value = 0.0097
Table S19. Gene #7: '7q gain mutation analysis' versus Clinical Feature #2: 'METHLYATION_CNMF'
| nPatients | CLUS_1 | CLUS_2 | CLUS_3 |
|---|---|---|---|
| ALL | 140 | 71 | 259 |
| 7Q GAIN MUTATED | 14 | 3 | 2 |
| 7Q GAIN WILD-TYPE | 126 | 68 | 257 |
Figure S19. Get High-res Image Gene #7: '7q gain mutation analysis' versus Clinical Feature #2: 'METHLYATION_CNMF'

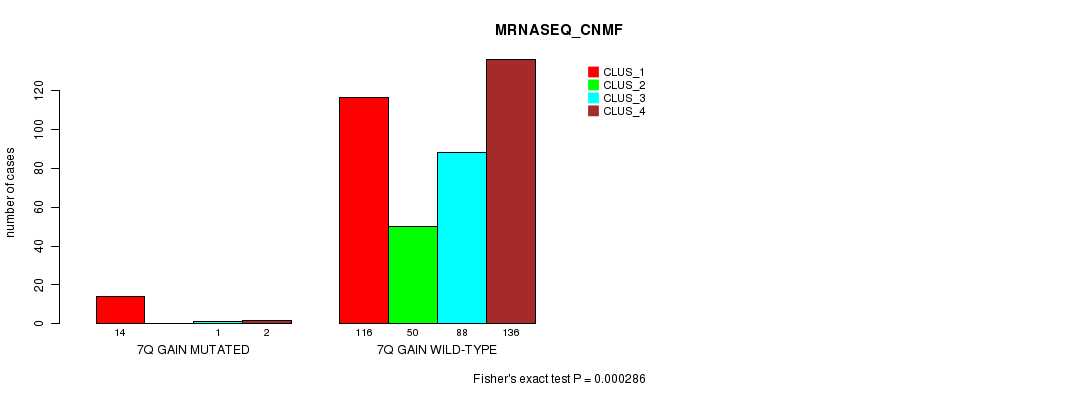
P value = 0.000286 (Fisher's exact test), Q value = 0.069
Table S20. Gene #7: '7q gain mutation analysis' versus Clinical Feature #5: 'MRNASEQ_CNMF'
| nPatients | CLUS_1 | CLUS_2 | CLUS_3 | CLUS_4 |
|---|---|---|---|---|
| ALL | 130 | 50 | 89 | 138 |
| 7Q GAIN MUTATED | 14 | 0 | 1 | 2 |
| 7Q GAIN WILD-TYPE | 116 | 50 | 88 | 136 |
Figure S20. Get High-res Image Gene #7: '7q gain mutation analysis' versus Clinical Feature #5: 'MRNASEQ_CNMF'
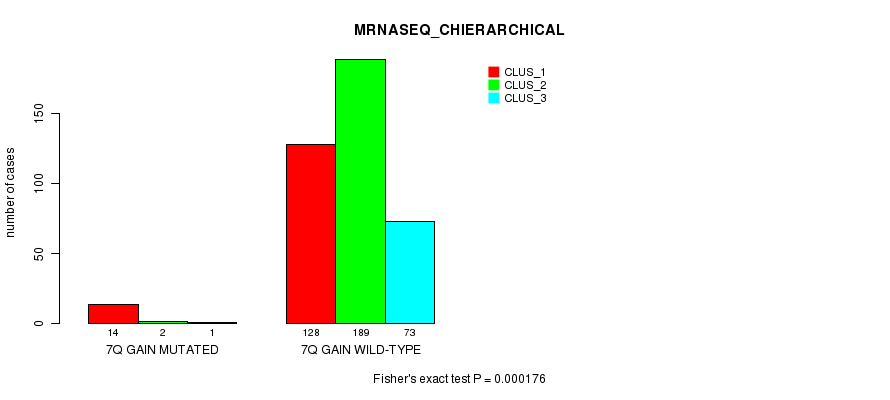
P value = 0.000176 (Fisher's exact test), Q value = 0.044
Table S21. Gene #7: '7q gain mutation analysis' versus Clinical Feature #6: 'MRNASEQ_CHIERARCHICAL'
| nPatients | CLUS_1 | CLUS_2 | CLUS_3 |
|---|---|---|---|
| ALL | 142 | 191 | 74 |
| 7Q GAIN MUTATED | 14 | 2 | 1 |
| 7Q GAIN WILD-TYPE | 128 | 189 | 73 |
Figure S21. Get High-res Image Gene #7: '7q gain mutation analysis' versus Clinical Feature #6: 'MRNASEQ_CHIERARCHICAL'
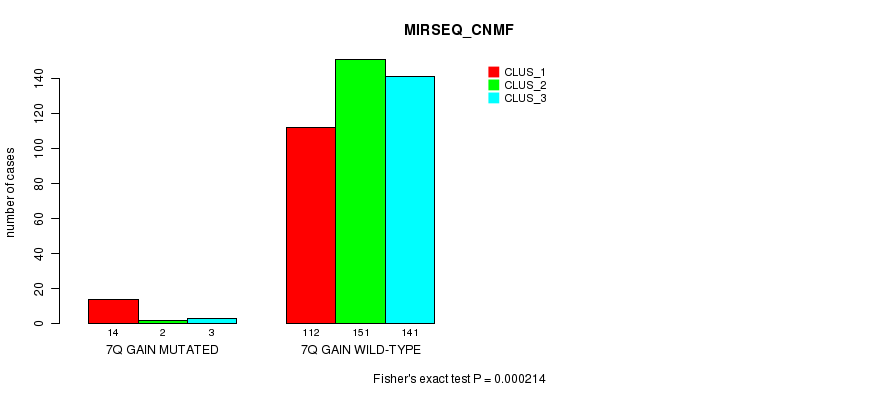
P value = 0.000214 (Fisher's exact test), Q value = 0.053
Table S22. Gene #7: '7q gain mutation analysis' versus Clinical Feature #7: 'MIRSEQ_CNMF'
| nPatients | CLUS_1 | CLUS_2 | CLUS_3 |
|---|---|---|---|
| ALL | 126 | 153 | 144 |
| 7Q GAIN MUTATED | 14 | 2 | 3 |
| 7Q GAIN WILD-TYPE | 112 | 151 | 141 |
Figure S22. Get High-res Image Gene #7: '7q gain mutation analysis' versus Clinical Feature #7: 'MIRSEQ_CNMF'
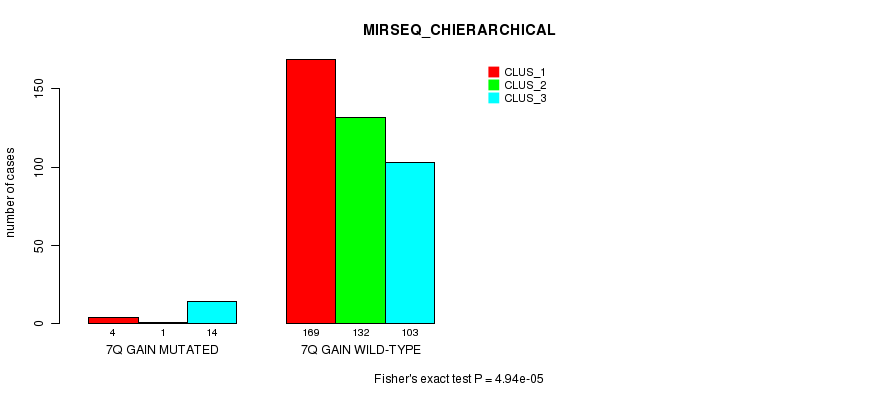
P value = 4.94e-05 (Fisher's exact test), Q value = 0.013
Table S23. Gene #7: '7q gain mutation analysis' versus Clinical Feature #8: 'MIRSEQ_CHIERARCHICAL'
| nPatients | CLUS_1 | CLUS_2 | CLUS_3 |
|---|---|---|---|
| ALL | 173 | 133 | 117 |
| 7Q GAIN MUTATED | 4 | 1 | 14 |
| 7Q GAIN WILD-TYPE | 169 | 132 | 103 |
Figure S23. Get High-res Image Gene #7: '7q gain mutation analysis' versus Clinical Feature #8: 'MIRSEQ_CHIERARCHICAL'
P value = 0.000241 (Fisher's exact test), Q value = 0.059
Table S24. Gene #9: '11q gain mutation analysis' versus Clinical Feature #1: 'CN_CNMF'
| nPatients | CLUS_1 | CLUS_2 | CLUS_3 |
|---|---|---|---|
| ALL | 34 | 363 | 73 |
| 11Q GAIN MUTATED | 3 | 0 | 1 |
| 11Q GAIN WILD-TYPE | 31 | 363 | 72 |
Figure S24. Get High-res Image Gene #9: '11q gain mutation analysis' versus Clinical Feature #1: 'CN_CNMF'

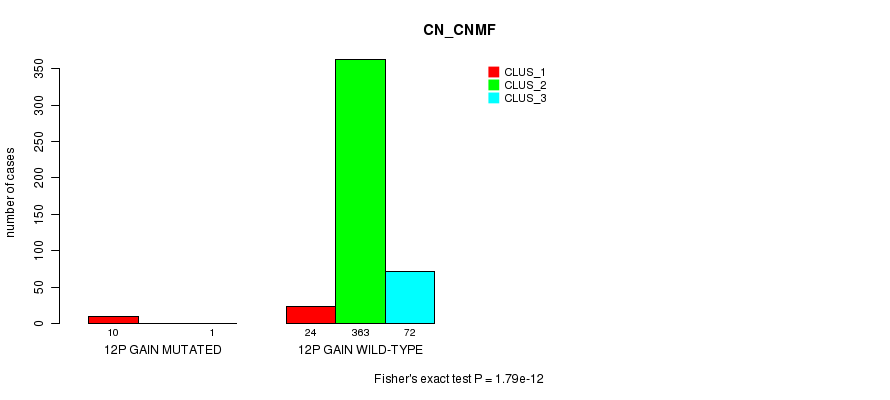
P value = 1.79e-12 (Fisher's exact test), Q value = 5.5e-10
Table S25. Gene #10: '12p gain mutation analysis' versus Clinical Feature #1: 'CN_CNMF'
| nPatients | CLUS_1 | CLUS_2 | CLUS_3 |
|---|---|---|---|
| ALL | 34 | 363 | 73 |
| 12P GAIN MUTATED | 10 | 0 | 1 |
| 12P GAIN WILD-TYPE | 24 | 363 | 72 |
Figure S25. Get High-res Image Gene #10: '12p gain mutation analysis' versus Clinical Feature #1: 'CN_CNMF'
P value = 3.2e-06 (Fisher's exact test), Q value = 0.00093
Table S26. Gene #10: '12p gain mutation analysis' versus Clinical Feature #2: 'METHLYATION_CNMF'
| nPatients | CLUS_1 | CLUS_2 | CLUS_3 |
|---|---|---|---|
| ALL | 140 | 71 | 259 |
| 12P GAIN MUTATED | 11 | 0 | 0 |
| 12P GAIN WILD-TYPE | 129 | 71 | 259 |
Figure S26. Get High-res Image Gene #10: '12p gain mutation analysis' versus Clinical Feature #2: 'METHLYATION_CNMF'

P value = 1.83e-05 (Fisher's exact test), Q value = 0.0051
Table S27. Gene #10: '12p gain mutation analysis' versus Clinical Feature #5: 'MRNASEQ_CNMF'
| nPatients | CLUS_1 | CLUS_2 | CLUS_3 | CLUS_4 |
|---|---|---|---|---|
| ALL | 130 | 50 | 89 | 138 |
| 12P GAIN MUTATED | 11 | 0 | 0 | 0 |
| 12P GAIN WILD-TYPE | 119 | 50 | 89 | 138 |
Figure S27. Get High-res Image Gene #10: '12p gain mutation analysis' versus Clinical Feature #5: 'MRNASEQ_CNMF'

P value = 1.93e-05 (Fisher's exact test), Q value = 0.0053
Table S28. Gene #10: '12p gain mutation analysis' versus Clinical Feature #6: 'MRNASEQ_CHIERARCHICAL'
| nPatients | CLUS_1 | CLUS_2 | CLUS_3 |
|---|---|---|---|
| ALL | 142 | 191 | 74 |
| 12P GAIN MUTATED | 11 | 0 | 0 |
| 12P GAIN WILD-TYPE | 131 | 191 | 74 |
Figure S28. Get High-res Image Gene #10: '12p gain mutation analysis' versus Clinical Feature #6: 'MRNASEQ_CHIERARCHICAL'

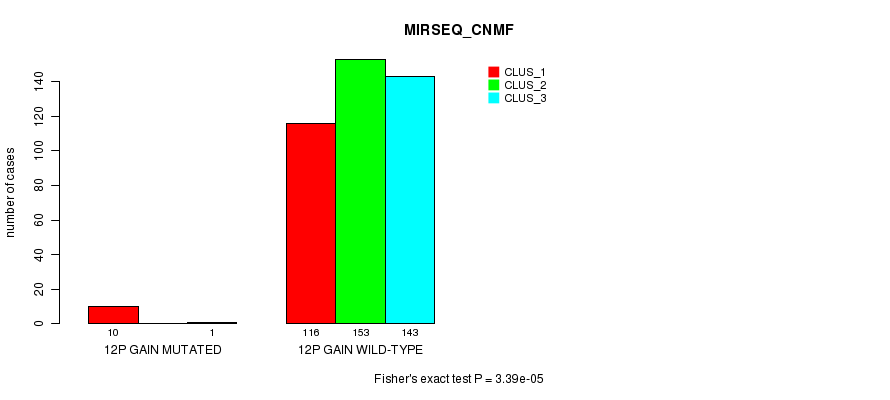
P value = 3.39e-05 (Fisher's exact test), Q value = 0.0089
Table S29. Gene #10: '12p gain mutation analysis' versus Clinical Feature #7: 'MIRSEQ_CNMF'
| nPatients | CLUS_1 | CLUS_2 | CLUS_3 |
|---|---|---|---|
| ALL | 126 | 153 | 144 |
| 12P GAIN MUTATED | 10 | 0 | 1 |
| 12P GAIN WILD-TYPE | 116 | 153 | 143 |
Figure S29. Get High-res Image Gene #10: '12p gain mutation analysis' versus Clinical Feature #7: 'MIRSEQ_CNMF'
P value = 1.87e-05 (Fisher's exact test), Q value = 0.0052
Table S30. Gene #10: '12p gain mutation analysis' versus Clinical Feature #8: 'MIRSEQ_CHIERARCHICAL'
| nPatients | CLUS_1 | CLUS_2 | CLUS_3 |
|---|---|---|---|
| ALL | 173 | 133 | 117 |
| 12P GAIN MUTATED | 1 | 0 | 10 |
| 12P GAIN WILD-TYPE | 172 | 133 | 107 |
Figure S30. Get High-res Image Gene #10: '12p gain mutation analysis' versus Clinical Feature #8: 'MIRSEQ_CHIERARCHICAL'

P value = 2.23e-12 (Fisher's exact test), Q value = 6.9e-10
Table S31. Gene #11: '12q gain mutation analysis' versus Clinical Feature #1: 'CN_CNMF'
| nPatients | CLUS_1 | CLUS_2 | CLUS_3 |
|---|---|---|---|
| ALL | 34 | 363 | 73 |
| 12Q GAIN MUTATED | 10 | 0 | 2 |
| 12Q GAIN WILD-TYPE | 24 | 363 | 71 |
Figure S31. Get High-res Image Gene #11: '12q gain mutation analysis' versus Clinical Feature #1: 'CN_CNMF'

P value = 6.84e-07 (Fisher's exact test), Q value = 2e-04
Table S32. Gene #11: '12q gain mutation analysis' versus Clinical Feature #2: 'METHLYATION_CNMF'
| nPatients | CLUS_1 | CLUS_2 | CLUS_3 |
|---|---|---|---|
| ALL | 140 | 71 | 259 |
| 12Q GAIN MUTATED | 12 | 0 | 0 |
| 12Q GAIN WILD-TYPE | 128 | 71 | 259 |
Figure S32. Get High-res Image Gene #11: '12q gain mutation analysis' versus Clinical Feature #2: 'METHLYATION_CNMF'

P value = 7.78e-06 (Fisher's exact test), Q value = 0.0022
Table S33. Gene #11: '12q gain mutation analysis' versus Clinical Feature #5: 'MRNASEQ_CNMF'
| nPatients | CLUS_1 | CLUS_2 | CLUS_3 | CLUS_4 |
|---|---|---|---|---|
| ALL | 130 | 50 | 89 | 138 |
| 12Q GAIN MUTATED | 12 | 0 | 0 | 0 |
| 12Q GAIN WILD-TYPE | 118 | 50 | 89 | 138 |
Figure S33. Get High-res Image Gene #11: '12q gain mutation analysis' versus Clinical Feature #5: 'MRNASEQ_CNMF'

P value = 4.91e-06 (Fisher's exact test), Q value = 0.0014
Table S34. Gene #11: '12q gain mutation analysis' versus Clinical Feature #6: 'MRNASEQ_CHIERARCHICAL'
| nPatients | CLUS_1 | CLUS_2 | CLUS_3 |
|---|---|---|---|
| ALL | 142 | 191 | 74 |
| 12Q GAIN MUTATED | 12 | 0 | 0 |
| 12Q GAIN WILD-TYPE | 130 | 191 | 74 |
Figure S34. Get High-res Image Gene #11: '12q gain mutation analysis' versus Clinical Feature #6: 'MRNASEQ_CHIERARCHICAL'

P value = 1.09e-05 (Fisher's exact test), Q value = 0.003
Table S35. Gene #11: '12q gain mutation analysis' versus Clinical Feature #7: 'MIRSEQ_CNMF'
| nPatients | CLUS_1 | CLUS_2 | CLUS_3 |
|---|---|---|---|
| ALL | 126 | 153 | 144 |
| 12Q GAIN MUTATED | 11 | 0 | 1 |
| 12Q GAIN WILD-TYPE | 115 | 153 | 143 |
Figure S35. Get High-res Image Gene #11: '12q gain mutation analysis' versus Clinical Feature #7: 'MIRSEQ_CNMF'

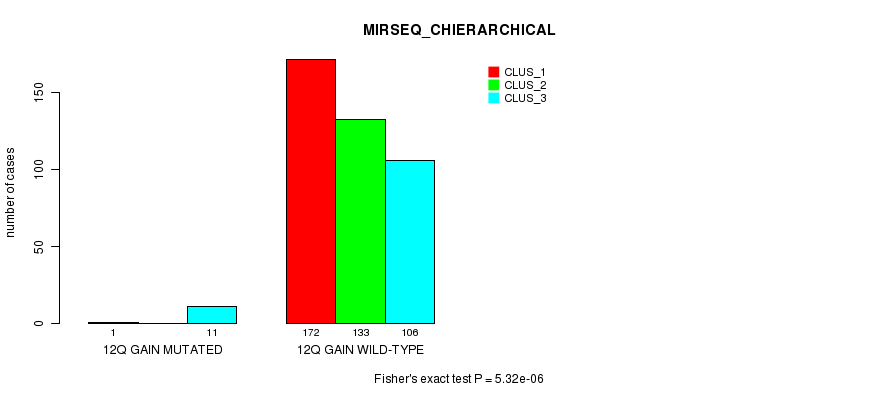
P value = 5.32e-06 (Fisher's exact test), Q value = 0.0015
Table S36. Gene #11: '12q gain mutation analysis' versus Clinical Feature #8: 'MIRSEQ_CHIERARCHICAL'
| nPatients | CLUS_1 | CLUS_2 | CLUS_3 |
|---|---|---|---|
| ALL | 173 | 133 | 117 |
| 12Q GAIN MUTATED | 1 | 0 | 11 |
| 12Q GAIN WILD-TYPE | 172 | 133 | 106 |
Figure S36. Get High-res Image Gene #11: '12q gain mutation analysis' versus Clinical Feature #8: 'MIRSEQ_CHIERARCHICAL'
P value = 0.000348 (Fisher's exact test), Q value = 0.083
Table S37. Gene #12: '13q gain mutation analysis' versus Clinical Feature #1: 'CN_CNMF'
| nPatients | CLUS_1 | CLUS_2 | CLUS_3 |
|---|---|---|---|
| ALL | 34 | 363 | 73 |
| 13Q GAIN MUTATED | 3 | 0 | 0 |
| 13Q GAIN WILD-TYPE | 31 | 363 | 73 |
Figure S37. Get High-res Image Gene #12: '13q gain mutation analysis' versus Clinical Feature #1: 'CN_CNMF'

P value = 7.39e-09 (Fisher's exact test), Q value = 2.2e-06
Table S38. Gene #13: '14q gain mutation analysis' versus Clinical Feature #1: 'CN_CNMF'
| nPatients | CLUS_1 | CLUS_2 | CLUS_3 |
|---|---|---|---|
| ALL | 34 | 363 | 73 |
| 14Q GAIN MUTATED | 7 | 0 | 1 |
| 14Q GAIN WILD-TYPE | 27 | 363 | 72 |
Figure S38. Get High-res Image Gene #13: '14q gain mutation analysis' versus Clinical Feature #1: 'CN_CNMF'

P value = 8.85e-05 (Fisher's exact test), Q value = 0.023
Table S39. Gene #13: '14q gain mutation analysis' versus Clinical Feature #2: 'METHLYATION_CNMF'
| nPatients | CLUS_1 | CLUS_2 | CLUS_3 |
|---|---|---|---|
| ALL | 140 | 71 | 259 |
| 14Q GAIN MUTATED | 8 | 0 | 0 |
| 14Q GAIN WILD-TYPE | 132 | 71 | 259 |
Figure S39. Get High-res Image Gene #13: '14q gain mutation analysis' versus Clinical Feature #2: 'METHLYATION_CNMF'
P value = 1.02e-13 (Fisher's exact test), Q value = 3.2e-11
Table S40. Gene #14: '16p gain mutation analysis' versus Clinical Feature #1: 'CN_CNMF'
| nPatients | CLUS_1 | CLUS_2 | CLUS_3 |
|---|---|---|---|
| ALL | 34 | 363 | 73 |
| 16P GAIN MUTATED | 11 | 0 | 1 |
| 16P GAIN WILD-TYPE | 23 | 363 | 72 |
Figure S40. Get High-res Image Gene #14: '16p gain mutation analysis' versus Clinical Feature #1: 'CN_CNMF'

P value = 2.89e-05 (Fisher's exact test), Q value = 0.0076
Table S41. Gene #14: '16p gain mutation analysis' versus Clinical Feature #2: 'METHLYATION_CNMF'
| nPatients | CLUS_1 | CLUS_2 | CLUS_3 |
|---|---|---|---|
| ALL | 140 | 71 | 259 |
| 16P GAIN MUTATED | 10 | 2 | 0 |
| 16P GAIN WILD-TYPE | 130 | 69 | 259 |
Figure S41. Get High-res Image Gene #14: '16p gain mutation analysis' versus Clinical Feature #2: 'METHLYATION_CNMF'

P value = 0.000239 (Fisher's exact test), Q value = 0.059
Table S42. Gene #14: '16p gain mutation analysis' versus Clinical Feature #5: 'MRNASEQ_CNMF'
| nPatients | CLUS_1 | CLUS_2 | CLUS_3 | CLUS_4 |
|---|---|---|---|---|
| ALL | 130 | 50 | 89 | 138 |
| 16P GAIN MUTATED | 11 | 0 | 0 | 1 |
| 16P GAIN WILD-TYPE | 119 | 50 | 89 | 137 |
Figure S42. Get High-res Image Gene #14: '16p gain mutation analysis' versus Clinical Feature #5: 'MRNASEQ_CNMF'
P value = 0.000167 (Fisher's exact test), Q value = 0.042
Table S43. Gene #14: '16p gain mutation analysis' versus Clinical Feature #6: 'MRNASEQ_CHIERARCHICAL'
| nPatients | CLUS_1 | CLUS_2 | CLUS_3 |
|---|---|---|---|
| ALL | 142 | 191 | 74 |
| 16P GAIN MUTATED | 11 | 1 | 0 |
| 16P GAIN WILD-TYPE | 131 | 190 | 74 |
Figure S43. Get High-res Image Gene #14: '16p gain mutation analysis' versus Clinical Feature #6: 'MRNASEQ_CHIERARCHICAL'
P value = 9.46e-05 (Fisher's exact test), Q value = 0.024
Table S44. Gene #14: '16p gain mutation analysis' versus Clinical Feature #7: 'MIRSEQ_CNMF'
| nPatients | CLUS_1 | CLUS_2 | CLUS_3 |
|---|---|---|---|
| ALL | 126 | 153 | 144 |
| 16P GAIN MUTATED | 10 | 0 | 2 |
| 16P GAIN WILD-TYPE | 116 | 153 | 142 |
Figure S44. Get High-res Image Gene #14: '16p gain mutation analysis' versus Clinical Feature #7: 'MIRSEQ_CNMF'

P value = 7.74e-05 (Fisher's exact test), Q value = 0.02
Table S45. Gene #14: '16p gain mutation analysis' versus Clinical Feature #8: 'MIRSEQ_CHIERARCHICAL'
| nPatients | CLUS_1 | CLUS_2 | CLUS_3 |
|---|---|---|---|
| ALL | 173 | 133 | 117 |
| 16P GAIN MUTATED | 2 | 0 | 10 |
| 16P GAIN WILD-TYPE | 171 | 133 | 107 |
Figure S45. Get High-res Image Gene #14: '16p gain mutation analysis' versus Clinical Feature #8: 'MIRSEQ_CHIERARCHICAL'

P value = 9.96e-13 (Fisher's exact test), Q value = 3.1e-10
Table S46. Gene #15: '16q gain mutation analysis' versus Clinical Feature #1: 'CN_CNMF'
| nPatients | CLUS_1 | CLUS_2 | CLUS_3 |
|---|---|---|---|
| ALL | 34 | 363 | 73 |
| 16Q GAIN MUTATED | 10 | 0 | 0 |
| 16Q GAIN WILD-TYPE | 24 | 363 | 73 |
Figure S46. Get High-res Image Gene #15: '16q gain mutation analysis' versus Clinical Feature #1: 'CN_CNMF'

P value = 0.000255 (Fisher's exact test), Q value = 0.061
Table S47. Gene #15: '16q gain mutation analysis' versus Clinical Feature #2: 'METHLYATION_CNMF'
| nPatients | CLUS_1 | CLUS_2 | CLUS_3 |
|---|---|---|---|
| ALL | 140 | 71 | 259 |
| 16Q GAIN MUTATED | 8 | 2 | 0 |
| 16Q GAIN WILD-TYPE | 132 | 69 | 259 |
Figure S47. Get High-res Image Gene #15: '16q gain mutation analysis' versus Clinical Feature #2: 'METHLYATION_CNMF'

P value = 0.00107 (Fisher's exact test), Q value = 0.23
Table S48. Gene #15: '16q gain mutation analysis' versus Clinical Feature #7: 'MIRSEQ_CNMF'
| nPatients | CLUS_1 | CLUS_2 | CLUS_3 |
|---|---|---|---|
| ALL | 126 | 153 | 144 |
| 16Q GAIN MUTATED | 8 | 0 | 2 |
| 16Q GAIN WILD-TYPE | 118 | 153 | 142 |
Figure S48. Get High-res Image Gene #15: '16q gain mutation analysis' versus Clinical Feature #7: 'MIRSEQ_CNMF'

P value = 0.000706 (Fisher's exact test), Q value = 0.16
Table S49. Gene #15: '16q gain mutation analysis' versus Clinical Feature #8: 'MIRSEQ_CHIERARCHICAL'
| nPatients | CLUS_1 | CLUS_2 | CLUS_3 |
|---|---|---|---|
| ALL | 173 | 133 | 117 |
| 16Q GAIN MUTATED | 2 | 0 | 8 |
| 16Q GAIN WILD-TYPE | 171 | 133 | 109 |
Figure S49. Get High-res Image Gene #15: '16q gain mutation analysis' versus Clinical Feature #8: 'MIRSEQ_CHIERARCHICAL'

P value = 3.73e-09 (Fisher's exact test), Q value = 1.1e-06
Table S50. Gene #16: '17p gain mutation analysis' versus Clinical Feature #1: 'CN_CNMF'
| nPatients | CLUS_1 | CLUS_2 | CLUS_3 |
|---|---|---|---|
| ALL | 34 | 363 | 73 |
| 17P GAIN MUTATED | 9 | 2 | 1 |
| 17P GAIN WILD-TYPE | 25 | 361 | 72 |
Figure S50. Get High-res Image Gene #16: '17p gain mutation analysis' versus Clinical Feature #1: 'CN_CNMF'
P value = 6.84e-07 (Fisher's exact test), Q value = 2e-04
Table S51. Gene #16: '17p gain mutation analysis' versus Clinical Feature #2: 'METHLYATION_CNMF'
| nPatients | CLUS_1 | CLUS_2 | CLUS_3 |
|---|---|---|---|
| ALL | 140 | 71 | 259 |
| 17P GAIN MUTATED | 12 | 0 | 0 |
| 17P GAIN WILD-TYPE | 128 | 71 | 259 |
Figure S51. Get High-res Image Gene #16: '17p gain mutation analysis' versus Clinical Feature #2: 'METHLYATION_CNMF'

P value = 1.83e-05 (Fisher's exact test), Q value = 0.0051
Table S52. Gene #16: '17p gain mutation analysis' versus Clinical Feature #5: 'MRNASEQ_CNMF'
| nPatients | CLUS_1 | CLUS_2 | CLUS_3 | CLUS_4 |
|---|---|---|---|---|
| ALL | 130 | 50 | 89 | 138 |
| 17P GAIN MUTATED | 11 | 0 | 0 | 0 |
| 17P GAIN WILD-TYPE | 119 | 50 | 89 | 138 |
Figure S52. Get High-res Image Gene #16: '17p gain mutation analysis' versus Clinical Feature #5: 'MRNASEQ_CNMF'

P value = 1.93e-05 (Fisher's exact test), Q value = 0.0053
Table S53. Gene #16: '17p gain mutation analysis' versus Clinical Feature #6: 'MRNASEQ_CHIERARCHICAL'
| nPatients | CLUS_1 | CLUS_2 | CLUS_3 |
|---|---|---|---|
| ALL | 142 | 191 | 74 |
| 17P GAIN MUTATED | 11 | 0 | 0 |
| 17P GAIN WILD-TYPE | 131 | 191 | 74 |
Figure S53. Get High-res Image Gene #16: '17p gain mutation analysis' versus Clinical Feature #6: 'MRNASEQ_CHIERARCHICAL'

P value = 3.39e-05 (Fisher's exact test), Q value = 0.0089
Table S54. Gene #16: '17p gain mutation analysis' versus Clinical Feature #7: 'MIRSEQ_CNMF'
| nPatients | CLUS_1 | CLUS_2 | CLUS_3 |
|---|---|---|---|
| ALL | 126 | 153 | 144 |
| 17P GAIN MUTATED | 10 | 0 | 1 |
| 17P GAIN WILD-TYPE | 116 | 153 | 143 |
Figure S54. Get High-res Image Gene #16: '17p gain mutation analysis' versus Clinical Feature #7: 'MIRSEQ_CNMF'

P value = 1.87e-05 (Fisher's exact test), Q value = 0.0052
Table S55. Gene #16: '17p gain mutation analysis' versus Clinical Feature #8: 'MIRSEQ_CHIERARCHICAL'
| nPatients | CLUS_1 | CLUS_2 | CLUS_3 |
|---|---|---|---|
| ALL | 173 | 133 | 117 |
| 17P GAIN MUTATED | 1 | 0 | 10 |
| 17P GAIN WILD-TYPE | 172 | 133 | 107 |
Figure S55. Get High-res Image Gene #16: '17p gain mutation analysis' versus Clinical Feature #8: 'MIRSEQ_CHIERARCHICAL'

P value = 5.93e-09 (Fisher's exact test), Q value = 1.8e-06
Table S56. Gene #17: '17q gain mutation analysis' versus Clinical Feature #1: 'CN_CNMF'
| nPatients | CLUS_1 | CLUS_2 | CLUS_3 |
|---|---|---|---|
| ALL | 34 | 363 | 73 |
| 17Q GAIN MUTATED | 9 | 2 | 2 |
| 17Q GAIN WILD-TYPE | 25 | 361 | 71 |
Figure S56. Get High-res Image Gene #17: '17q gain mutation analysis' versus Clinical Feature #1: 'CN_CNMF'

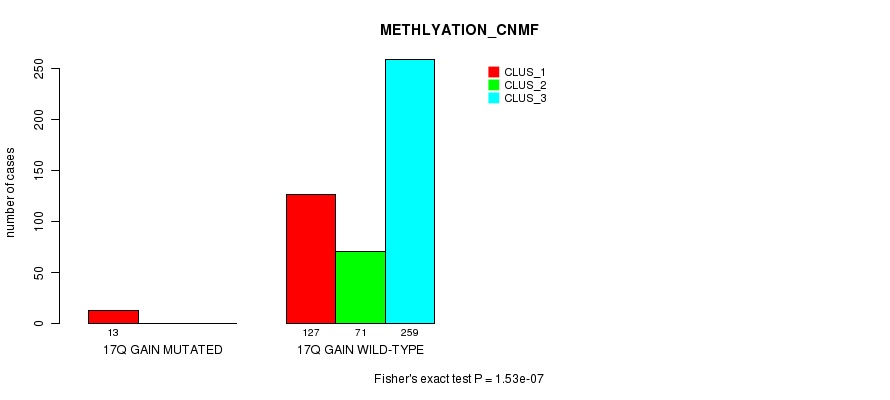
P value = 1.53e-07 (Fisher's exact test), Q value = 4.5e-05
Table S57. Gene #17: '17q gain mutation analysis' versus Clinical Feature #2: 'METHLYATION_CNMF'
| nPatients | CLUS_1 | CLUS_2 | CLUS_3 |
|---|---|---|---|
| ALL | 140 | 71 | 259 |
| 17Q GAIN MUTATED | 13 | 0 | 0 |
| 17Q GAIN WILD-TYPE | 127 | 71 | 259 |
Figure S57. Get High-res Image Gene #17: '17q gain mutation analysis' versus Clinical Feature #2: 'METHLYATION_CNMF'
P value = 7.78e-06 (Fisher's exact test), Q value = 0.0022
Table S58. Gene #17: '17q gain mutation analysis' versus Clinical Feature #5: 'MRNASEQ_CNMF'
| nPatients | CLUS_1 | CLUS_2 | CLUS_3 | CLUS_4 |
|---|---|---|---|---|
| ALL | 130 | 50 | 89 | 138 |
| 17Q GAIN MUTATED | 12 | 0 | 0 | 0 |
| 17Q GAIN WILD-TYPE | 118 | 50 | 89 | 138 |
Figure S58. Get High-res Image Gene #17: '17q gain mutation analysis' versus Clinical Feature #5: 'MRNASEQ_CNMF'

P value = 4.91e-06 (Fisher's exact test), Q value = 0.0014
Table S59. Gene #17: '17q gain mutation analysis' versus Clinical Feature #6: 'MRNASEQ_CHIERARCHICAL'
| nPatients | CLUS_1 | CLUS_2 | CLUS_3 |
|---|---|---|---|
| ALL | 142 | 191 | 74 |
| 17Q GAIN MUTATED | 12 | 0 | 0 |
| 17Q GAIN WILD-TYPE | 130 | 191 | 74 |
Figure S59. Get High-res Image Gene #17: '17q gain mutation analysis' versus Clinical Feature #6: 'MRNASEQ_CHIERARCHICAL'

P value = 1.09e-05 (Fisher's exact test), Q value = 0.003
Table S60. Gene #17: '17q gain mutation analysis' versus Clinical Feature #7: 'MIRSEQ_CNMF'
| nPatients | CLUS_1 | CLUS_2 | CLUS_3 |
|---|---|---|---|
| ALL | 126 | 153 | 144 |
| 17Q GAIN MUTATED | 11 | 0 | 1 |
| 17Q GAIN WILD-TYPE | 115 | 153 | 143 |
Figure S60. Get High-res Image Gene #17: '17q gain mutation analysis' versus Clinical Feature #7: 'MIRSEQ_CNMF'

P value = 5.32e-06 (Fisher's exact test), Q value = 0.0015
Table S61. Gene #17: '17q gain mutation analysis' versus Clinical Feature #8: 'MIRSEQ_CHIERARCHICAL'
| nPatients | CLUS_1 | CLUS_2 | CLUS_3 |
|---|---|---|---|
| ALL | 173 | 133 | 117 |
| 17Q GAIN MUTATED | 1 | 0 | 11 |
| 17Q GAIN WILD-TYPE | 172 | 133 | 106 |
Figure S61. Get High-res Image Gene #17: '17q gain mutation analysis' versus Clinical Feature #8: 'MIRSEQ_CHIERARCHICAL'

P value = 2.31e-05 (Fisher's exact test), Q value = 0.0062
Table S62. Gene #20: '19p gain mutation analysis' versus Clinical Feature #1: 'CN_CNMF'
| nPatients | CLUS_1 | CLUS_2 | CLUS_3 |
|---|---|---|---|
| ALL | 34 | 363 | 73 |
| 19P GAIN MUTATED | 4 | 0 | 0 |
| 19P GAIN WILD-TYPE | 30 | 363 | 73 |
Figure S62. Get High-res Image Gene #20: '19p gain mutation analysis' versus Clinical Feature #1: 'CN_CNMF'

P value = 1.49e-06 (Fisher's exact test), Q value = 0.00043
Table S63. Gene #21: '19q gain mutation analysis' versus Clinical Feature #1: 'CN_CNMF'
| nPatients | CLUS_1 | CLUS_2 | CLUS_3 |
|---|---|---|---|
| ALL | 34 | 363 | 73 |
| 19Q GAIN MUTATED | 5 | 0 | 0 |
| 19Q GAIN WILD-TYPE | 29 | 363 | 73 |
Figure S63. Get High-res Image Gene #21: '19q gain mutation analysis' versus Clinical Feature #1: 'CN_CNMF'

P value = 1.84e-11 (Fisher's exact test), Q value = 5.6e-09
Table S64. Gene #22: '20p gain mutation analysis' versus Clinical Feature #1: 'CN_CNMF'
| nPatients | CLUS_1 | CLUS_2 | CLUS_3 |
|---|---|---|---|
| ALL | 34 | 363 | 73 |
| 20P GAIN MUTATED | 9 | 0 | 0 |
| 20P GAIN WILD-TYPE | 25 | 363 | 73 |
Figure S64. Get High-res Image Gene #22: '20p gain mutation analysis' versus Clinical Feature #1: 'CN_CNMF'

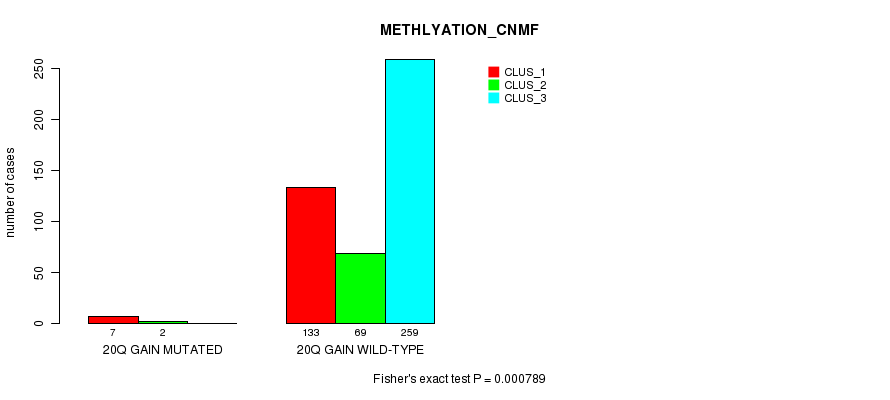
P value = 0.000789 (Fisher's exact test), Q value = 0.18
Table S65. Gene #22: '20p gain mutation analysis' versus Clinical Feature #2: 'METHLYATION_CNMF'
| nPatients | CLUS_1 | CLUS_2 | CLUS_3 |
|---|---|---|---|
| ALL | 140 | 71 | 259 |
| 20P GAIN MUTATED | 7 | 2 | 0 |
| 20P GAIN WILD-TYPE | 133 | 69 | 259 |
Figure S65. Get High-res Image Gene #22: '20p gain mutation analysis' versus Clinical Feature #2: 'METHLYATION_CNMF'

P value = 1.84e-11 (Fisher's exact test), Q value = 5.6e-09
Table S66. Gene #23: '20q gain mutation analysis' versus Clinical Feature #1: 'CN_CNMF'
| nPatients | CLUS_1 | CLUS_2 | CLUS_3 |
|---|---|---|---|
| ALL | 34 | 363 | 73 |
| 20Q GAIN MUTATED | 9 | 0 | 0 |
| 20Q GAIN WILD-TYPE | 25 | 363 | 73 |
Figure S66. Get High-res Image Gene #23: '20q gain mutation analysis' versus Clinical Feature #1: 'CN_CNMF'

P value = 0.000789 (Fisher's exact test), Q value = 0.18
Table S67. Gene #23: '20q gain mutation analysis' versus Clinical Feature #2: 'METHLYATION_CNMF'
| nPatients | CLUS_1 | CLUS_2 | CLUS_3 |
|---|---|---|---|
| ALL | 140 | 71 | 259 |
| 20Q GAIN MUTATED | 7 | 2 | 0 |
| 20Q GAIN WILD-TYPE | 133 | 69 | 259 |
Figure S67. Get High-res Image Gene #23: '20q gain mutation analysis' versus Clinical Feature #2: 'METHLYATION_CNMF'
P value = 0.000348 (Fisher's exact test), Q value = 0.083
Table S68. Gene #25: '1p loss mutation analysis' versus Clinical Feature #1: 'CN_CNMF'
| nPatients | CLUS_1 | CLUS_2 | CLUS_3 |
|---|---|---|---|
| ALL | 34 | 363 | 73 |
| 1P LOSS MUTATED | 3 | 0 | 0 |
| 1P LOSS WILD-TYPE | 31 | 363 | 73 |
Figure S68. Get High-res Image Gene #25: '1p loss mutation analysis' versus Clinical Feature #1: 'CN_CNMF'

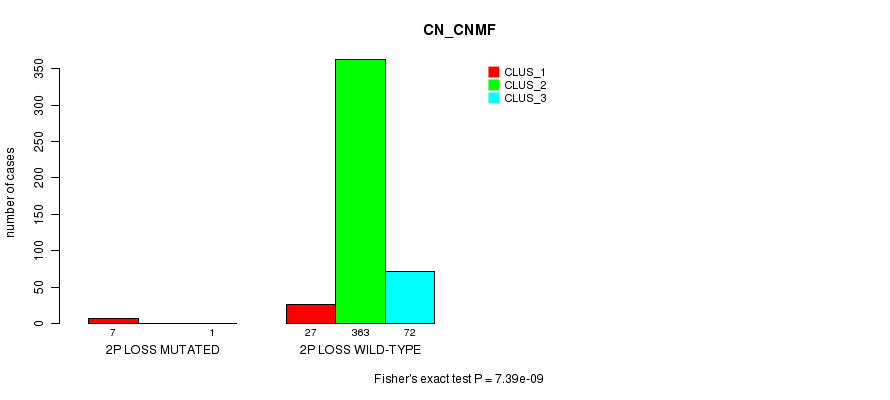
P value = 7.39e-09 (Fisher's exact test), Q value = 2.2e-06
Table S69. Gene #26: '2p loss mutation analysis' versus Clinical Feature #1: 'CN_CNMF'
| nPatients | CLUS_1 | CLUS_2 | CLUS_3 |
|---|---|---|---|
| ALL | 34 | 363 | 73 |
| 2P LOSS MUTATED | 7 | 0 | 1 |
| 2P LOSS WILD-TYPE | 27 | 363 | 72 |
Figure S69. Get High-res Image Gene #26: '2p loss mutation analysis' versus Clinical Feature #1: 'CN_CNMF'
P value = 8.85e-05 (Fisher's exact test), Q value = 0.023
Table S70. Gene #26: '2p loss mutation analysis' versus Clinical Feature #2: 'METHLYATION_CNMF'
| nPatients | CLUS_1 | CLUS_2 | CLUS_3 |
|---|---|---|---|
| ALL | 140 | 71 | 259 |
| 2P LOSS MUTATED | 8 | 0 | 0 |
| 2P LOSS WILD-TYPE | 132 | 71 | 259 |
Figure S70. Get High-res Image Gene #26: '2p loss mutation analysis' versus Clinical Feature #2: 'METHLYATION_CNMF'

P value = 0.000731 (Fisher's exact test), Q value = 0.16
Table S71. Gene #26: '2p loss mutation analysis' versus Clinical Feature #5: 'MRNASEQ_CNMF'
| nPatients | CLUS_1 | CLUS_2 | CLUS_3 | CLUS_4 |
|---|---|---|---|---|
| ALL | 130 | 50 | 89 | 138 |
| 2P LOSS MUTATED | 8 | 0 | 0 | 0 |
| 2P LOSS WILD-TYPE | 122 | 50 | 89 | 138 |
Figure S71. Get High-res Image Gene #26: '2p loss mutation analysis' versus Clinical Feature #5: 'MRNASEQ_CNMF'

P value = 0.000334 (Fisher's exact test), Q value = 0.08
Table S72. Gene #26: '2p loss mutation analysis' versus Clinical Feature #6: 'MRNASEQ_CHIERARCHICAL'
| nPatients | CLUS_1 | CLUS_2 | CLUS_3 |
|---|---|---|---|
| ALL | 142 | 191 | 74 |
| 2P LOSS MUTATED | 8 | 0 | 0 |
| 2P LOSS WILD-TYPE | 134 | 191 | 74 |
Figure S72. Get High-res Image Gene #26: '2p loss mutation analysis' versus Clinical Feature #6: 'MRNASEQ_CHIERARCHICAL'

P value = 5.28e-05 (Fisher's exact test), Q value = 0.014
Table S73. Gene #26: '2p loss mutation analysis' versus Clinical Feature #7: 'MIRSEQ_CNMF'
| nPatients | CLUS_1 | CLUS_2 | CLUS_3 |
|---|---|---|---|
| ALL | 126 | 153 | 144 |
| 2P LOSS MUTATED | 8 | 0 | 0 |
| 2P LOSS WILD-TYPE | 118 | 153 | 144 |
Figure S73. Get High-res Image Gene #26: '2p loss mutation analysis' versus Clinical Feature #7: 'MIRSEQ_CNMF'

P value = 2.87e-05 (Fisher's exact test), Q value = 0.0076
Table S74. Gene #26: '2p loss mutation analysis' versus Clinical Feature #8: 'MIRSEQ_CHIERARCHICAL'
| nPatients | CLUS_1 | CLUS_2 | CLUS_3 |
|---|---|---|---|
| ALL | 173 | 133 | 117 |
| 2P LOSS MUTATED | 0 | 0 | 8 |
| 2P LOSS WILD-TYPE | 173 | 133 | 109 |
Figure S74. Get High-res Image Gene #26: '2p loss mutation analysis' versus Clinical Feature #8: 'MIRSEQ_CHIERARCHICAL'

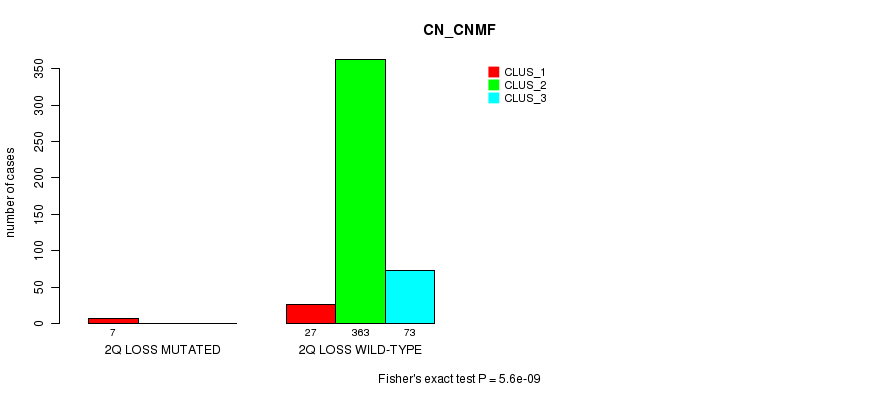
P value = 5.6e-09 (Fisher's exact test), Q value = 1.7e-06
Table S75. Gene #27: '2q loss mutation analysis' versus Clinical Feature #1: 'CN_CNMF'
| nPatients | CLUS_1 | CLUS_2 | CLUS_3 |
|---|---|---|---|
| ALL | 34 | 363 | 73 |
| 2Q LOSS MUTATED | 7 | 0 | 0 |
| 2Q LOSS WILD-TYPE | 27 | 363 | 73 |
Figure S75. Get High-res Image Gene #27: '2q loss mutation analysis' versus Clinical Feature #1: 'CN_CNMF'
P value = 0.00038 (Fisher's exact test), Q value = 0.089
Table S76. Gene #27: '2q loss mutation analysis' versus Clinical Feature #2: 'METHLYATION_CNMF'
| nPatients | CLUS_1 | CLUS_2 | CLUS_3 |
|---|---|---|---|
| ALL | 140 | 71 | 259 |
| 2Q LOSS MUTATED | 7 | 0 | 0 |
| 2Q LOSS WILD-TYPE | 133 | 71 | 259 |
Figure S76. Get High-res Image Gene #27: '2q loss mutation analysis' versus Clinical Feature #2: 'METHLYATION_CNMF'

P value = 0.000185 (Fisher's exact test), Q value = 0.046
Table S77. Gene #27: '2q loss mutation analysis' versus Clinical Feature #7: 'MIRSEQ_CNMF'
| nPatients | CLUS_1 | CLUS_2 | CLUS_3 |
|---|---|---|---|
| ALL | 126 | 153 | 144 |
| 2Q LOSS MUTATED | 7 | 0 | 0 |
| 2Q LOSS WILD-TYPE | 119 | 153 | 144 |
Figure S77. Get High-res Image Gene #27: '2q loss mutation analysis' versus Clinical Feature #7: 'MIRSEQ_CNMF'

P value = 0.000108 (Fisher's exact test), Q value = 0.027
Table S78. Gene #27: '2q loss mutation analysis' versus Clinical Feature #8: 'MIRSEQ_CHIERARCHICAL'
| nPatients | CLUS_1 | CLUS_2 | CLUS_3 |
|---|---|---|---|
| ALL | 173 | 133 | 117 |
| 2Q LOSS MUTATED | 0 | 0 | 7 |
| 2Q LOSS WILD-TYPE | 173 | 133 | 110 |
Figure S78. Get High-res Image Gene #27: '2q loss mutation analysis' versus Clinical Feature #8: 'MIRSEQ_CHIERARCHICAL'

P value = 0.000348 (Fisher's exact test), Q value = 0.083
Table S79. Gene #28: '3q loss mutation analysis' versus Clinical Feature #1: 'CN_CNMF'
| nPatients | CLUS_1 | CLUS_2 | CLUS_3 |
|---|---|---|---|
| ALL | 34 | 363 | 73 |
| 3Q LOSS MUTATED | 3 | 0 | 0 |
| 3Q LOSS WILD-TYPE | 31 | 363 | 73 |
Figure S79. Get High-res Image Gene #28: '3q loss mutation analysis' versus Clinical Feature #1: 'CN_CNMF'

P value = 2.31e-05 (Fisher's exact test), Q value = 0.0062
Table S80. Gene #30: '8p loss mutation analysis' versus Clinical Feature #1: 'CN_CNMF'
| nPatients | CLUS_1 | CLUS_2 | CLUS_3 |
|---|---|---|---|
| ALL | 34 | 363 | 73 |
| 8P LOSS MUTATED | 4 | 0 | 0 |
| 8P LOSS WILD-TYPE | 30 | 363 | 73 |
Figure S80. Get High-res Image Gene #30: '8p loss mutation analysis' versus Clinical Feature #1: 'CN_CNMF'

P value = 2.31e-05 (Fisher's exact test), Q value = 0.0062
Table S81. Gene #31: '8q loss mutation analysis' versus Clinical Feature #1: 'CN_CNMF'
| nPatients | CLUS_1 | CLUS_2 | CLUS_3 |
|---|---|---|---|
| ALL | 34 | 363 | 73 |
| 8Q LOSS MUTATED | 4 | 0 | 0 |
| 8Q LOSS WILD-TYPE | 30 | 363 | 73 |
Figure S81. Get High-res Image Gene #31: '8q loss mutation analysis' versus Clinical Feature #1: 'CN_CNMF'
P value = 1.04e-11 (Fisher's exact test), Q value = 3.2e-09
Table S82. Gene #32: '9p loss mutation analysis' versus Clinical Feature #1: 'CN_CNMF'
| nPatients | CLUS_1 | CLUS_2 | CLUS_3 |
|---|---|---|---|
| ALL | 34 | 363 | 73 |
| 9P LOSS MUTATED | 10 | 1 | 0 |
| 9P LOSS WILD-TYPE | 24 | 362 | 73 |
Figure S82. Get High-res Image Gene #32: '9p loss mutation analysis' versus Clinical Feature #1: 'CN_CNMF'

P value = 1.1e-13 (Fisher's exact test), Q value = 3.4e-11
Table S83. Gene #33: '9q loss mutation analysis' versus Clinical Feature #1: 'CN_CNMF'
| nPatients | CLUS_1 | CLUS_2 | CLUS_3 |
|---|---|---|---|
| ALL | 34 | 363 | 73 |
| 9Q LOSS MUTATED | 13 | 3 | 0 |
| 9Q LOSS WILD-TYPE | 21 | 360 | 73 |
Figure S83. Get High-res Image Gene #33: '9q loss mutation analysis' versus Clinical Feature #1: 'CN_CNMF'

P value = 9.28e-08 (Fisher's exact test), Q value = 2.8e-05
Table S84. Gene #34: '10p loss mutation analysis' versus Clinical Feature #1: 'CN_CNMF'
| nPatients | CLUS_1 | CLUS_2 | CLUS_3 |
|---|---|---|---|
| ALL | 34 | 363 | 73 |
| 10P LOSS MUTATED | 6 | 0 | 0 |
| 10P LOSS WILD-TYPE | 28 | 363 | 73 |
Figure S84. Get High-res Image Gene #34: '10p loss mutation analysis' versus Clinical Feature #1: 'CN_CNMF'

P value = 1.49e-06 (Fisher's exact test), Q value = 0.00043
Table S85. Gene #35: '10q loss mutation analysis' versus Clinical Feature #1: 'CN_CNMF'
| nPatients | CLUS_1 | CLUS_2 | CLUS_3 |
|---|---|---|---|
| ALL | 34 | 363 | 73 |
| 10Q LOSS MUTATED | 5 | 0 | 0 |
| 10Q LOSS WILD-TYPE | 29 | 363 | 73 |
Figure S85. Get High-res Image Gene #35: '10q loss mutation analysis' versus Clinical Feature #1: 'CN_CNMF'

P value = 9.28e-08 (Fisher's exact test), Q value = 2.8e-05
Table S86. Gene #36: '11p loss mutation analysis' versus Clinical Feature #1: 'CN_CNMF'
| nPatients | CLUS_1 | CLUS_2 | CLUS_3 |
|---|---|---|---|
| ALL | 34 | 363 | 73 |
| 11P LOSS MUTATED | 6 | 0 | 0 |
| 11P LOSS WILD-TYPE | 28 | 363 | 73 |
Figure S86. Get High-res Image Gene #36: '11p loss mutation analysis' versus Clinical Feature #1: 'CN_CNMF'

P value = 4.79e-06 (Fisher's exact test), Q value = 0.0014
Table S87. Gene #37: '11q loss mutation analysis' versus Clinical Feature #1: 'CN_CNMF'
| nPatients | CLUS_1 | CLUS_2 | CLUS_3 |
|---|---|---|---|
| ALL | 34 | 363 | 73 |
| 11Q LOSS MUTATED | 6 | 2 | 0 |
| 11Q LOSS WILD-TYPE | 28 | 361 | 73 |
Figure S87. Get High-res Image Gene #37: '11q loss mutation analysis' versus Clinical Feature #1: 'CN_CNMF'
P value = 0.000427 (Fisher's exact test), Q value = 0.099
Table S88. Gene #39: '15q loss mutation analysis' versus Clinical Feature #1: 'CN_CNMF'
| nPatients | CLUS_1 | CLUS_2 | CLUS_3 |
|---|---|---|---|
| ALL | 34 | 363 | 73 |
| 15Q LOSS MUTATED | 4 | 2 | 0 |
| 15Q LOSS WILD-TYPE | 30 | 361 | 73 |
Figure S88. Get High-res Image Gene #39: '15q loss mutation analysis' versus Clinical Feature #1: 'CN_CNMF'

P value = 0.000641 (Fisher's exact test), Q value = 0.15
Table S89. Gene #39: '15q loss mutation analysis' versus Clinical Feature #7: 'MIRSEQ_CNMF'
| nPatients | CLUS_1 | CLUS_2 | CLUS_3 |
|---|---|---|---|
| ALL | 126 | 153 | 144 |
| 15Q LOSS MUTATED | 6 | 0 | 0 |
| 15Q LOSS WILD-TYPE | 120 | 153 | 144 |
Figure S89. Get High-res Image Gene #39: '15q loss mutation analysis' versus Clinical Feature #7: 'MIRSEQ_CNMF'
P value = 0.000407 (Fisher's exact test), Q value = 0.095
Table S90. Gene #39: '15q loss mutation analysis' versus Clinical Feature #8: 'MIRSEQ_CHIERARCHICAL'
| nPatients | CLUS_1 | CLUS_2 | CLUS_3 |
|---|---|---|---|
| ALL | 173 | 133 | 117 |
| 15Q LOSS MUTATED | 0 | 0 | 6 |
| 15Q LOSS WILD-TYPE | 173 | 133 | 111 |
Figure S90. Get High-res Image Gene #39: '15q loss mutation analysis' versus Clinical Feature #8: 'MIRSEQ_CHIERARCHICAL'

P value = 0.000241 (Fisher's exact test), Q value = 0.059
Table S91. Gene #41: '18p loss mutation analysis' versus Clinical Feature #1: 'CN_CNMF'
| nPatients | CLUS_1 | CLUS_2 | CLUS_3 |
|---|---|---|---|
| ALL | 34 | 363 | 73 |
| 18P LOSS MUTATED | 3 | 0 | 1 |
| 18P LOSS WILD-TYPE | 31 | 363 | 72 |
Figure S91. Get High-res Image Gene #41: '18p loss mutation analysis' versus Clinical Feature #1: 'CN_CNMF'

P value = 0.000241 (Fisher's exact test), Q value = 0.059
Table S92. Gene #42: '18q loss mutation analysis' versus Clinical Feature #1: 'CN_CNMF'
| nPatients | CLUS_1 | CLUS_2 | CLUS_3 |
|---|---|---|---|
| ALL | 34 | 363 | 73 |
| 18Q LOSS MUTATED | 3 | 0 | 1 |
| 18Q LOSS WILD-TYPE | 31 | 363 | 72 |
Figure S92. Get High-res Image Gene #42: '18q loss mutation analysis' versus Clinical Feature #1: 'CN_CNMF'

P value = 1.96e-05 (Fisher's exact test), Q value = 0.0053
Table S93. Gene #44: '21q loss mutation analysis' versus Clinical Feature #1: 'CN_CNMF'
| nPatients | CLUS_1 | CLUS_2 | CLUS_3 |
|---|---|---|---|
| ALL | 34 | 363 | 73 |
| 21Q LOSS MUTATED | 4 | 0 | 1 |
| 21Q LOSS WILD-TYPE | 30 | 363 | 72 |
Figure S93. Get High-res Image Gene #44: '21q loss mutation analysis' versus Clinical Feature #1: 'CN_CNMF'

P value = 7.02e-54 (Fisher's exact test), Q value = 2.2e-51
Table S94. Gene #45: '22q loss mutation analysis' versus Clinical Feature #1: 'CN_CNMF'
| nPatients | CLUS_1 | CLUS_2 | CLUS_3 |
|---|---|---|---|
| ALL | 34 | 363 | 73 |
| 22Q LOSS MUTATED | 8 | 0 | 54 |
| 22Q LOSS WILD-TYPE | 26 | 363 | 19 |
Figure S94. Get High-res Image Gene #45: '22q loss mutation analysis' versus Clinical Feature #1: 'CN_CNMF'
P value = 0.000526 (Fisher's exact test), Q value = 0.12
Table S95. Gene #45: '22q loss mutation analysis' versus Clinical Feature #2: 'METHLYATION_CNMF'
| nPatients | CLUS_1 | CLUS_2 | CLUS_3 |
|---|---|---|---|
| ALL | 140 | 71 | 259 |
| 22Q LOSS MUTATED | 32 | 6 | 24 |
| 22Q LOSS WILD-TYPE | 108 | 65 | 235 |
Figure S95. Get High-res Image Gene #45: '22q loss mutation analysis' versus Clinical Feature #2: 'METHLYATION_CNMF'
P value = 1.79e-09 (Fisher's exact test), Q value = 5.4e-07
Table S96. Gene #45: '22q loss mutation analysis' versus Clinical Feature #5: 'MRNASEQ_CNMF'
| nPatients | CLUS_1 | CLUS_2 | CLUS_3 | CLUS_4 |
|---|---|---|---|---|
| ALL | 130 | 50 | 89 | 138 |
| 22Q LOSS MUTATED | 30 | 3 | 16 | 1 |
| 22Q LOSS WILD-TYPE | 100 | 47 | 73 | 137 |
Figure S96. Get High-res Image Gene #45: '22q loss mutation analysis' versus Clinical Feature #5: 'MRNASEQ_CNMF'
P value = 1.22e-07 (Fisher's exact test), Q value = 3.6e-05
Table S97. Gene #45: '22q loss mutation analysis' versus Clinical Feature #6: 'MRNASEQ_CHIERARCHICAL'
| nPatients | CLUS_1 | CLUS_2 | CLUS_3 |
|---|---|---|---|
| ALL | 142 | 191 | 74 |
| 22Q LOSS MUTATED | 30 | 6 | 14 |
| 22Q LOSS WILD-TYPE | 112 | 185 | 60 |
Figure S97. Get High-res Image Gene #45: '22q loss mutation analysis' versus Clinical Feature #6: 'MRNASEQ_CHIERARCHICAL'
P value = 4.79e-05 (Fisher's exact test), Q value = 0.012
Table S98. Gene #45: '22q loss mutation analysis' versus Clinical Feature #7: 'MIRSEQ_CNMF'
| nPatients | CLUS_1 | CLUS_2 | CLUS_3 |
|---|---|---|---|
| ALL | 126 | 153 | 144 |
| 22Q LOSS MUTATED | 31 | 14 | 10 |
| 22Q LOSS WILD-TYPE | 95 | 139 | 134 |
Figure S98. Get High-res Image Gene #45: '22q loss mutation analysis' versus Clinical Feature #7: 'MIRSEQ_CNMF'
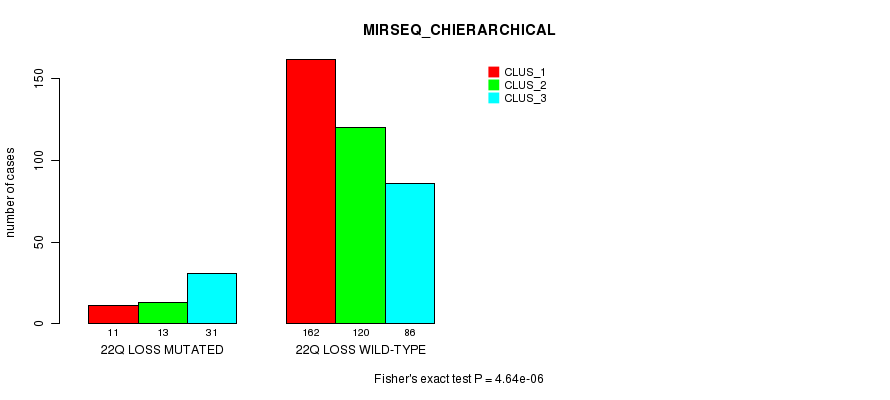
P value = 4.64e-06 (Fisher's exact test), Q value = 0.0013
Table S99. Gene #45: '22q loss mutation analysis' versus Clinical Feature #8: 'MIRSEQ_CHIERARCHICAL'
| nPatients | CLUS_1 | CLUS_2 | CLUS_3 |
|---|---|---|---|
| ALL | 173 | 133 | 117 |
| 22Q LOSS MUTATED | 11 | 13 | 31 |
| 22Q LOSS WILD-TYPE | 162 | 120 | 86 |
Figure S99. Get High-res Image Gene #45: '22q loss mutation analysis' versus Clinical Feature #8: 'MIRSEQ_CHIERARCHICAL'
-
Mutation data file = broad_values_by_arm.mutsig.cluster.txt
-
Molecular subtypes file = THCA-TP.transferedmergedcluster.txt
-
Number of patients = 470
-
Number of significantly arm-level cnvs = 45
-
Number of molecular subtypes = 8
-
Exclude genes that fewer than K tumors have mutations, K = 3
For binary or multi-class clinical features (nominal or ordinal), two-tailed Fisher's exact tests (Fisher 1922) were used to estimate the P values using the 'fisher.test' function in R
For multiple hypothesis correction, Q value is the False Discovery Rate (FDR) analogue of the P value (Benjamini and Hochberg 1995), defined as the minimum FDR at which the test may be called significant. We used the 'Benjamini and Hochberg' method of 'p.adjust' function in R to convert P values into Q values.
This is an experimental feature. The full results of the analysis summarized in this report can be downloaded from the TCGA Data Coordination Center.