(primary solid tumor cohort)
This pipeline uses various statistical tests to identify mRNAs whose expression levels correlated to selected clinical features.
Testing the association between 18627 genes and 5 clinical features across 369 samples, statistically thresholded by Q value < 0.05, 5 clinical features related to at least one genes.
-
1 gene correlated to 'Time to Death'.
-
KCNK10|54207
-
319 genes correlated to 'AGE'.
-
DIO2|1734 , FAM107A|11170 , MGAT4A|11320 , AEN|64782 , HIF3A|64344 , ...
-
3163 genes correlated to 'HISTOLOGICAL.TYPE'.
-
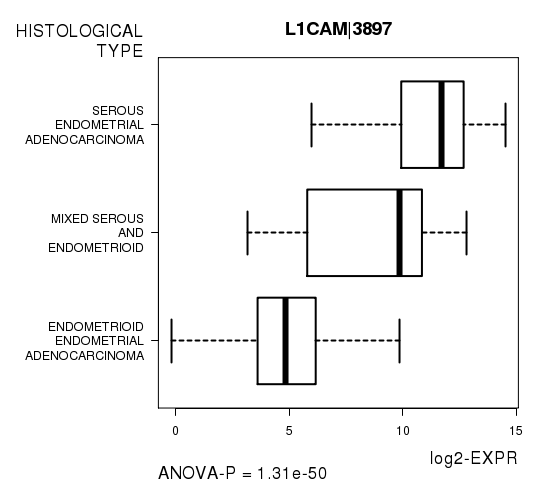
L1CAM|3897 , KIAA1324|57535 , CLDN6|9074 , SPDEF|25803 , GRB7|2886 , ...
-
2 genes correlated to 'RADIATIONS.RADIATION.REGIMENINDICATION'.
-
C8ORF79|57604 , CEP68|23177
-
2 genes correlated to 'COMPLETENESS.OF.RESECTION'.
-
DGCR6|8214 , FRMD1|79981
Complete statistical result table is provided in Supplement Table 1
Table 1. Get Full Table This table shows the clinical features, statistical methods used, and the number of genes that are significantly associated with each clinical feature at Q value < 0.05.
| Clinical feature | Statistical test | Significant genes | Associated with | Associated with | ||
|---|---|---|---|---|---|---|
| Time to Death | Cox regression test | N=1 | shorter survival | N=1 | longer survival | N=0 |
| AGE | Spearman correlation test | N=319 | older | N=195 | younger | N=124 |
| HISTOLOGICAL TYPE | ANOVA test | N=3163 | ||||
| RADIATIONS RADIATION REGIMENINDICATION | t test | N=2 | yes | N=2 | no | N=0 |
| COMPLETENESS OF RESECTION | ANOVA test | N=2 |
Table S1. Basic characteristics of clinical feature: 'Time to Death'
| Time to Death | Duration (Months) | 0-187.1 (median=17.9) |
| censored | N = 335 | |
| death | N = 32 | |
| Significant markers | N = 1 | |
| associated with shorter survival | 1 | |
| associated with longer survival | 0 |
Table S2. Get Full Table List of one gene significantly associated with 'Time to Death' by Cox regression test
| HazardRatio | Wald_P | Q | C_index | |
|---|---|---|---|---|
| KCNK10|54207 | 1.78 | 1.546e-06 | 0.029 | 0.728 |
Figure S1. Get High-res Image As an example, this figure shows the association of KCNK10|54207 to 'Time to Death'. four curves present the cumulative survival rates of 4 quartile subsets of patients. P value = 1.55e-06 with univariate Cox regression analysis using continuous log-2 expression values.
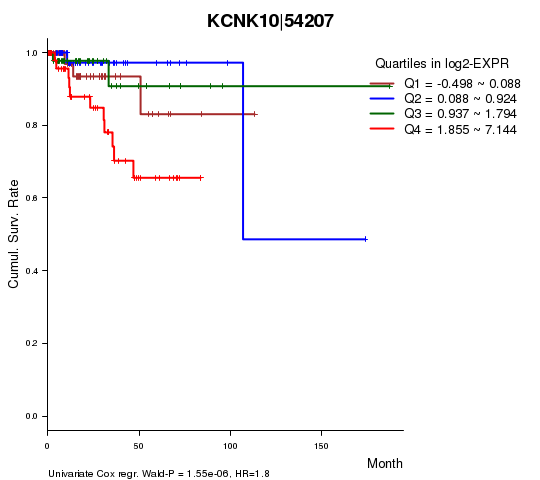
Table S3. Basic characteristics of clinical feature: 'AGE'
| AGE | Mean (SD) | 63.22 (11) |
| Significant markers | N = 319 | |
| pos. correlated | 195 | |
| neg. correlated | 124 |
Table S4. Get Full Table List of top 10 genes significantly correlated to 'AGE' by Spearman correlation test
| SpearmanCorr | corrP | Q | |
|---|---|---|---|
| DIO2|1734 | -0.4127 | 1.316e-16 | 2.45e-12 |
| FAM107A|11170 | 0.3632 | 6.025e-13 | 1.12e-08 |
| MGAT4A|11320 | 0.3632 | 6.027e-13 | 1.12e-08 |
| AEN|64782 | -0.3595 | 1.071e-12 | 1.99e-08 |
| HIF3A|64344 | 0.3624 | 1.116e-12 | 2.08e-08 |
| NR2F6|2063 | 0.3473 | 6.671e-12 | 1.24e-07 |
| S100A1|6271 | 0.3453 | 9.071e-12 | 1.69e-07 |
| DACT1|51339 | -0.3447 | 9.894e-12 | 1.84e-07 |
| HTRA1|5654 | -0.3371 | 2.933e-11 | 5.46e-07 |
| PTGS1|5742 | 0.3368 | 3.085e-11 | 5.74e-07 |
Figure S2. Get High-res Image As an example, this figure shows the association of DIO2|1734 to 'AGE'. P value = 1.32e-16 with Spearman correlation analysis. The straight line presents the best linear regression.
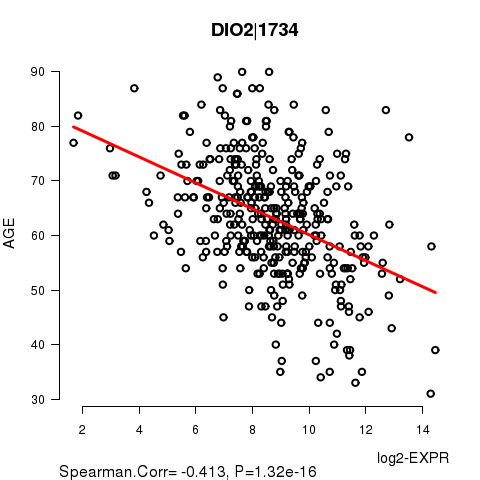
Table S5. Basic characteristics of clinical feature: 'HISTOLOGICAL.TYPE'
| HISTOLOGICAL.TYPE | Labels | N |
| ENDOMETRIOID ENDOMETRIAL ADENOCARCINOMA | 302 | |
| MIXED SEROUS AND ENDOMETRIOID | 10 | |
| SEROUS ENDOMETRIAL ADENOCARCINOMA | 57 | |
| Significant markers | N = 3163 |
Table S6. Get Full Table List of top 10 genes differentially expressed by 'HISTOLOGICAL.TYPE'
| ANOVA_P | Q | |
|---|---|---|
| L1CAM|3897 | 1.306e-50 | 2.43e-46 |
| KIAA1324|57535 | 1.681e-48 | 3.13e-44 |
| CLDN6|9074 | 1.448e-40 | 2.7e-36 |
| SPDEF|25803 | 2.902e-37 | 5.41e-33 |
| GRB7|2886 | 3.992e-37 | 7.43e-33 |
| TFF3|7033 | 1.431e-35 | 2.67e-31 |
| SLC6A12|6539 | 3.643e-35 | 6.78e-31 |
| DLGAP3|58512 | 1.265e-34 | 2.35e-30 |
| HIF3A|64344 | 7.629e-34 | 1.42e-29 |
| FOXA2|3170 | 3.298e-33 | 6.14e-29 |
Figure S3. Get High-res Image As an example, this figure shows the association of L1CAM|3897 to 'HISTOLOGICAL.TYPE'. P value = 1.31e-50 with ANOVA analysis.
2 genes related to 'RADIATIONS.RADIATION.REGIMENINDICATION'.
Table S7. Basic characteristics of clinical feature: 'RADIATIONS.RADIATION.REGIMENINDICATION'
| RADIATIONS.RADIATION.REGIMENINDICATION | Labels | N |
| NO | 123 | |
| YES | 246 | |
| Significant markers | N = 2 | |
| Higher in YES | 2 | |
| Higher in NO | 0 |
Table S8. Get Full Table List of 2 genes differentially expressed by 'RADIATIONS.RADIATION.REGIMENINDICATION'
| T(pos if higher in 'YES') | ttestP | Q | AUC | |
|---|---|---|---|---|
| C8ORF79|57604 | 5.11 | 6.82e-07 | 0.0127 | 0.6602 |
| CEP68|23177 | 4.85 | 2.212e-06 | 0.0412 | 0.6444 |
Figure S4. Get High-res Image As an example, this figure shows the association of C8ORF79|57604 to 'RADIATIONS.RADIATION.REGIMENINDICATION'. P value = 6.82e-07 with T-test analysis.
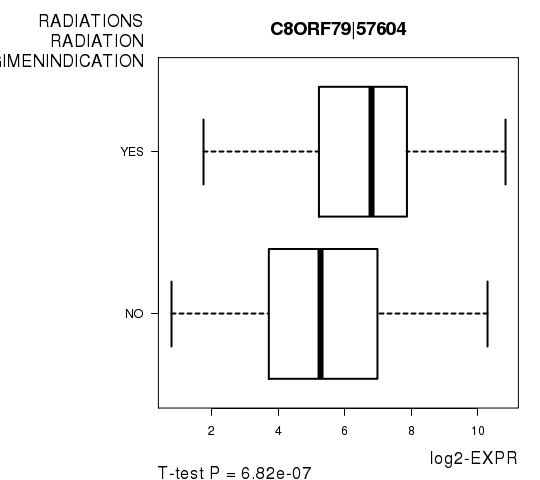
Table S9. Basic characteristics of clinical feature: 'COMPLETENESS.OF.RESECTION'
| COMPLETENESS.OF.RESECTION | Labels | N |
| R0 | 261 | |
| R1 | 21 | |
| R2 | 12 | |
| RX | 22 | |
| Significant markers | N = 2 |
Table S10. Get Full Table List of 2 genes differentially expressed by 'COMPLETENESS.OF.RESECTION'
| ANOVA_P | Q | |
|---|---|---|
| DGCR6|8214 | 6.398e-10 | 1.19e-05 |
| FRMD1|79981 | 1.638e-08 | 0.000305 |
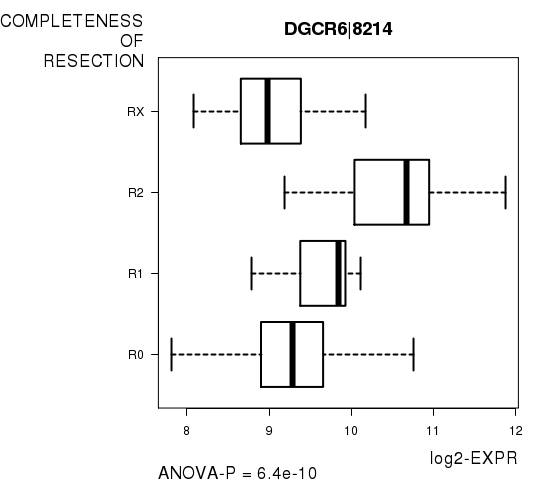
Figure S5. Get High-res Image As an example, this figure shows the association of DGCR6|8214 to 'COMPLETENESS.OF.RESECTION'. P value = 6.4e-10 with ANOVA analysis.
-
Expresson data file = UCEC-TP.uncv2.mRNAseq_RSEM_normalized_log2.txt
-
Clinical data file = UCEC-TP.clin.merged.picked.txt
-
Number of patients = 369
-
Number of genes = 18627
-
Number of clinical features = 5
For survival clinical features, Wald's test in univariate Cox regression analysis with proportional hazards model (Andersen and Gill 1982) was used to estimate the P values using the 'coxph' function in R. Kaplan-Meier survival curves were plot using the four quartile subgroups of patients based on expression levels
For continuous numerical clinical features, Spearman's rank correlation coefficients (Spearman 1904) and two-tailed P values were estimated using 'cor.test' function in R
For multi-class clinical features (ordinal or nominal), one-way analysis of variance (Howell 2002) was applied to compare the log2-expression levels between different clinical classes using 'anova' function in R
For two-class clinical features, two-tailed Student's t test with unequal variance (Lehmann and Romano 2005) was applied to compare the log2-expression levels between the two clinical classes using 't.test' function in R
For multiple hypothesis correction, Q value is the False Discovery Rate (FDR) analogue of the P value (Benjamini and Hochberg 1995), defined as the minimum FDR at which the test may be called significant. We used the 'Benjamini and Hochberg' method of 'p.adjust' function in R to convert P values into Q values.
This is an experimental feature. The full results of the analysis summarized in this report can be downloaded from the TCGA Data Coordination Center.