(primary solid tumor cohort)
This pipeline uses various statistical tests to identify genes whose promoter methylation levels correlated to selected clinical features.
Testing the association between 17621 genes and 5 clinical features across 256 samples, statistically thresholded by Q value < 0.05, 5 clinical features related to at least one genes.
-
2 genes correlated to 'Time to Death'.
-
TMEM84 , SLC38A8
-
202 genes correlated to 'AGE'.
-
SLFN14 , PLA2G15 , ALS2CL , ACAA2 , SCARNA17 , ...
-
2178 genes correlated to 'HISTOLOGICAL.TYPE'.
-
CARD11 , NCRNA00203 , ABCB6 , KCNIP2 , SSTR1 , ...
-
2 genes correlated to 'RADIATIONS.RADIATION.REGIMENINDICATION'.
-
GRIK3 , FOXG1
-
33 genes correlated to 'COMPLETENESS.OF.RESECTION'.
-
DNASE1L2 , TNFRSF19 , HIST1H2BO , MYRIP , PRRG2 , ...
Complete statistical result table is provided in Supplement Table 1
Table 1. Get Full Table This table shows the clinical features, statistical methods used, and the number of genes that are significantly associated with each clinical feature at Q value < 0.05.
| Clinical feature | Statistical test | Significant genes | Associated with | Associated with | ||
|---|---|---|---|---|---|---|
| Time to Death | Cox regression test | N=2 | shorter survival | N=0 | longer survival | N=2 |
| AGE | Spearman correlation test | N=202 | older | N=67 | younger | N=135 |
| HISTOLOGICAL TYPE | ANOVA test | N=2178 | ||||
| RADIATIONS RADIATION REGIMENINDICATION | t test | N=2 | yes | N=2 | no | N=0 |
| COMPLETENESS OF RESECTION | ANOVA test | N=33 |
Table S1. Basic characteristics of clinical feature: 'Time to Death'
| Time to Death | Duration (Months) | 0-187.1 (median=13.4) |
| censored | N = 233 | |
| death | N = 21 | |
| Significant markers | N = 2 | |
| associated with shorter survival | 0 | |
| associated with longer survival | 2 |
Table S2. Get Full Table List of 2 genes significantly associated with 'Time to Death' by Cox regression test
| HazardRatio | Wald_P | Q | C_index | |
|---|---|---|---|---|
| TMEM84 | 0 | 3.618e-08 | 0.00064 | 0.344 |
| SLC38A8 | 0 | 1.92e-06 | 0.034 | 0.413 |
Figure S1. Get High-res Image As an example, this figure shows the association of TMEM84 to 'Time to Death'. four curves present the cumulative survival rates of 4 quartile subsets of patients. P value = 3.62e-08 with univariate Cox regression analysis using continuous log-2 expression values.
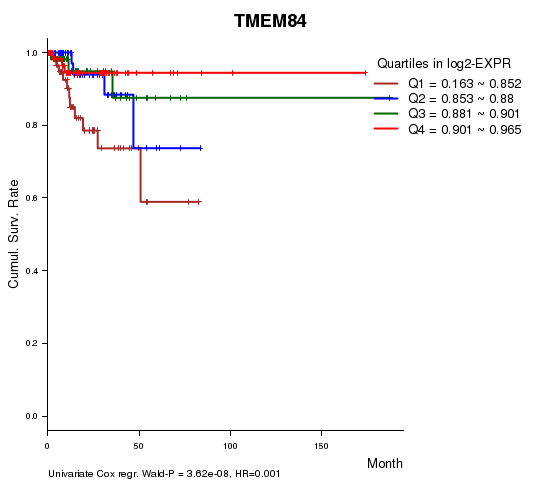
Table S3. Basic characteristics of clinical feature: 'AGE'
| AGE | Mean (SD) | 63.44 (11) |
| Significant markers | N = 202 | |
| pos. correlated | 67 | |
| neg. correlated | 135 |
Table S4. Get Full Table List of top 10 genes significantly correlated to 'AGE' by Spearman correlation test
| SpearmanCorr | corrP | Q | |
|---|---|---|---|
| SLFN14 | 0.4397 | 1.577e-13 | 2.78e-09 |
| PLA2G15 | -0.4152 | 4.325e-12 | 7.62e-08 |
| ALS2CL | -0.3959 | 4.875e-11 | 8.59e-07 |
| ACAA2 | -0.3856 | 1.686e-10 | 2.97e-06 |
| SCARNA17 | -0.3856 | 1.686e-10 | 2.97e-06 |
| C19ORF55 | -0.3813 | 2.782e-10 | 4.9e-06 |
| SCGBL | 0.375 | 5.694e-10 | 1e-05 |
| ADAMTS15 | -0.372 | 7.997e-10 | 1.41e-05 |
| AHSP | 0.3694 | 1.068e-09 | 1.88e-05 |
| CYP1A2 | 0.3694 | 1.07e-09 | 1.88e-05 |
Figure S2. Get High-res Image As an example, this figure shows the association of SLFN14 to 'AGE'. P value = 1.58e-13 with Spearman correlation analysis. The straight line presents the best linear regression.
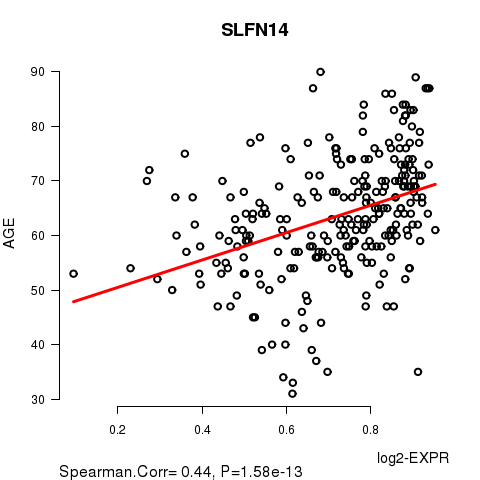
Table S5. Basic characteristics of clinical feature: 'HISTOLOGICAL.TYPE'
| HISTOLOGICAL.TYPE | Labels | N |
| ENDOMETRIOID ENDOMETRIAL ADENOCARCINOMA | 207 | |
| MIXED SEROUS AND ENDOMETRIOID | 9 | |
| SEROUS ENDOMETRIAL ADENOCARCINOMA | 40 | |
| Significant markers | N = 2178 |
Table S6. Get Full Table List of top 10 genes differentially expressed by 'HISTOLOGICAL.TYPE'
| ANOVA_P | Q | |
|---|---|---|
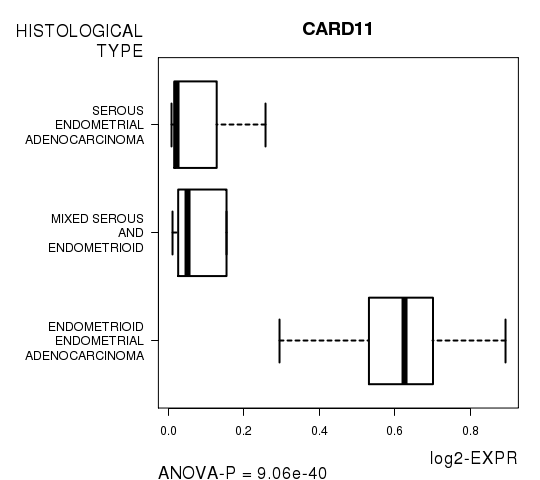
| CARD11 | 9.062e-40 | 1.6e-35 |
| NCRNA00203 | 1.667e-36 | 2.94e-32 |
| ABCB6 | 4.747e-36 | 8.36e-32 |
| KCNIP2 | 2.182e-34 | 3.84e-30 |
| SSTR1 | 2.235e-34 | 3.94e-30 |
| CRYAB | 6.25e-34 | 1.1e-29 |
| HSPB2 | 1.204e-33 | 2.12e-29 |
| SH3BP2 | 2.58e-32 | 4.55e-28 |
| LASP1 | 4.22e-32 | 7.43e-28 |
| ASAP2 | 5.793e-32 | 1.02e-27 |
Figure S3. Get High-res Image As an example, this figure shows the association of CARD11 to 'HISTOLOGICAL.TYPE'. P value = 9.06e-40 with ANOVA analysis.
2 genes related to 'RADIATIONS.RADIATION.REGIMENINDICATION'.
Table S7. Basic characteristics of clinical feature: 'RADIATIONS.RADIATION.REGIMENINDICATION'
| RADIATIONS.RADIATION.REGIMENINDICATION | Labels | N |
| NO | 70 | |
| YES | 186 | |
| Significant markers | N = 2 | |
| Higher in YES | 2 | |
| Higher in NO | 0 |
Table S8. Get Full Table List of 2 genes differentially expressed by 'RADIATIONS.RADIATION.REGIMENINDICATION'
| T(pos if higher in 'YES') | ttestP | Q | AUC | |
|---|---|---|---|---|
| GRIK3 | 5.07 | 7.589e-07 | 0.0134 | 0.6538 |
| FOXG1 | 5.07 | 9.327e-07 | 0.0164 | 0.6659 |
Figure S4. Get High-res Image As an example, this figure shows the association of GRIK3 to 'RADIATIONS.RADIATION.REGIMENINDICATION'. P value = 7.59e-07 with T-test analysis.
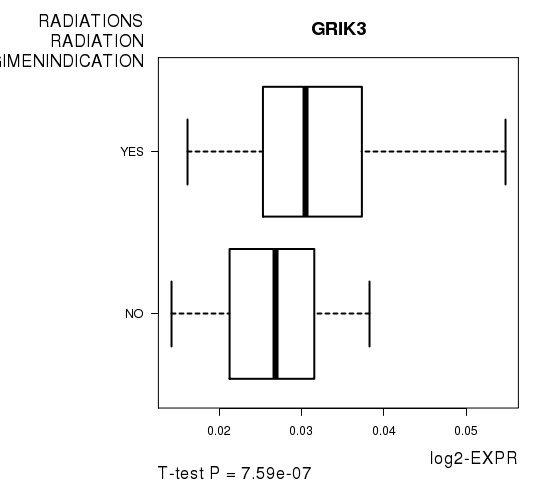
Table S9. Basic characteristics of clinical feature: 'COMPLETENESS.OF.RESECTION'
| COMPLETENESS.OF.RESECTION | Labels | N |
| R0 | 173 | |
| R1 | 15 | |
| R2 | 8 | |
| RX | 20 | |
| Significant markers | N = 33 |
Table S10. Get Full Table List of top 10 genes differentially expressed by 'COMPLETENESS.OF.RESECTION'
| ANOVA_P | Q | |
|---|---|---|
| DNASE1L2 | 1.784e-10 | 3.14e-06 |
| TNFRSF19 | 4.474e-08 | 0.000788 |
| HIST1H2BO | 7.921e-08 | 0.0014 |
| MYRIP | 1.159e-07 | 0.00204 |
| PRRG2 | 1.218e-07 | 0.00215 |
| PSMA1 | 1.998e-07 | 0.00352 |
| SYT12 | 2.11e-07 | 0.00372 |
| CCL2 | 2.316e-07 | 0.00408 |
| AVL9 | 3.629e-07 | 0.00639 |
| IGFBP3 | 5.195e-07 | 0.00915 |
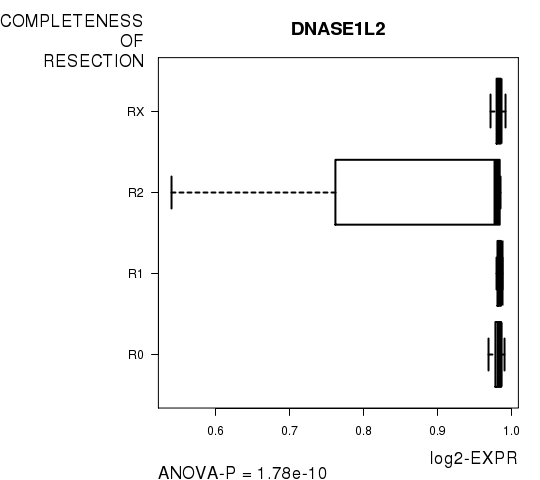
Figure S5. Get High-res Image As an example, this figure shows the association of DNASE1L2 to 'COMPLETENESS.OF.RESECTION'. P value = 1.78e-10 with ANOVA analysis.
-
Expresson data file = UCEC-TP.meth.for_correlation.filtered_data.txt
-
Clinical data file = UCEC-TP.clin.merged.picked.txt
-
Number of patients = 256
-
Number of genes = 17621
-
Number of clinical features = 5
For survival clinical features, Wald's test in univariate Cox regression analysis with proportional hazards model (Andersen and Gill 1982) was used to estimate the P values using the 'coxph' function in R. Kaplan-Meier survival curves were plot using the four quartile subgroups of patients based on expression levels
For continuous numerical clinical features, Spearman's rank correlation coefficients (Spearman 1904) and two-tailed P values were estimated using 'cor.test' function in R
For multi-class clinical features (ordinal or nominal), one-way analysis of variance (Howell 2002) was applied to compare the log2-expression levels between different clinical classes using 'anova' function in R
For two-class clinical features, two-tailed Student's t test with unequal variance (Lehmann and Romano 2005) was applied to compare the log2-expression levels between the two clinical classes using 't.test' function in R
For multiple hypothesis correction, Q value is the False Discovery Rate (FDR) analogue of the P value (Benjamini and Hochberg 1995), defined as the minimum FDR at which the test may be called significant. We used the 'Benjamini and Hochberg' method of 'p.adjust' function in R to convert P values into Q values.
This is an experimental feature. The full results of the analysis summarized in this report can be downloaded from the TCGA Data Coordination Center.