This pipeline uses various statistical tests to identify genes whose promoter methylation levels correlated to selected clinical features.
Testing the association between 17320 genes and 8 clinical features across 530 samples, statistically thresholded by Q value < 0.05, 7 clinical features related to at least one genes.
-
1 gene correlated to 'Time to Death'.
-
CDC73
-
139 genes correlated to 'AGE'.
-
KIF15 , MEX3C , EGR2 , LGALS8 , RPL13A , ...
-
186 genes correlated to 'GENDER'.
-
ALDOC , ZNF486 , CRIP1 , DNAJC15 , NMNAT3 , ...
-
161 genes correlated to 'RADIATIONS.RADIATION.REGIMENINDICATION'.
-
CCDC86 , NDUFB4 , TUBA4B , HS1BP3 , MAP3K10 , ...
-
6 genes correlated to 'DISTANT.METASTASIS'.
-
NHEDC1 , IL10RB , C9ORF153 , TINF2 , SNX29 , ...
-
39 genes correlated to 'LYMPH.NODE.METASTASIS'.
-
SS18L1 , ZNF235 , MANBAL , HCRTR2 , TMEM33 , ...
-
31 genes correlated to 'NEOPLASM.DISEASESTAGE'.
-
IDH3B , DRG2 , ATP5J , HIST1H4C , WDR74 , ...
-
No genes correlated to 'NUMBER.OF.LYMPH.NODES'
Complete statistical result table is provided in Supplement Table 1
Table 1. Get Full Table This table shows the clinical features, statistical methods used, and the number of genes that are significantly associated with each clinical feature at Q value < 0.05.
| Clinical feature | Statistical test | Significant genes | Associated with | Associated with | ||
|---|---|---|---|---|---|---|
| Time to Death | Cox regression test | N=1 | shorter survival | N=0 | longer survival | N=1 |
| AGE | Spearman correlation test | N=139 | older | N=126 | younger | N=13 |
| GENDER | t test | N=186 | male | N=41 | female | N=145 |
| RADIATIONS RADIATION REGIMENINDICATION | t test | N=161 | yes | N=139 | no | N=22 |
| DISTANT METASTASIS | ANOVA test | N=6 | ||||
| LYMPH NODE METASTASIS | ANOVA test | N=39 | ||||
| NUMBER OF LYMPH NODES | Spearman correlation test | N=0 | ||||
| NEOPLASM DISEASESTAGE | ANOVA test | N=31 |
Table S1. Basic characteristics of clinical feature: 'Time to Death'
| Time to Death | Duration (Months) | 0-223.4 (median=17.9) |
| censored | N = 444 | |
| death | N = 58 | |
| Significant markers | N = 1 | |
| associated with shorter survival | 0 | |
| associated with longer survival | 1 |
Table S2. Get Full Table List of one gene significantly associated with 'Time to Death' by Cox regression test
| HazardRatio | Wald_P | Q | C_index | |
|---|---|---|---|---|
| CDC73 | 0 | 1.388e-06 | 0.024 | 0.355 |
Figure S1. Get High-res Image As an example, this figure shows the association of CDC73 to 'Time to Death'. four curves present the cumulative survival rates of 4 quartile subsets of patients. P value = 1.39e-06 with univariate Cox regression analysis using continuous log-2 expression values.

Table S3. Basic characteristics of clinical feature: 'AGE'
| AGE | Mean (SD) | 57.6 (13) |
| Significant markers | N = 139 | |
| pos. correlated | 126 | |
| neg. correlated | 13 |
Table S4. Get Full Table List of top 10 genes significantly correlated to 'AGE' by Spearman correlation test
| SpearmanCorr | corrP | Q | |
|---|---|---|---|
| KIF15 | 0.3146 | 1.281e-13 | 2.22e-09 |
| MEX3C | 0.2866 | 1.839e-11 | 3.19e-07 |
| EGR2 | 0.2857 | 2.157e-11 | 3.74e-07 |
| LGALS8 | -0.2825 | 3.667e-11 | 6.35e-07 |
| RPL13A | 0.281 | 4.709e-11 | 8.15e-07 |
| C10ORF35 | 0.2783 | 7.276e-11 | 1.26e-06 |
| FASN | 0.2741 | 1.43e-10 | 2.48e-06 |
| RPL27A | 0.2672 | 4.222e-10 | 7.31e-06 |
| RPL7A | 0.2661 | 5.029e-10 | 8.71e-06 |
| EIF4A1 | 0.2625 | 8.783e-10 | 1.52e-05 |
Figure S2. Get High-res Image As an example, this figure shows the association of KIF15 to 'AGE'. P value = 1.28e-13 with Spearman correlation analysis. The straight line presents the best linear regression.
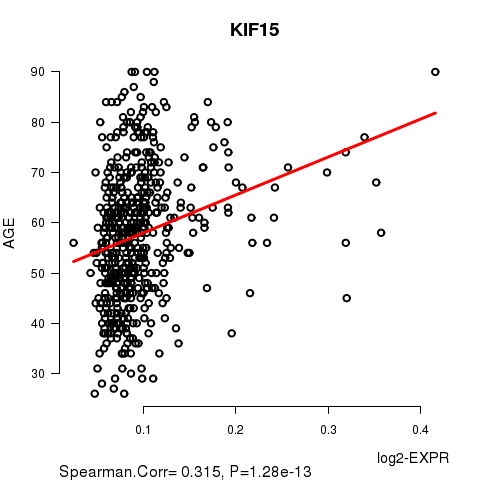
Table S5. Basic characteristics of clinical feature: 'GENDER'
| GENDER | Labels | N |
| FEMALE | 524 | |
| MALE | 6 | |
| Significant markers | N = 186 | |
| Higher in MALE | 41 | |
| Higher in FEMALE | 145 |
Table S6. Get Full Table List of top 10 genes differentially expressed by 'GENDER'
| T(pos if higher in 'MALE') | ttestP | Q | AUC | |
|---|---|---|---|---|
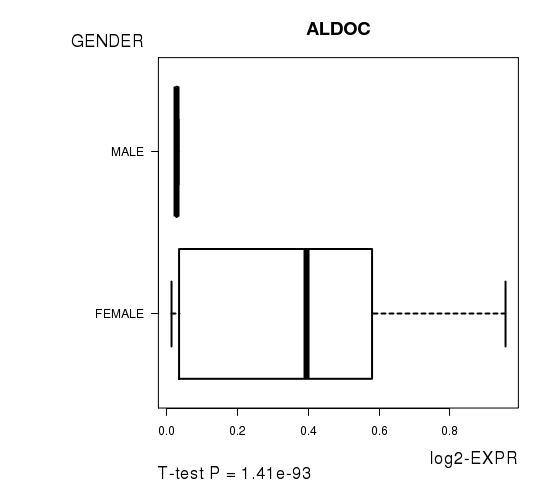
| ALDOC | -25.69 | 1.408e-93 | 2.44e-89 | 0.8677 |
| ZNF486 | -18.27 | 5.628e-58 | 9.75e-54 | 0.8165 |
| CRIP1 | -16.92 | 1.283e-51 | 2.22e-47 | 0.8728 |
| DNAJC15 | -13.77 | 1.089e-35 | 1.89e-31 | 0.7325 |
| NMNAT3 | -13.22 | 4.298e-34 | 7.44e-30 | 0.6905 |
| LOC400043 | -13.13 | 3.755e-31 | 6.5e-27 | 0.6023 |
| RND2 | -13.17 | 2.007e-28 | 3.48e-24 | 0.792 |
| EML1 | -11.43 | 5.825e-27 | 1.01e-22 | 0.6072 |
| SPC25 | -12.2 | 3.114e-26 | 5.39e-22 | 0.7516 |
| HSPC157 | -12.95 | 7.35e-25 | 1.27e-20 | 0.6307 |
Figure S3. Get High-res Image As an example, this figure shows the association of ALDOC to 'GENDER'. P value = 1.41e-93 with T-test analysis.
161 genes related to 'RADIATIONS.RADIATION.REGIMENINDICATION'.
Table S7. Basic characteristics of clinical feature: 'RADIATIONS.RADIATION.REGIMENINDICATION'
| RADIATIONS.RADIATION.REGIMENINDICATION | Labels | N |
| NO | 141 | |
| YES | 389 | |
| Significant markers | N = 161 | |
| Higher in YES | 139 | |
| Higher in NO | 22 |
Table S8. Get Full Table List of top 10 genes differentially expressed by 'RADIATIONS.RADIATION.REGIMENINDICATION'
| T(pos if higher in 'YES') | ttestP | Q | AUC | |
|---|---|---|---|---|
| CCDC86 | 6.9 | 3.016e-11 | 5.22e-07 | 0.6798 |
| NDUFB4 | 6.53 | 2.722e-10 | 4.71e-06 | 0.6671 |
| TUBA4B | 6.4 | 4.162e-10 | 7.21e-06 | 0.6405 |
| HS1BP3 | 6.25 | 1.179e-09 | 2.04e-05 | 0.6597 |
| MAP3K10 | 6.24 | 1.408e-09 | 2.44e-05 | 0.6496 |
| PTRH1 | 6.12 | 1.798e-09 | 3.11e-05 | 0.6147 |
| TICAM1 | 6.16 | 2.361e-09 | 4.09e-05 | 0.661 |
| DDX54 | 6.12 | 2.798e-09 | 4.84e-05 | 0.6528 |
| RASL11A | 6.06 | 2.853e-09 | 4.94e-05 | 0.6322 |
| CCDC85B | 6.08 | 3.693e-09 | 6.39e-05 | 0.661 |
Figure S4. Get High-res Image As an example, this figure shows the association of CCDC86 to 'RADIATIONS.RADIATION.REGIMENINDICATION'. P value = 3.02e-11 with T-test analysis.

Table S9. Basic characteristics of clinical feature: 'DISTANT.METASTASIS'
| DISTANT.METASTASIS | Labels | N |
| CM0 (I+) | 1 | |
| M0 | 418 | |
| M1 | 3 | |
| MX | 62 | |
| Significant markers | N = 6 |
Table S10. Get Full Table List of 6 genes differentially expressed by 'DISTANT.METASTASIS'
| ANOVA_P | Q | |
|---|---|---|
| NHEDC1 | 1.503e-28 | 2.6e-24 |
| IL10RB | 7.967e-12 | 1.38e-07 |
| C9ORF153 | 1.715e-08 | 0.000297 |
| TINF2 | 3.257e-07 | 0.00564 |
| SNX29 | 5.012e-07 | 0.00868 |
| DNAJB7 | 2.47e-06 | 0.0428 |
Figure S5. Get High-res Image As an example, this figure shows the association of NHEDC1 to 'DISTANT.METASTASIS'. P value = 1.5e-28 with ANOVA analysis.

Table S11. Basic characteristics of clinical feature: 'LYMPH.NODE.METASTASIS'
| LYMPH.NODE.METASTASIS | Labels | N |
| N0 | 139 | |
| N0 (I+) | 11 | |
| N0 (I-) | 60 | |
| N0 (MOL+) | 1 | |
| N1 | 61 | |
| N1A | 76 | |
| N1B | 22 | |
| N1C | 2 | |
| N1MI | 13 | |
| N2 | 33 | |
| N2A | 35 | |
| N3 | 8 | |
| N3A | 16 | |
| N3B | 1 | |
| NX | 6 | |
| Significant markers | N = 39 |
Table S12. Get Full Table List of top 10 genes differentially expressed by 'LYMPH.NODE.METASTASIS'
| ANOVA_P | Q | |
|---|---|---|
| SS18L1 | 1.514e-67 | 2.62e-63 |
| ZNF235 | 1.125e-47 | 1.95e-43 |
| MANBAL | 1.686e-31 | 2.92e-27 |
| HCRTR2 | 7.914e-23 | 1.37e-18 |
| TMEM33 | 4.957e-19 | 8.58e-15 |
| ZNF33A | 3.578e-17 | 6.2e-13 |
| SCRN2 | 1.593e-14 | 2.76e-10 |
| KCNQ5 | 6.81e-13 | 1.18e-08 |
| CLPP | 4.655e-11 | 8.06e-07 |
| TMEM208 | 1.445e-10 | 2.5e-06 |
Figure S6. Get High-res Image As an example, this figure shows the association of SS18L1 to 'LYMPH.NODE.METASTASIS'. P value = 1.51e-67 with ANOVA analysis.

Table S13. Basic characteristics of clinical feature: 'NUMBER.OF.LYMPH.NODES'
| NUMBER.OF.LYMPH.NODES | Mean (SD) | 2.41 (4.5) |
| Significant markers | N = 0 |
Table S14. Basic characteristics of clinical feature: 'NEOPLASM.DISEASESTAGE'
| NEOPLASM.DISEASESTAGE | Labels | N |
| STAGE I | 43 | |
| STAGE IA | 34 | |
| STAGE IB | 2 | |
| STAGE II | 8 | |
| STAGE IIA | 160 | |
| STAGE IIB | 114 | |
| STAGE III | 2 | |
| STAGE IIIA | 78 | |
| STAGE IIIB | 12 | |
| STAGE IIIC | 23 | |
| STAGE IV | 3 | |
| STAGE X | 4 | |
| Significant markers | N = 31 |
Table S15. Get Full Table List of top 10 genes differentially expressed by 'NEOPLASM.DISEASESTAGE'
| ANOVA_P | Q | |
|---|---|---|
| IDH3B | 3.242e-59 | 5.62e-55 |
| DRG2 | 4.677e-27 | 8.1e-23 |
| ATP5J | 5.262e-17 | 9.11e-13 |
| HIST1H4C | 1.805e-16 | 3.13e-12 |
| WDR74 | 7.159e-16 | 1.24e-11 |
| LNP1 | 3.022e-14 | 5.23e-10 |
| TTC32 | 1.513e-13 | 2.62e-09 |
| OPA1 | 2.176e-12 | 3.77e-08 |
| POLE4 | 1.031e-11 | 1.78e-07 |
| C17ORF75 | 3.753e-11 | 6.5e-07 |
Figure S7. Get High-res Image As an example, this figure shows the association of IDH3B to 'NEOPLASM.DISEASESTAGE'. P value = 3.24e-59 with ANOVA analysis.

-
Expresson data file = BRCA-TP.meth.for_correlation.filtered_data.txt
-
Clinical data file = BRCA-TP.clin.merged.picked.txt
-
Number of patients = 530
-
Number of genes = 17320
-
Number of clinical features = 8
For survival clinical features, Wald's test in univariate Cox regression analysis with proportional hazards model (Andersen and Gill 1982) was used to estimate the P values using the 'coxph' function in R. Kaplan-Meier survival curves were plot using the four quartile subgroups of patients based on expression levels
For continuous numerical clinical features, Spearman's rank correlation coefficients (Spearman 1904) and two-tailed P values were estimated using 'cor.test' function in R
For two-class clinical features, two-tailed Student's t test with unequal variance (Lehmann and Romano 2005) was applied to compare the log2-expression levels between the two clinical classes using 't.test' function in R
For multi-class clinical features (ordinal or nominal), one-way analysis of variance (Howell 2002) was applied to compare the log2-expression levels between different clinical classes using 'anova' function in R
For multiple hypothesis correction, Q value is the False Discovery Rate (FDR) analogue of the P value (Benjamini and Hochberg 1995), defined as the minimum FDR at which the test may be called significant. We used the 'Benjamini and Hochberg' method of 'p.adjust' function in R to convert P values into Q values.
This is an experimental feature. The full results of the analysis summarized in this report can be downloaded from the TCGA Data Coordination Center.