This pipeline computes the correlation between significant copy number variation (cnv focal) genes and selected clinical features.
Testing the association between copy number variation 70 arm-level results and 5 clinical features across 544 patients, 15 significant findings detected with Q value < 0.25.
-
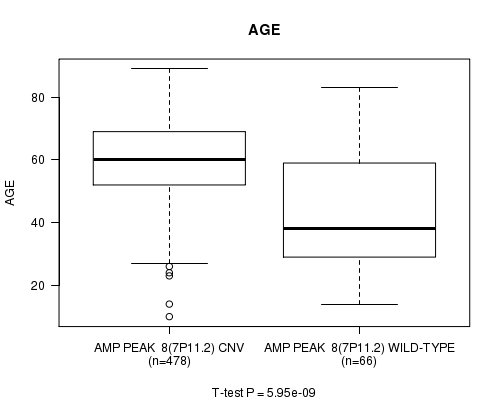
Amp Peak 8(7p11.2) cnv correlated to 'Time to Death' and 'AGE'.
-
Amp Peak 9(7q11.21) cnv correlated to 'Time to Death' and 'AGE'.
-
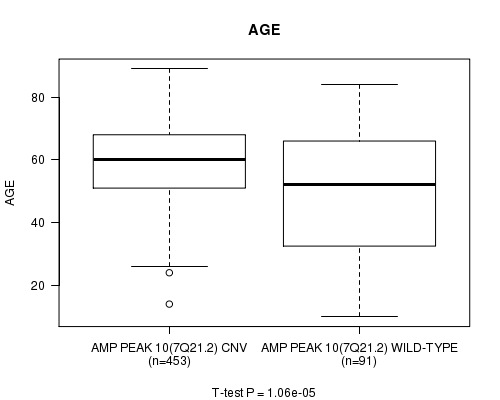
Amp Peak 10(7q21.2) cnv correlated to 'AGE'.
-
Del Peak 19(9p21.3) cnv correlated to 'AGE'.
-
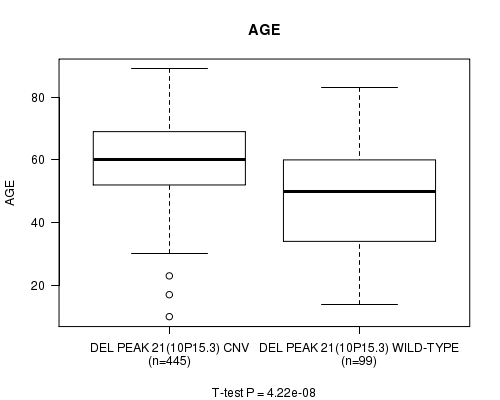
Del Peak 21(10p15.3) cnv correlated to 'Time to Death' and 'AGE'.
-
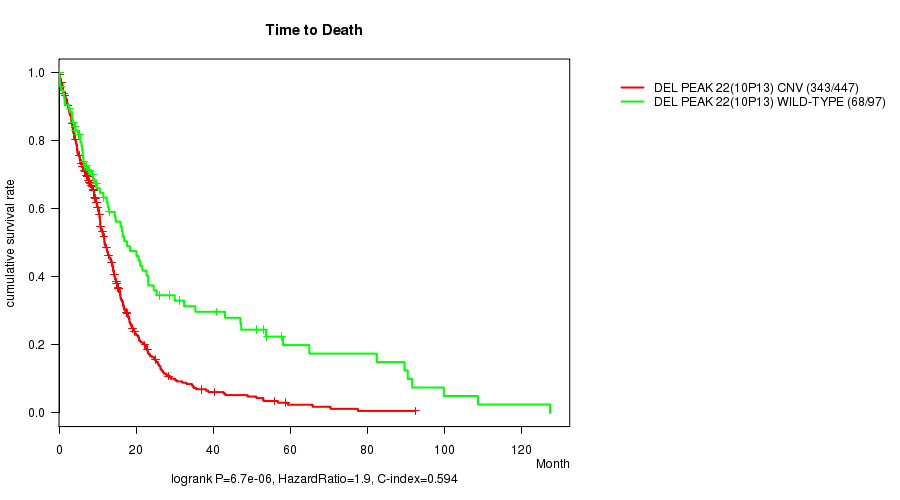
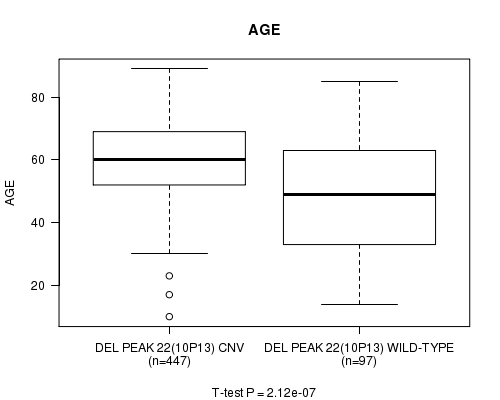
Del Peak 22(10p13) cnv correlated to 'Time to Death' and 'AGE'.
-
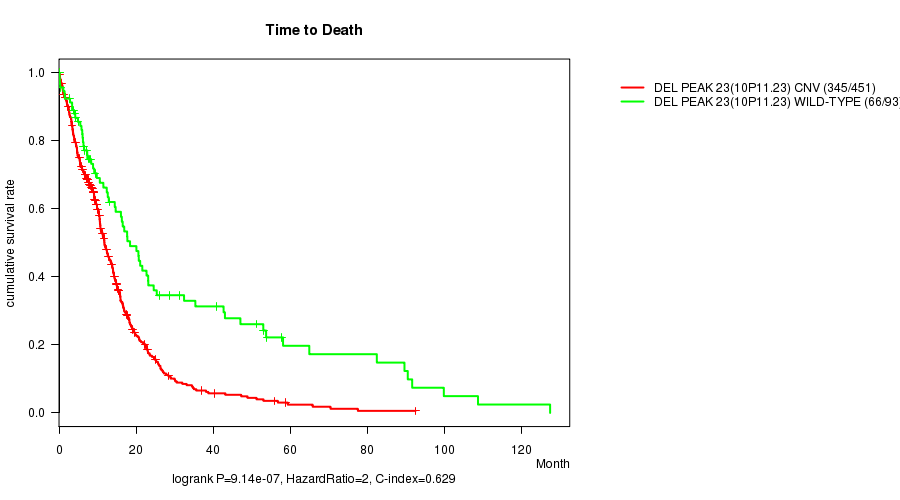
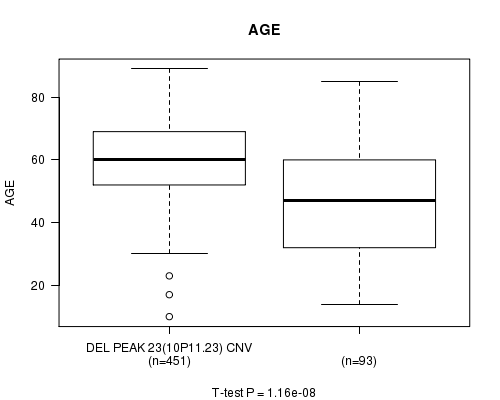
Del Peak 23(10p11.23) cnv correlated to 'Time to Death' and 'AGE'.
-
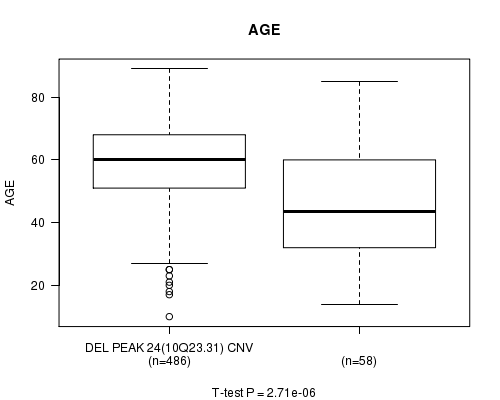
Del Peak 24(10q23.31) cnv correlated to 'Time to Death' and 'AGE'.
-
Del Peak 25(10q26.3) cnv correlated to 'AGE'.
Table 1. Get Full Table Overview of the association between significant copy number variation of 70 arm-level results and 5 clinical features. Shown in the table are P values (Q values). Thresholded by Q value < 0.25, 15 significant findings detected.
|
Clinical Features |
Time to Death |
AGE | GENDER |
KARNOFSKY PERFORMANCE SCORE |
RADIATIONS RADIATION REGIMENINDICATION |
||
| nCNV (%) | nWild-Type | logrank test | t-test | Fisher's exact test | t-test | Fisher's exact test | |
| Amp Peak 8(7p11 2) | 0 (0%) | 66 |
2.57e-06 (0.000885) |
5.95e-09 (2.08e-06) |
0.502 (1.00) |
0.0351 (1.00) |
0.0239 (1.00) |
| Amp Peak 9(7q11 21) | 0 (0%) | 105 |
0.000152 (0.0513) |
8.05e-08 (2.79e-05) |
0.224 (1.00) |
0.658 (1.00) |
0.0268 (1.00) |
| Del Peak 21(10p15 3) | 0 (0%) | 99 |
1.06e-05 (0.00361) |
4.22e-08 (1.47e-05) |
0.088 (1.00) |
0.596 (1.00) |
0.0427 (1.00) |
| Del Peak 22(10p13) | 0 (0%) | 97 |
6.7e-06 (0.00229) |
2.12e-07 (7.33e-05) |
0.0297 (1.00) |
0.884 (1.00) |
0.151 (1.00) |
| Del Peak 23(10p11 23) | 0 (0%) | 93 |
9.14e-07 (0.000315) |
1.16e-08 (4.04e-06) |
0.103 (1.00) |
0.232 (1.00) |
0.18 (1.00) |
| Del Peak 24(10q23 31) | 0 (0%) | 58 |
2.27e-05 (0.0077) |
2.71e-06 (0.000931) |
0.572 (1.00) |
0.0751 (1.00) |
0.302 (1.00) |
| Amp Peak 10(7q21 2) | 0 (0%) | 91 |
0.000974 (0.326) |
1.06e-05 (0.0036) |
0.483 (1.00) |
0.49 (1.00) |
0.0851 (1.00) |
| Del Peak 19(9p21 3) | 0 (0%) | 145 |
0.0223 (1.00) |
0.000156 (0.0524) |
0.552 (1.00) |
0.0926 (1.00) |
0.255 (1.00) |
| Del Peak 25(10q26 3) | 0 (0%) | 57 |
0.00151 (0.501) |
2.89e-05 (0.00976) |
0.478 (1.00) |
0.0613 (1.00) |
0.551 (1.00) |
| Amp Peak 1(1p36 21) | 0 (0%) | 457 |
0.0861 (1.00) |
0.316 (1.00) |
0.283 (1.00) |
0.653 (1.00) |
0.618 (1.00) |
| Amp Peak 2(1q32 1) | 0 (0%) | 396 |
0.436 (1.00) |
0.261 (1.00) |
0.624 (1.00) |
0.279 (1.00) |
0.837 (1.00) |
| Amp Peak 3(1q44) | 0 (0%) | 450 |
0.497 (1.00) |
0.903 (1.00) |
0.297 (1.00) |
0.599 (1.00) |
0.903 (1.00) |
| Amp Peak 4(2p24 3) | 0 (0%) | 500 |
0.151 (1.00) |
0.268 (1.00) |
0.424 (1.00) |
0.583 (1.00) |
1 (1.00) |
| Amp Peak 5(3q26 33) | 0 (0%) | 439 |
0.286 (1.00) |
0.0296 (1.00) |
0.824 (1.00) |
0.688 (1.00) |
0.353 (1.00) |
| Amp Peak 6(4p16 3) | 0 (0%) | 499 |
0.554 (1.00) |
0.539 (1.00) |
0.526 (1.00) |
0.429 (1.00) |
0.0943 (1.00) |
| Amp Peak 7(4q12) | 0 (0%) | 441 |
0.619 (1.00) |
0.532 (1.00) |
0.219 (1.00) |
0.597 (1.00) |
0.292 (1.00) |
| Amp Peak 11(7q31 2) | 0 (0%) | 98 |
0.0246 (1.00) |
0.00146 (0.486) |
0.362 (1.00) |
0.513 (1.00) |
0.0234 (1.00) |
| Amp Peak 12(7q36 1) | 0 (0%) | 93 |
0.061 (1.00) |
0.00223 (0.74) |
0.485 (1.00) |
0.732 (1.00) |
0.18 (1.00) |
| Amp Peak 13(8q24 21) | 0 (0%) | 481 |
0.381 (1.00) |
0.14 (1.00) |
0.275 (1.00) |
0.804 (1.00) |
0.667 (1.00) |
| Amp Peak 14(11p13) | 0 (0%) | 520 |
0.911 (1.00) |
0.237 (1.00) |
0.528 (1.00) |
0.316 (1.00) |
0.269 (1.00) |
| Amp Peak 15(12p13 32) | 0 (0%) | 466 |
0.839 (1.00) |
0.145 (1.00) |
0.901 (1.00) |
0.695 (1.00) |
0.795 (1.00) |
| Amp Peak 16(12q14 1) | 0 (0%) | 417 |
0.125 (1.00) |
0.87 (1.00) |
0.468 (1.00) |
0.808 (1.00) |
0.665 (1.00) |
| Amp Peak 17(12q15) | 0 (0%) | 457 |
0.945 (1.00) |
0.697 (1.00) |
0.339 (1.00) |
0.911 (1.00) |
0.135 (1.00) |
| Amp Peak 18(13q34) | 0 (0%) | 514 |
0.828 (1.00) |
0.847 (1.00) |
0.338 (1.00) |
0.838 (1.00) |
1 (1.00) |
| Amp Peak 19(14q32 33) | 0 (0%) | 513 |
0.0676 (1.00) |
0.00493 (1.00) |
0.453 (1.00) |
0.254 (1.00) |
1 (1.00) |
| Amp Peak 20(17p13 2) | 0 (0%) | 501 |
0.847 (1.00) |
0.749 (1.00) |
0.255 (1.00) |
0.109 (1.00) |
0.497 (1.00) |
| Amp Peak 21(17q25 1) | 0 (0%) | 470 |
0.0765 (1.00) |
0.0404 (1.00) |
0.202 (1.00) |
0.837 (1.00) |
0.593 (1.00) |
| Amp Peak 22(19p13 2) | 0 (0%) | 313 |
0.143 (1.00) |
0.658 (1.00) |
0.859 (1.00) |
0.441 (1.00) |
0.853 (1.00) |
| Amp Peak 23(19q12) | 0 (0%) | 348 |
0.333 (1.00) |
0.397 (1.00) |
0.649 (1.00) |
0.996 (1.00) |
0.849 (1.00) |
| Amp Peak 24(21q21 1) | 0 (0%) | 482 |
0.582 (1.00) |
0.0125 (1.00) |
0.681 (1.00) |
0.549 (1.00) |
0.565 (1.00) |
| Del Peak 1(1p36 32) | 0 (0%) | 449 |
0.403 (1.00) |
0.817 (1.00) |
0.0503 (1.00) |
0.999 (1.00) |
1 (1.00) |
| Del Peak 2(1p36 23) | 0 (0%) | 413 |
0.996 (1.00) |
0.02 (1.00) |
0.0102 (1.00) |
0.193 (1.00) |
0.915 (1.00) |
| Del Peak 3(1p32 3) | 0 (0%) | 485 |
0.761 (1.00) |
0.06 (1.00) |
0.159 (1.00) |
0.687 (1.00) |
0.0786 (1.00) |
| Del Peak 4(1p22 1) | 0 (0%) | 498 |
0.272 (1.00) |
0.321 (1.00) |
1 (1.00) |
0.585 (1.00) |
1 (1.00) |
| Del Peak 5(1q42 11) | 0 (0%) | 499 |
0.0871 (1.00) |
0.0607 (1.00) |
1 (1.00) |
0.0102 (1.00) |
0.137 (1.00) |
| Del Peak 6(1q44) | 0 (0%) | 513 |
0.3 (1.00) |
0.286 (1.00) |
0.851 (1.00) |
0.0669 (1.00) |
0.695 (1.00) |
| Del Peak 7(2q22 1) | 0 (0%) | 501 |
0.311 (1.00) |
0.0941 (1.00) |
0.198 (1.00) |
0.686 (1.00) |
0.174 (1.00) |
| Del Peak 8(2q37 1) | 0 (0%) | 489 |
0.76 (1.00) |
0.345 (1.00) |
0.146 (1.00) |
0.657 (1.00) |
0.361 (1.00) |
| Del Peak 9(3p21 1) | 0 (0%) | 492 |
0.0237 (1.00) |
0.0119 (1.00) |
0.883 (1.00) |
0.698 (1.00) |
0.086 (1.00) |
| Del Peak 10(3q13 31) | 0 (0%) | 489 |
0.528 (1.00) |
0.063 (1.00) |
0.383 (1.00) |
0.306 (1.00) |
0.29 (1.00) |
| Del Peak 11(3q22 1) | 0 (0%) | 489 |
0.656 (1.00) |
0.136 (1.00) |
1 (1.00) |
0.49 (1.00) |
0.29 (1.00) |
| Del Peak 12(3q29) | 0 (0%) | 482 |
0.26 (1.00) |
0.194 (1.00) |
0.891 (1.00) |
0.459 (1.00) |
0.193 (1.00) |
| Del Peak 13(4p16 3) | 0 (0%) | 468 |
0.313 (1.00) |
0.0312 (1.00) |
0.209 (1.00) |
0.154 (1.00) |
0.427 (1.00) |
| Del Peak 14(4q34 3) | 0 (0%) | 455 |
0.165 (1.00) |
0.0944 (1.00) |
0.0581 (1.00) |
0.66 (1.00) |
0.174 (1.00) |
| Del Peak 15(5q35 3) | 0 (0%) | 492 |
0.0182 (1.00) |
0.181 (1.00) |
1 (1.00) |
0.564 (1.00) |
0.438 (1.00) |
| Del Peak 16(6q22 31) | 0 (0%) | 392 |
0.0438 (1.00) |
0.31 (1.00) |
0.0965 (1.00) |
0.454 (1.00) |
0.683 (1.00) |
| Del Peak 17(6q26) | 0 (0%) | 373 |
0.215 (1.00) |
0.665 (1.00) |
0.186 (1.00) |
0.702 (1.00) |
0.767 (1.00) |
| Del Peak 18(8p23 2) | 0 (0%) | 479 |
0.181 (1.00) |
0.0441 (1.00) |
0.589 (1.00) |
0.634 (1.00) |
0.48 (1.00) |
| Del Peak 20(9q34 2) | 0 (0%) | 474 |
0.441 (1.00) |
0.806 (1.00) |
1 (1.00) |
0.498 (1.00) |
0.784 (1.00) |
| Del Peak 26(11p15 5) | 0 (0%) | 420 |
0.0325 (1.00) |
0.00446 (1.00) |
0.145 (1.00) |
0.242 (1.00) |
0.827 (1.00) |
| Del Peak 27(11p11 2) | 0 (0%) | 445 |
0.0736 (1.00) |
0.595 (1.00) |
0.139 (1.00) |
0.796 (1.00) |
0.342 (1.00) |
| Del Peak 28(11q14 1) | 0 (0%) | 451 |
0.747 (1.00) |
0.865 (1.00) |
0.245 (1.00) |
0.538 (1.00) |
0.0201 (1.00) |
| Del Peak 29(12p13 1) | 0 (0%) | 471 |
0.338 (1.00) |
0.795 (1.00) |
0.442 (1.00) |
0.846 (1.00) |
1 (1.00) |
| Del Peak 30(12q12) | 0 (0%) | 470 |
0.641 (1.00) |
0.798 (1.00) |
0.898 (1.00) |
0.81 (1.00) |
0.285 (1.00) |
| Del Peak 31(12q15) | 0 (0%) | 470 |
0.516 (1.00) |
0.952 (1.00) |
0.371 (1.00) |
0.186 (1.00) |
0.285 (1.00) |
| Del Peak 32(13q14 2) | 0 (0%) | 314 |
0.586 (1.00) |
0.538 (1.00) |
0.929 (1.00) |
0.828 (1.00) |
0.355 (1.00) |
| Del Peak 33(14q13 1) | 0 (0%) | 371 |
0.756 (1.00) |
0.529 (1.00) |
0.222 (1.00) |
0.262 (1.00) |
0.694 (1.00) |
| Del Peak 34(14q24 2) | 0 (0%) | 376 |
0.867 (1.00) |
0.443 (1.00) |
0.394 (1.00) |
0.605 (1.00) |
0.843 (1.00) |
| Del Peak 35(14q31 3) | 0 (0%) | 389 |
0.924 (1.00) |
0.721 (1.00) |
0.628 (1.00) |
0.647 (1.00) |
0.685 (1.00) |
| Del Peak 36(15q14) | 0 (0%) | 398 |
0.459 (1.00) |
0.0774 (1.00) |
0.622 (1.00) |
0.808 (1.00) |
0.149 (1.00) |
| Del Peak 37(16p12 2) | 0 (0%) | 455 |
0.333 (1.00) |
0.31 (1.00) |
0.237 (1.00) |
0.808 (1.00) |
0.804 (1.00) |
| Del Peak 38(16q23 3) | 0 (0%) | 451 |
0.219 (1.00) |
0.956 (1.00) |
0.485 (1.00) |
0.266 (1.00) |
0.0288 (1.00) |
| Del Peak 39(17p13 2) | 0 (0%) | 463 |
0.601 (1.00) |
0.554 (1.00) |
0.221 (1.00) |
0.189 (1.00) |
0.609 (1.00) |
| Del Peak 40(17p13 1) | 0 (0%) | 453 |
0.826 (1.00) |
0.183 (1.00) |
0.0613 (1.00) |
0.797 (1.00) |
0.11 (1.00) |
| Del Peak 41(17q11 2) | 0 (0%) | 477 |
0.605 (1.00) |
0.583 (1.00) |
1 (1.00) |
0.245 (1.00) |
0.0498 (1.00) |
| Del Peak 42(18q22 3) | 0 (0%) | 466 |
0.918 (1.00) |
0.448 (1.00) |
0.708 (1.00) |
0.128 (1.00) |
0.603 (1.00) |
| Del Peak 43(19q13 41) | 0 (0%) | 446 |
0.066 (1.00) |
0.449 (1.00) |
1 (1.00) |
0.264 (1.00) |
0.406 (1.00) |
| Del Peak 44(21q22 3) | 0 (0%) | 486 |
0.757 (1.00) |
0.0758 (1.00) |
0.258 (1.00) |
0.198 (1.00) |
0.883 (1.00) |
| Del Peak 45(22q13 32) | 0 (0%) | 340 |
0.581 (1.00) |
0.387 (1.00) |
0.856 (1.00) |
0.518 (1.00) |
0.705 (1.00) |
| Del Peak 46(Xp22 2) | 0 (0%) | 422 |
0.277 (1.00) |
0.467 (1.00) |
0.675 (1.00) |
0.825 (1.00) |
1 (1.00) |
P value = 2.57e-06 (logrank test), Q value = 0.00088
Table S1. Gene #8: 'Amp Peak 8(7p11.2)' versus Clinical Feature #1: 'Time to Death'
| nPatients | nDeath | Duration Range (Median), Month | |
|---|---|---|---|
| ALL | 544 | 411 | 0.1 - 127.6 (9.6) |
| AMP PEAK 8(7P11.2) CNV | 478 | 367 | 0.1 - 127.6 (9.2) |
| AMP PEAK 8(7P11.2) WILD-TYPE | 66 | 44 | 0.2 - 108.8 (13.5) |
Figure S1. Get High-res Image Gene #8: 'Amp Peak 8(7p11.2)' versus Clinical Feature #1: 'Time to Death'

P value = 5.95e-09 (t-test), Q value = 2.1e-06
Table S2. Gene #8: 'Amp Peak 8(7p11.2)' versus Clinical Feature #2: 'AGE'
| nPatients | Mean (Std.Dev) | |
|---|---|---|
| ALL | 544 | 57.8 (14.3) |
| AMP PEAK 8(7P11.2) CNV | 478 | 59.7 (12.4) |
| AMP PEAK 8(7P11.2) WILD-TYPE | 66 | 43.9 (19.0) |
Figure S2. Get High-res Image Gene #8: 'Amp Peak 8(7p11.2)' versus Clinical Feature #2: 'AGE'
P value = 0.000152 (logrank test), Q value = 0.051
Table S3. Gene #9: 'Amp Peak 9(7q11.21)' versus Clinical Feature #1: 'Time to Death'
| nPatients | nDeath | Duration Range (Median), Month | |
|---|---|---|---|
| ALL | 544 | 411 | 0.1 - 127.6 (9.6) |
| AMP PEAK 9(7Q11.21) CNV | 439 | 333 | 0.1 - 127.6 (9.2) |
| AMP PEAK 9(7Q11.21) WILD-TYPE | 105 | 78 | 0.2 - 108.8 (12.4) |
Figure S3. Get High-res Image Gene #9: 'Amp Peak 9(7q11.21)' versus Clinical Feature #1: 'Time to Death'

P value = 8.05e-08 (t-test), Q value = 2.8e-05
Table S4. Gene #9: 'Amp Peak 9(7q11.21)' versus Clinical Feature #2: 'AGE'
| nPatients | Mean (Std.Dev) | |
|---|---|---|
| ALL | 544 | 57.8 (14.3) |
| AMP PEAK 9(7Q11.21) CNV | 439 | 59.9 (12.3) |
| AMP PEAK 9(7Q11.21) WILD-TYPE | 105 | 49.2 (18.3) |
Figure S4. Get High-res Image Gene #9: 'Amp Peak 9(7q11.21)' versus Clinical Feature #2: 'AGE'

P value = 1.06e-05 (t-test), Q value = 0.0036
Table S5. Gene #10: 'Amp Peak 10(7q21.2)' versus Clinical Feature #2: 'AGE'
| nPatients | Mean (Std.Dev) | |
|---|---|---|
| ALL | 544 | 57.8 (14.3) |
| AMP PEAK 10(7Q21.2) CNV | 453 | 59.5 (12.2) |
| AMP PEAK 10(7Q21.2) WILD-TYPE | 91 | 49.5 (19.9) |
Figure S5. Get High-res Image Gene #10: 'Amp Peak 10(7q21.2)' versus Clinical Feature #2: 'AGE'
P value = 0.000156 (t-test), Q value = 0.052
Table S6. Gene #43: 'Del Peak 19(9p21.3)' versus Clinical Feature #2: 'AGE'
| nPatients | Mean (Std.Dev) | |
|---|---|---|
| ALL | 544 | 57.8 (14.3) |
| DEL PEAK 19(9P21.3) CNV | 399 | 59.3 (13.5) |
| DEL PEAK 19(9P21.3) WILD-TYPE | 145 | 53.7 (15.7) |
Figure S6. Get High-res Image Gene #43: 'Del Peak 19(9p21.3)' versus Clinical Feature #2: 'AGE'

P value = 1.06e-05 (logrank test), Q value = 0.0036
Table S7. Gene #45: 'Del Peak 21(10p15.3)' versus Clinical Feature #1: 'Time to Death'
| nPatients | nDeath | Duration Range (Median), Month | |
|---|---|---|---|
| ALL | 544 | 411 | 0.1 - 127.6 (9.6) |
| DEL PEAK 21(10P15.3) CNV | 445 | 342 | 0.1 - 92.6 (9.4) |
| DEL PEAK 21(10P15.3) WILD-TYPE | 99 | 69 | 0.1 - 127.6 (10.6) |
Figure S7. Get High-res Image Gene #45: 'Del Peak 21(10p15.3)' versus Clinical Feature #1: 'Time to Death'

P value = 4.22e-08 (t-test), Q value = 1.5e-05
Table S8. Gene #45: 'Del Peak 21(10p15.3)' versus Clinical Feature #2: 'AGE'
| nPatients | Mean (Std.Dev) | |
|---|---|---|
| ALL | 544 | 57.8 (14.3) |
| DEL PEAK 21(10P15.3) CNV | 445 | 59.9 (12.3) |
| DEL PEAK 21(10P15.3) WILD-TYPE | 99 | 48.5 (18.4) |
Figure S8. Get High-res Image Gene #45: 'Del Peak 21(10p15.3)' versus Clinical Feature #2: 'AGE'
P value = 6.7e-06 (logrank test), Q value = 0.0023
Table S9. Gene #46: 'Del Peak 22(10p13)' versus Clinical Feature #1: 'Time to Death'
| nPatients | nDeath | Duration Range (Median), Month | |
|---|---|---|---|
| ALL | 544 | 411 | 0.1 - 127.6 (9.6) |
| DEL PEAK 22(10P13) CNV | 447 | 343 | 0.1 - 92.6 (9.4) |
| DEL PEAK 22(10P13) WILD-TYPE | 97 | 68 | 0.1 - 127.6 (9.8) |
Figure S9. Get High-res Image Gene #46: 'Del Peak 22(10p13)' versus Clinical Feature #1: 'Time to Death'
P value = 2.12e-07 (t-test), Q value = 7.3e-05
Table S10. Gene #46: 'Del Peak 22(10p13)' versus Clinical Feature #2: 'AGE'
| nPatients | Mean (Std.Dev) | |
|---|---|---|
| ALL | 544 | 57.8 (14.3) |
| DEL PEAK 22(10P13) CNV | 447 | 59.8 (12.2) |
| DEL PEAK 22(10P13) WILD-TYPE | 97 | 48.7 (18.9) |
Figure S10. Get High-res Image Gene #46: 'Del Peak 22(10p13)' versus Clinical Feature #2: 'AGE'
P value = 9.14e-07 (logrank test), Q value = 0.00032
Table S11. Gene #47: 'Del Peak 23(10p11.23)' versus Clinical Feature #1: 'Time to Death'
| nPatients | nDeath | Duration Range (Median), Month | |
|---|---|---|---|
| ALL | 544 | 411 | 0.1 - 127.6 (9.6) |
| DEL PEAK 23(10P11.23) CNV | 451 | 345 | 0.1 - 92.6 (9.4) |
| DEL PEAK 23(10P11.23) WILD-TYPE | 93 | 66 | 0.1 - 127.6 (12.4) |
Figure S11. Get High-res Image Gene #47: 'Del Peak 23(10p11.23)' versus Clinical Feature #1: 'Time to Death'
P value = 1.16e-08 (t-test), Q value = 4e-06
Table S12. Gene #47: 'Del Peak 23(10p11.23)' versus Clinical Feature #2: 'AGE'
| nPatients | Mean (Std.Dev) | |
|---|---|---|
| ALL | 544 | 57.8 (14.3) |
| DEL PEAK 23(10P11.23) CNV | 451 | 60.0 (12.1) |
| DEL PEAK 23(10P11.23) WILD-TYPE | 93 | 47.4 (18.8) |
Figure S12. Get High-res Image Gene #47: 'Del Peak 23(10p11.23)' versus Clinical Feature #2: 'AGE'
P value = 2.27e-05 (logrank test), Q value = 0.0077
Table S13. Gene #48: 'Del Peak 24(10q23.31)' versus Clinical Feature #1: 'Time to Death'
| nPatients | nDeath | Duration Range (Median), Month | |
|---|---|---|---|
| ALL | 544 | 411 | 0.1 - 127.6 (9.6) |
| DEL PEAK 24(10Q23.31) CNV | 486 | 372 | 0.1 - 127.6 (9.6) |
| DEL PEAK 24(10Q23.31) WILD-TYPE | 58 | 39 | 0.2 - 108.8 (10.9) |
Figure S13. Get High-res Image Gene #48: 'Del Peak 24(10q23.31)' versus Clinical Feature #1: 'Time to Death'

P value = 2.71e-06 (t-test), Q value = 0.00093
Table S14. Gene #48: 'Del Peak 24(10q23.31)' versus Clinical Feature #2: 'AGE'
| nPatients | Mean (Std.Dev) | |
|---|---|---|
| ALL | 544 | 57.8 (14.3) |
| DEL PEAK 24(10Q23.31) CNV | 486 | 59.2 (13.0) |
| DEL PEAK 24(10Q23.31) WILD-TYPE | 58 | 46.2 (18.7) |
Figure S14. Get High-res Image Gene #48: 'Del Peak 24(10q23.31)' versus Clinical Feature #2: 'AGE'
P value = 2.89e-05 (t-test), Q value = 0.0098
Table S15. Gene #49: 'Del Peak 25(10q26.3)' versus Clinical Feature #2: 'AGE'
| nPatients | Mean (Std.Dev) | |
|---|---|---|
| ALL | 544 | 57.8 (14.3) |
| DEL PEAK 25(10Q26.3) CNV | 487 | 59.0 (13.1) |
| DEL PEAK 25(10Q26.3) WILD-TYPE | 57 | 47.4 (19.0) |
Figure S15. Get High-res Image Gene #49: 'Del Peak 25(10q26.3)' versus Clinical Feature #2: 'AGE'

-
Mutation data file = all_lesions.conf_99.cnv.cluster.txt
-
Clinical data file = GBM-TP.clin.merged.picked.txt
-
Number of patients = 544
-
Number of significantly arm-level cnvs = 70
-
Number of selected clinical features = 5
-
Exclude genes that fewer than K tumors have mutations, K = 3
For survival clinical features, the Kaplan-Meier survival curves of tumors with and without gene mutations were plotted and the statistical significance P values were estimated by logrank test (Bland and Altman 2004) using the 'survdiff' function in R
For continuous numerical clinical features, two-tailed Student's t test with unequal variance (Lehmann and Romano 2005) was applied to compare the clinical values between tumors with and without gene mutations using 't.test' function in R
For binary or multi-class clinical features (nominal or ordinal), two-tailed Fisher's exact tests (Fisher 1922) were used to estimate the P values using the 'fisher.test' function in R
For multiple hypothesis correction, Q value is the False Discovery Rate (FDR) analogue of the P value (Benjamini and Hochberg 1995), defined as the minimum FDR at which the test may be called significant. We used the 'Benjamini and Hochberg' method of 'p.adjust' function in R to convert P values into Q values.
This is an experimental feature. The full results of the analysis summarized in this report can be downloaded from the TCGA Data Coordination Center.