This pipeline computes the correlation between significantly recurrent gene mutations and selected clinical features.
Testing the association between mutation status of 110 genes and 5 clinical features across 269 patients, 5 significant findings detected with Q value < 0.25.
-
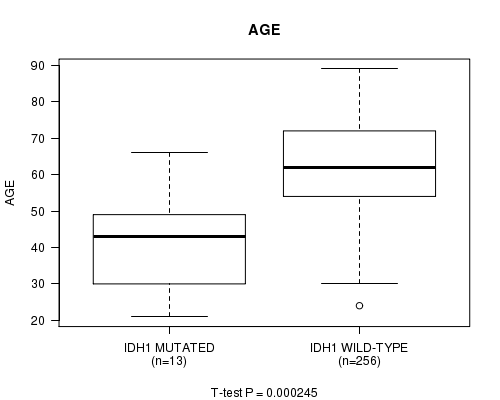
IDH1 mutation correlated to 'AGE'.
-
PRB2 mutation correlated to 'KARNOFSKY.PERFORMANCE.SCORE'.
-
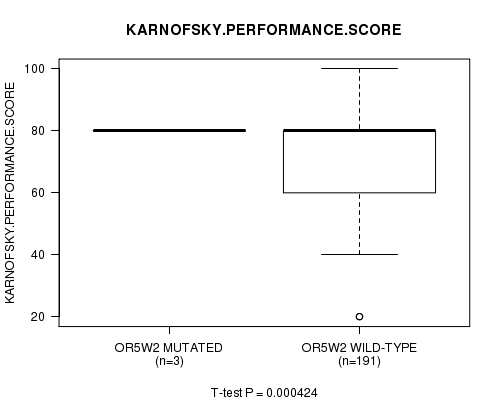
OR5W2 mutation correlated to 'KARNOFSKY.PERFORMANCE.SCORE'.
-
OR5P2 mutation correlated to 'KARNOFSKY.PERFORMANCE.SCORE'.
-
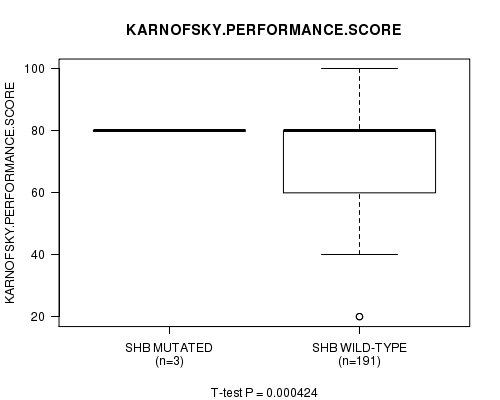
SHB mutation correlated to 'KARNOFSKY.PERFORMANCE.SCORE'.
Table 1. Get Full Table Overview of the association between mutation status of 110 genes and 5 clinical features. Shown in the table are P values (Q values). Thresholded by Q value < 0.25, 5 significant findings detected.
|
Clinical Features |
Time to Death |
AGE | GENDER |
KARNOFSKY PERFORMANCE SCORE |
RADIATIONS RADIATION REGIMENINDICATION |
||
| nMutated (%) | nWild-Type | logrank test | t-test | Fisher's exact test | t-test | Fisher's exact test | |
| IDH1 | 13 (5%) | 256 |
0.00204 (1.00) |
0.000245 (0.131) |
0.386 (1.00) |
0.0655 (1.00) |
0.00514 (1.00) |
| PRB2 | 5 (2%) | 264 |
0.918 (1.00) |
0.167 (1.00) |
1 (1.00) |
0.000423 (0.226) |
1 (1.00) |
| OR5W2 | 5 (2%) | 264 |
0.394 (1.00) |
0.0763 (1.00) |
1 (1.00) |
0.000424 (0.226) |
0.166 (1.00) |
| OR5P2 | 4 (1%) | 265 |
0.265 (1.00) |
0.12 (1.00) |
0.3 (1.00) |
0.000423 (0.226) |
0.613 (1.00) |
| SHB | 3 (1%) | 266 |
0.978 (1.00) |
0.621 (1.00) |
0.301 (1.00) |
0.000424 (0.226) |
0.554 (1.00) |
| PIK3R1 | 31 (12%) | 238 |
0.747 (1.00) |
0.596 (1.00) |
0.431 (1.00) |
0.872 (1.00) |
0.551 (1.00) |
| BRAF | 4 (1%) | 265 |
0.242 (1.00) |
0.198 (1.00) |
1 (1.00) |
0.158 (1.00) |
0.124 (1.00) |
| EGFR | 72 (27%) | 197 |
0.791 (1.00) |
0.485 (1.00) |
0.254 (1.00) |
0.512 (1.00) |
0.665 (1.00) |
| PTEN | 85 (32%) | 184 |
0.632 (1.00) |
0.195 (1.00) |
0.588 (1.00) |
0.98 (1.00) |
0.0542 (1.00) |
| TP53 | 77 (29%) | 192 |
0.0321 (1.00) |
0.159 (1.00) |
0.674 (1.00) |
0.00657 (1.00) |
0.322 (1.00) |
| PIK3CA | 28 (10%) | 241 |
0.577 (1.00) |
0.854 (1.00) |
0.836 (1.00) |
0.98 (1.00) |
0.534 (1.00) |
| RB1 | 22 (8%) | 247 |
0.104 (1.00) |
0.822 (1.00) |
0.818 (1.00) |
0.0179 (1.00) |
0.492 (1.00) |
| NF1 | 28 (10%) | 241 |
0.845 (1.00) |
0.289 (1.00) |
1 (1.00) |
0.18 (1.00) |
0.677 (1.00) |
| SPTA1 | 26 (10%) | 243 |
0.533 (1.00) |
0.176 (1.00) |
0.29 (1.00) |
0.469 (1.00) |
0.279 (1.00) |
| KRTAP4-11 | 9 (3%) | 260 |
0.627 (1.00) |
0.406 (1.00) |
0.728 (1.00) |
0.818 (1.00) |
0.724 (1.00) |
| GABRA6 | 11 (4%) | 258 |
0.912 (1.00) |
0.22 (1.00) |
1 (1.00) |
0.607 (1.00) |
1 (1.00) |
| KEL | 15 (6%) | 254 |
0.512 (1.00) |
0.404 (1.00) |
0.417 (1.00) |
0.0925 (1.00) |
0.404 (1.00) |
| CDH18 | 11 (4%) | 258 |
0.379 (1.00) |
0.527 (1.00) |
1 (1.00) |
0.567 (1.00) |
0.523 (1.00) |
| RPL5 | 7 (3%) | 262 |
0.994 (1.00) |
0.784 (1.00) |
0.261 (1.00) |
0.558 (1.00) |
0.427 (1.00) |
| SEMA3C | 11 (4%) | 258 |
0.0541 (1.00) |
0.959 (1.00) |
0.751 (1.00) |
0.77 (1.00) |
0.2 (1.00) |
| TPTE2 | 8 (3%) | 261 |
0.256 (1.00) |
0.585 (1.00) |
1 (1.00) |
0.0232 (1.00) |
0.456 (1.00) |
| ZNF844 | 6 (2%) | 263 |
0.579 (1.00) |
0.821 (1.00) |
0.195 (1.00) |
0.872 (1.00) |
1 (1.00) |
| OR8K3 | 6 (2%) | 263 |
0.695 (1.00) |
0.904 (1.00) |
0.421 (1.00) |
0.544 (1.00) |
0.668 (1.00) |
| OR5AR1 | 6 (2%) | 263 |
0.426 (1.00) |
0.0071 (1.00) |
0.671 (1.00) |
0.0605 (1.00) |
0.424 (1.00) |
| STAG2 | 12 (4%) | 257 |
0.0148 (1.00) |
0.949 (1.00) |
0.763 (1.00) |
0.0956 (1.00) |
0.353 (1.00) |
| SEMG1 | 8 (3%) | 261 |
0.941 (1.00) |
0.142 (1.00) |
0.715 (1.00) |
0.33 (1.00) |
0.132 (1.00) |
| CDC27 | 5 (2%) | 264 |
0.209 (1.00) |
0.69 (1.00) |
0.358 (1.00) |
1 (1.00) |
|
| PDGFRA | 11 (4%) | 258 |
0.59 (1.00) |
0.0282 (1.00) |
1 (1.00) |
0.719 (1.00) |
0.523 (1.00) |
| ADAM29 | 9 (3%) | 260 |
0.668 (1.00) |
0.0551 (1.00) |
0.162 (1.00) |
0.825 (1.00) |
0.502 (1.00) |
| SULT1B1 | 6 (2%) | 263 |
0.0779 (1.00) |
0.984 (1.00) |
1 (1.00) |
0.825 (1.00) |
1 (1.00) |
| ABCC9 | 11 (4%) | 258 |
0.968 (1.00) |
0.267 (1.00) |
0.216 (1.00) |
0.52 (1.00) |
0.523 (1.00) |
| NLRP5 | 12 (4%) | 257 |
0.334 (1.00) |
0.964 (1.00) |
0.545 (1.00) |
0.0655 (1.00) |
1 (1.00) |
| LZTR1 | 10 (4%) | 259 |
0.705 (1.00) |
0.285 (1.00) |
0.0989 (1.00) |
0.77 (1.00) |
0.326 (1.00) |
| CALCR | 7 (3%) | 262 |
0.0298 (1.00) |
0.0162 (1.00) |
1 (1.00) |
0.718 (1.00) |
1 (1.00) |
| QKI | 5 (2%) | 264 |
0.92 (1.00) |
0.813 (1.00) |
1 (1.00) |
0.527 (1.00) |
0.0521 (1.00) |
| ZPBP | 5 (2%) | 264 |
0.35 (1.00) |
0.994 (1.00) |
0.358 (1.00) |
0.872 (1.00) |
0.347 (1.00) |
| PSPH | 5 (2%) | 264 |
0.207 (1.00) |
0.374 (1.00) |
0.656 (1.00) |
0.932 (1.00) |
0.661 (1.00) |
| UGT2A3 | 6 (2%) | 263 |
0.969 (1.00) |
0.841 (1.00) |
1 (1.00) |
0.872 (1.00) |
0.0945 (1.00) |
| WNT2 | 5 (2%) | 264 |
0.36 (1.00) |
0.244 (1.00) |
0.0606 (1.00) |
0.685 (1.00) |
1 (1.00) |
| OR5D18 | 6 (2%) | 263 |
0.174 (1.00) |
0.716 (1.00) |
0.671 (1.00) |
0.179 (1.00) |
1 (1.00) |
| ABCB1 | 10 (4%) | 259 |
0.498 (1.00) |
0.11 (1.00) |
0.177 (1.00) |
0.455 (1.00) |
0.326 (1.00) |
| COL1A2 | 10 (4%) | 259 |
0.751 (1.00) |
0.108 (1.00) |
1 (1.00) |
0.983 (1.00) |
0.326 (1.00) |
| ATRX | 15 (6%) | 254 |
0.045 (1.00) |
0.000576 (0.305) |
0.417 (1.00) |
0.0429 (1.00) |
0.0945 (1.00) |
| C1ORF150 | 3 (1%) | 266 |
0.67 (1.00) |
0.0936 (1.00) |
1 (1.00) |
0.24 (1.00) |
1 (1.00) |
| LRRC55 | 6 (2%) | 263 |
0.0165 (1.00) |
0.518 (1.00) |
0.671 (1.00) |
0.0451 (1.00) |
1 (1.00) |
| DCAF12L2 | 8 (3%) | 261 |
0.536 (1.00) |
0.691 (1.00) |
0.265 (1.00) |
0.713 (1.00) |
1 (1.00) |
| LRFN5 | 7 (3%) | 262 |
0.0282 (1.00) |
0.412 (1.00) |
0.261 (1.00) |
0.331 (1.00) |
0.00817 (1.00) |
| LUM | 4 (1%) | 265 |
0.0891 (1.00) |
0.845 (1.00) |
1 (1.00) |
0.752 (1.00) |
0.613 (1.00) |
| MMP13 | 6 (2%) | 263 |
0.608 (1.00) |
0.157 (1.00) |
1 (1.00) |
0.0258 (1.00) |
0.0945 (1.00) |
| HEATR7B2 | 11 (4%) | 258 |
0.885 (1.00) |
0.0614 (1.00) |
0.751 (1.00) |
0.979 (1.00) |
0.2 (1.00) |
| UGT2B28 | 6 (2%) | 263 |
0.774 (1.00) |
0.828 (1.00) |
0.421 (1.00) |
0.804 (1.00) |
1 (1.00) |
| OR5D13 | 5 (2%) | 264 |
0.461 (1.00) |
0.427 (1.00) |
0.656 (1.00) |
0.661 (1.00) |
|
| ZNF99 | 6 (2%) | 263 |
0.752 (1.00) |
0.759 (1.00) |
0.421 (1.00) |
0.824 (1.00) |
1 (1.00) |
| SLC5A7 | 6 (2%) | 263 |
0.128 (1.00) |
0.675 (1.00) |
0.421 (1.00) |
0.33 (1.00) |
1 (1.00) |
| SEMA3E | 7 (3%) | 262 |
0.396 (1.00) |
0.661 (1.00) |
1 (1.00) |
0.544 (1.00) |
0.1 (1.00) |
| TCHH | 16 (6%) | 253 |
0.351 (1.00) |
0.337 (1.00) |
0.427 (1.00) |
0.472 (1.00) |
0.188 (1.00) |
| SLC26A3 | 6 (2%) | 263 |
0.497 (1.00) |
0.345 (1.00) |
0.421 (1.00) |
0.544 (1.00) |
0.668 (1.00) |
| GABRB2 | 6 (2%) | 263 |
0.274 (1.00) |
0.0308 (1.00) |
0.195 (1.00) |
0.372 (1.00) |
0.188 (1.00) |
| CFHR4 | 5 (2%) | 264 |
0.371 (1.00) |
0.996 (1.00) |
0.358 (1.00) |
0.977 (1.00) |
1 (1.00) |
| IL18RAP | 5 (2%) | 264 |
0.778 (1.00) |
0.195 (1.00) |
0.358 (1.00) |
0.294 (1.00) |
0.661 (1.00) |
| OGDH | 3 (1%) | 266 |
0.245 (1.00) |
0.317 (1.00) |
1 (1.00) |
0.297 (1.00) |
1 (1.00) |
| PCDH11X | 8 (3%) | 261 |
0.0982 (1.00) |
0.161 (1.00) |
0.468 (1.00) |
0.0237 (1.00) |
0.132 (1.00) |
| SPRYD5 | 6 (2%) | 263 |
0.8 (1.00) |
0.821 (1.00) |
0.671 (1.00) |
0.544 (1.00) |
1 (1.00) |
| TGFA | 4 (1%) | 265 |
0.907 (1.00) |
0.378 (1.00) |
0.139 (1.00) |
1 (1.00) |
|
| UGT2B4 | 5 (2%) | 264 |
0.348 (1.00) |
0.656 (1.00) |
0.656 (1.00) |
0.138 (1.00) |
0.347 (1.00) |
| FOXR2 | 5 (2%) | 264 |
0.202 (1.00) |
0.957 (1.00) |
1 (1.00) |
0.872 (1.00) |
1 (1.00) |
| PSG8 | 6 (2%) | 263 |
0.277 (1.00) |
0.479 (1.00) |
0.195 (1.00) |
0.865 (1.00) |
0.424 (1.00) |
| CNTNAP2 | 12 (4%) | 257 |
0.818 (1.00) |
0.143 (1.00) |
0.364 (1.00) |
0.157 (1.00) |
1 (1.00) |
| PIK3C2G | 9 (3%) | 260 |
0.124 (1.00) |
0.411 (1.00) |
0.293 (1.00) |
0.544 (1.00) |
0.285 (1.00) |
| SCN9A | 11 (4%) | 258 |
0.0299 (1.00) |
0.26 (1.00) |
0.751 (1.00) |
0.255 (1.00) |
0.2 (1.00) |
| GABRA1 | 5 (2%) | 264 |
0.788 (1.00) |
0.913 (1.00) |
0.656 (1.00) |
0.24 (1.00) |
1 (1.00) |
| DYNC1I1 | 7 (3%) | 262 |
0.0997 (1.00) |
0.429 (1.00) |
1 (1.00) |
0.0853 (1.00) |
0.698 (1.00) |
| PODXL | 3 (1%) | 266 |
0.355 (1.00) |
0.224 (1.00) |
0.301 (1.00) |
0.126 (1.00) |
0.554 (1.00) |
| HCN1 | 10 (4%) | 259 |
0.179 (1.00) |
0.837 (1.00) |
1 (1.00) |
0.158 (1.00) |
0.103 (1.00) |
| POTEF | 5 (2%) | 264 |
0.969 (1.00) |
0.702 (1.00) |
1 (1.00) |
1 (1.00) |
|
| CXORF22 | 8 (3%) | 261 |
0.903 (1.00) |
0.548 (1.00) |
0.145 (1.00) |
0.455 (1.00) |
0.268 (1.00) |
| AFM | 6 (2%) | 263 |
0.277 (1.00) |
0.407 (1.00) |
0.671 (1.00) |
0.378 (1.00) |
1 (1.00) |
| KRTAP20-2 | 3 (1%) | 266 |
0.519 (1.00) |
0.338 (1.00) |
1 (1.00) |
0.554 (1.00) |
|
| OTC | 3 (1%) | 266 |
0.123 (1.00) |
0.764 (1.00) |
0.301 (1.00) |
0.28 (1.00) |
|
| TRAT1 | 4 (1%) | 265 |
0.141 (1.00) |
0.471 (1.00) |
1 (1.00) |
0.613 (1.00) |
|
| KLK6 | 3 (1%) | 266 |
0.241 (1.00) |
0.221 (1.00) |
0.301 (1.00) |
0.554 (1.00) |
|
| OR4D5 | 4 (1%) | 265 |
0.654 (1.00) |
0.0843 (1.00) |
0.3 (1.00) |
0.837 (1.00) |
0.124 (1.00) |
| GPX5 | 3 (1%) | 266 |
0.356 (1.00) |
0.232 (1.00) |
1 (1.00) |
0.554 (1.00) |
|
| KRTAP4-7 | 3 (1%) | 266 |
0.459 (1.00) |
0.317 (1.00) |
0.556 (1.00) |
0.28 (1.00) |
|
| CDH9 | 8 (3%) | 261 |
0.534 (1.00) |
0.579 (1.00) |
0.468 (1.00) |
0.482 (1.00) |
1 (1.00) |
| CDHR3 | 3 (1%) | 266 |
0.264 (1.00) |
0.553 (1.00) |
1 (1.00) |
0.294 (1.00) |
0.554 (1.00) |
| OR4P4 | 4 (1%) | 265 |
0.952 (1.00) |
0.364 (1.00) |
1 (1.00) |
1 (1.00) |
|
| OR52M1 | 4 (1%) | 265 |
0.969 (1.00) |
0.465 (1.00) |
1 (1.00) |
0.752 (1.00) |
1 (1.00) |
| KLF17 | 5 (2%) | 264 |
0.00262 (1.00) |
0.306 (1.00) |
0.162 (1.00) |
0.469 (1.00) |
1 (1.00) |
| OR8J3 | 4 (1%) | 265 |
0.384 (1.00) |
0.573 (1.00) |
0.624 (1.00) |
0.644 (1.00) |
0.301 (1.00) |
| AP3S1 | 3 (1%) | 266 |
0.239 (1.00) |
0.348 (1.00) |
0.556 (1.00) |
0.24 (1.00) |
0.554 (1.00) |
| ST6GAL2 | 5 (2%) | 264 |
0.884 (1.00) |
0.342 (1.00) |
0.0606 (1.00) |
0.0858 (1.00) |
0.661 (1.00) |
| CD3EAP | 3 (1%) | 266 |
0.857 (1.00) |
0.668 (1.00) |
1 (1.00) |
0.738 (1.00) |
1 (1.00) |
| F9 | 4 (1%) | 265 |
0.0233 (1.00) |
0.541 (1.00) |
0.624 (1.00) |
1 (1.00) |
|
| DPP10 | 7 (3%) | 262 |
0.585 (1.00) |
0.442 (1.00) |
0.261 (1.00) |
0.24 (1.00) |
1 (1.00) |
| TCN1 | 4 (1%) | 265 |
0.907 (1.00) |
0.322 (1.00) |
0.624 (1.00) |
0.124 (1.00) |
|
| TRPV6 | 7 (3%) | 262 |
0.822 (1.00) |
0.0725 (1.00) |
0.708 (1.00) |
0.825 (1.00) |
0.1 (1.00) |
| PAN3 | 6 (2%) | 263 |
0.289 (1.00) |
0.462 (1.00) |
1 (1.00) |
0.777 (1.00) |
0.668 (1.00) |
| CDKN2C | 3 (1%) | 266 |
0.733 (1.00) |
0.559 (1.00) |
0.556 (1.00) |
1 (1.00) |
|
| AZGP1 | 4 (1%) | 265 |
0.643 (1.00) |
0.822 (1.00) |
1 (1.00) |
1 (1.00) |
|
| DRD5 | 7 (3%) | 262 |
0.63 (1.00) |
0.241 (1.00) |
1 (1.00) |
0.294 (1.00) |
1 (1.00) |
| FGA | 6 (2%) | 263 |
0.927 (1.00) |
0.369 (1.00) |
0.0893 (1.00) |
0.372 (1.00) |
0.668 (1.00) |
| FGG | 5 (2%) | 264 |
0.41 (1.00) |
0.074 (1.00) |
0.358 (1.00) |
0.294 (1.00) |
0.661 (1.00) |
| OR10G8 | 4 (1%) | 265 |
0.877 (1.00) |
0.262 (1.00) |
0.624 (1.00) |
0.872 (1.00) |
0.613 (1.00) |
| PCMTD1 | 3 (1%) | 266 |
0.874 (1.00) |
0.672 (1.00) |
0.556 (1.00) |
0.556 (1.00) |
0.554 (1.00) |
| PROKR2 | 6 (2%) | 263 |
0.46 (1.00) |
0.0205 (1.00) |
1 (1.00) |
0.992 (1.00) |
0.668 (1.00) |
| CYP3A5 | 5 (2%) | 264 |
0.349 (1.00) |
0.715 (1.00) |
0.358 (1.00) |
0.378 (1.00) |
1 (1.00) |
| FRMD7 | 6 (2%) | 263 |
0.716 (1.00) |
0.583 (1.00) |
1 (1.00) |
0.908 (1.00) |
1 (1.00) |
| KCNB2 | 5 (2%) | 264 |
0.357 (1.00) |
0.666 (1.00) |
0.358 (1.00) |
0.0521 (1.00) |
|
| KDR | 7 (3%) | 262 |
0.352 (1.00) |
0.775 (1.00) |
0.428 (1.00) |
0.877 (1.00) |
0.427 (1.00) |
P value = 0.000245 (t-test), Q value = 0.13
Table S1. Gene #4: 'IDH1 MUTATION STATUS' versus Clinical Feature #2: 'AGE'
| nPatients | Mean (Std.Dev) | |
|---|---|---|
| ALL | 269 | 61.2 (12.6) |
| IDH1 MUTATED | 13 | 41.5 (14.7) |
| IDH1 WILD-TYPE | 256 | 62.2 (11.6) |
Figure S1. Get High-res Image Gene #4: 'IDH1 MUTATION STATUS' versus Clinical Feature #2: 'AGE'
P value = 0.000423 (t-test), Q value = 0.23
Table S2. Gene #15: 'PRB2 MUTATION STATUS' versus Clinical Feature #4: 'KARNOFSKY.PERFORMANCE.SCORE'
| nPatients | Mean (Std.Dev) | |
|---|---|---|
| ALL | 194 | 75.9 (16.0) |
| PRB2 MUTATED | 4 | 80.0 (0.0) |
| PRB2 WILD-TYPE | 190 | 75.8 (16.2) |
Figure S2. Get High-res Image Gene #15: 'PRB2 MUTATION STATUS' versus Clinical Feature #4: 'KARNOFSKY.PERFORMANCE.SCORE'

P value = 0.000424 (t-test), Q value = 0.23
Table S3. Gene #38: 'OR5W2 MUTATION STATUS' versus Clinical Feature #4: 'KARNOFSKY.PERFORMANCE.SCORE'
| nPatients | Mean (Std.Dev) | |
|---|---|---|
| ALL | 194 | 75.9 (16.0) |
| OR5W2 MUTATED | 3 | 80.0 (0.0) |
| OR5W2 WILD-TYPE | 191 | 75.8 (16.1) |
Figure S3. Get High-res Image Gene #38: 'OR5W2 MUTATION STATUS' versus Clinical Feature #4: 'KARNOFSKY.PERFORMANCE.SCORE'
P value = 0.000423 (t-test), Q value = 0.23
Table S4. Gene #63: 'OR5P2 MUTATION STATUS' versus Clinical Feature #4: 'KARNOFSKY.PERFORMANCE.SCORE'
| nPatients | Mean (Std.Dev) | |
|---|---|---|
| ALL | 194 | 75.9 (16.0) |
| OR5P2 MUTATED | 4 | 80.0 (0.0) |
| OR5P2 WILD-TYPE | 190 | 75.8 (16.2) |
Figure S4. Get High-res Image Gene #63: 'OR5P2 MUTATION STATUS' versus Clinical Feature #4: 'KARNOFSKY.PERFORMANCE.SCORE'

P value = 0.000424 (t-test), Q value = 0.23
Table S5. Gene #106: 'SHB MUTATION STATUS' versus Clinical Feature #4: 'KARNOFSKY.PERFORMANCE.SCORE'
| nPatients | Mean (Std.Dev) | |
|---|---|---|
| ALL | 194 | 75.9 (16.0) |
| SHB MUTATED | 3 | 80.0 (0.0) |
| SHB WILD-TYPE | 191 | 75.8 (16.1) |
Figure S5. Get High-res Image Gene #106: 'SHB MUTATION STATUS' versus Clinical Feature #4: 'KARNOFSKY.PERFORMANCE.SCORE'
-
Mutation data file = GBM-TP.mutsig.cluster.txt
-
Clinical data file = GBM-TP.clin.merged.picked.txt
-
Number of patients = 269
-
Number of significantly mutated genes = 110
-
Number of selected clinical features = 5
-
Exclude genes that fewer than K tumors have mutations, K = 3
For survival clinical features, the Kaplan-Meier survival curves of tumors with and without gene mutations were plotted and the statistical significance P values were estimated by logrank test (Bland and Altman 2004) using the 'survdiff' function in R
For continuous numerical clinical features, two-tailed Student's t test with unequal variance (Lehmann and Romano 2005) was applied to compare the clinical values between tumors with and without gene mutations using 't.test' function in R
For binary or multi-class clinical features (nominal or ordinal), two-tailed Fisher's exact tests (Fisher 1922) were used to estimate the P values using the 'fisher.test' function in R
For multiple hypothesis correction, Q value is the False Discovery Rate (FDR) analogue of the P value (Benjamini and Hochberg 1995), defined as the minimum FDR at which the test may be called significant. We used the 'Benjamini and Hochberg' method of 'p.adjust' function in R to convert P values into Q values.
This is an experimental feature. The full results of the analysis summarized in this report can be downloaded from the TCGA Data Coordination Center.