This pipeline computes the correlation between significant copy number variation (cnv focal) genes and selected clinical features.
Testing the association between copy number variation 30 arm-level results and 8 clinical features across 493 patients, 26 significant findings detected with Q value < 0.25.
-
Amp Peak 3(3q26.32) cnv correlated to 'PATHOLOGY.T', 'PATHOLOGICSPREAD(M)', and 'TUMOR.STAGE'.
-
Amp Peak 7(8q24.22) cnv correlated to 'PATHOLOGY.T'.
-
Del Peak 6(3p21.32) cnv correlated to 'PATHOLOGY.T' and 'TUMOR.STAGE'.
-
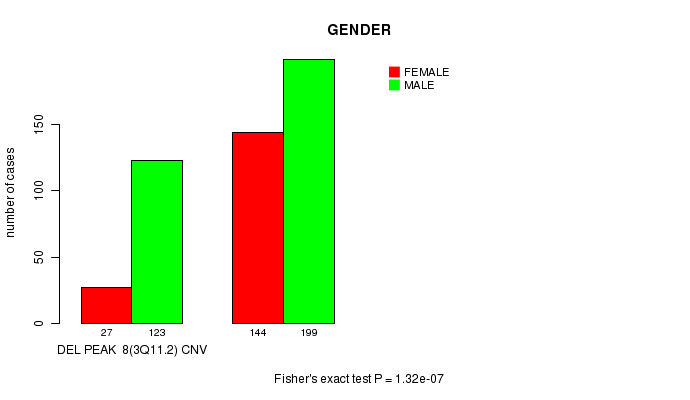
Del Peak 8(3q11.2) cnv correlated to 'GENDER'.
-
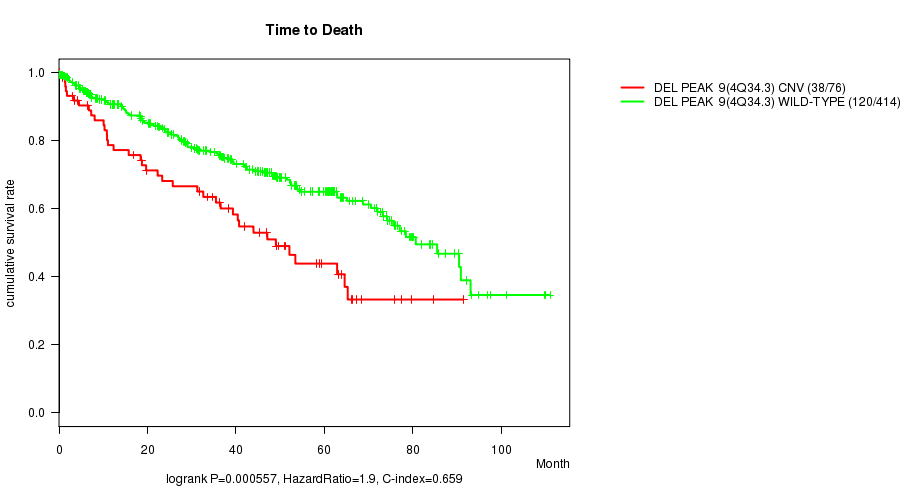
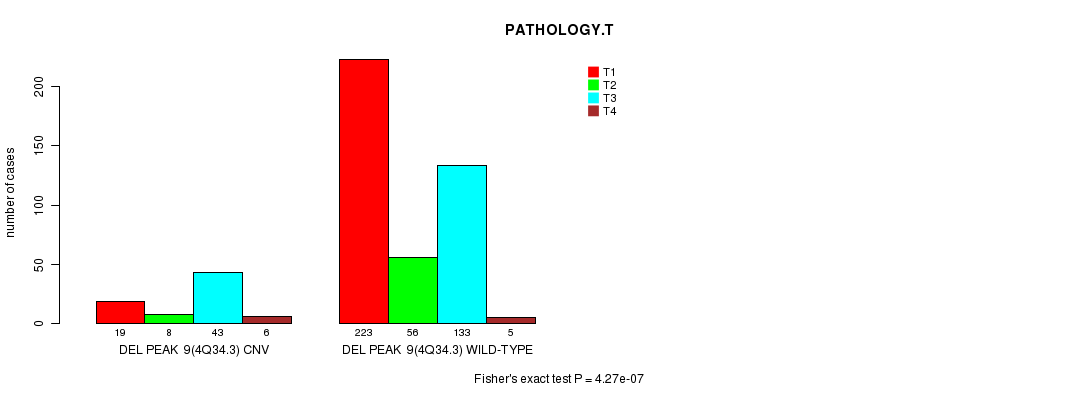
Del Peak 9(4q34.3) cnv correlated to 'Time to Death', 'PATHOLOGY.T', and 'TUMOR.STAGE'.
-
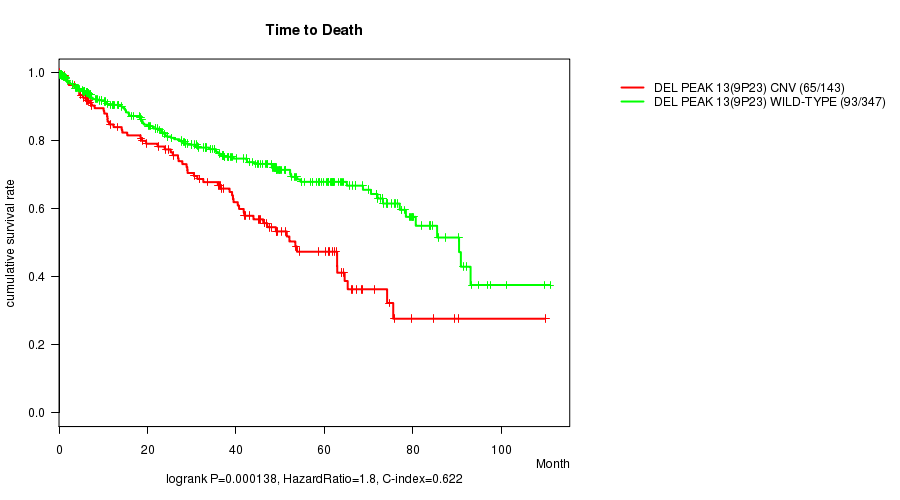
Del Peak 13(9p23) cnv correlated to 'Time to Death', 'PATHOLOGY.T', 'PATHOLOGICSPREAD(M)', and 'TUMOR.STAGE'.
-
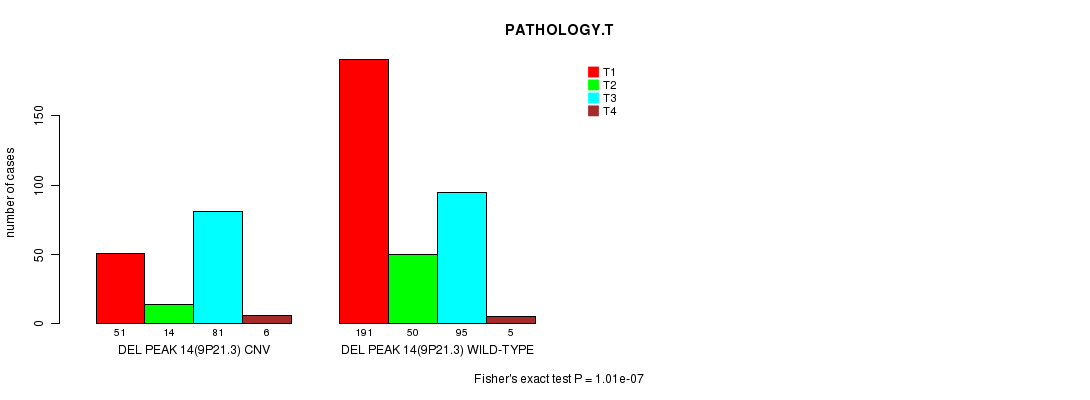
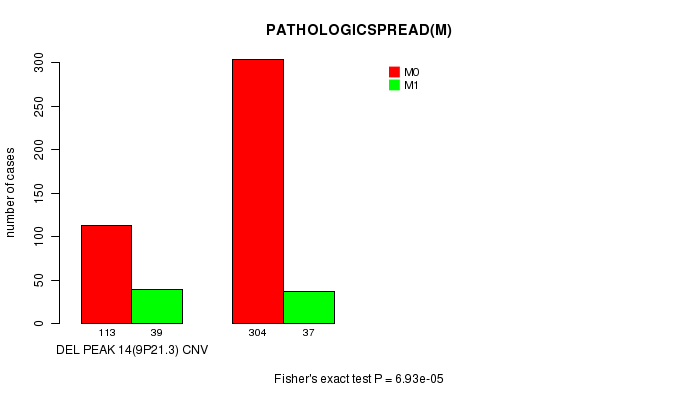
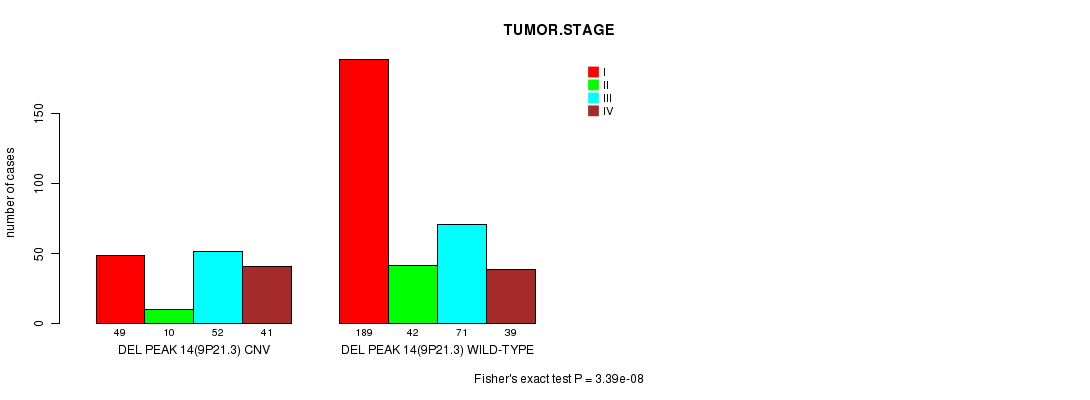
Del Peak 14(9p21.3) cnv correlated to 'Time to Death', 'PATHOLOGY.T', 'PATHOLOGICSPREAD(M)', and 'TUMOR.STAGE'.
-
Del Peak 15(10q23.31) cnv correlated to 'PATHOLOGY.T'.
-
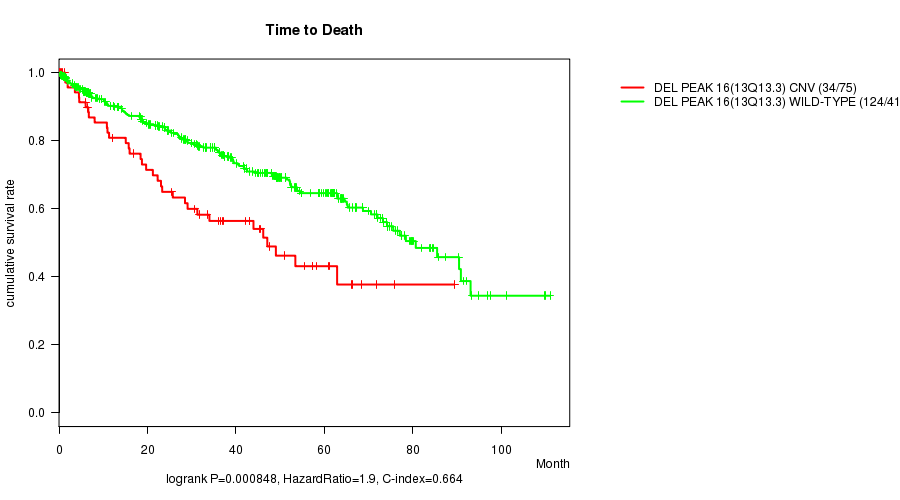
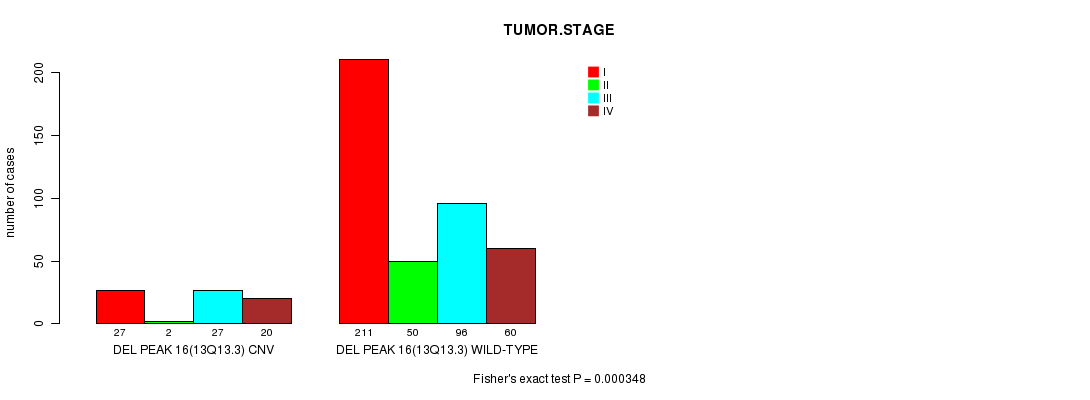
Del Peak 16(13q13.3) cnv correlated to 'Time to Death', 'PATHOLOGY.T', and 'TUMOR.STAGE'.
-
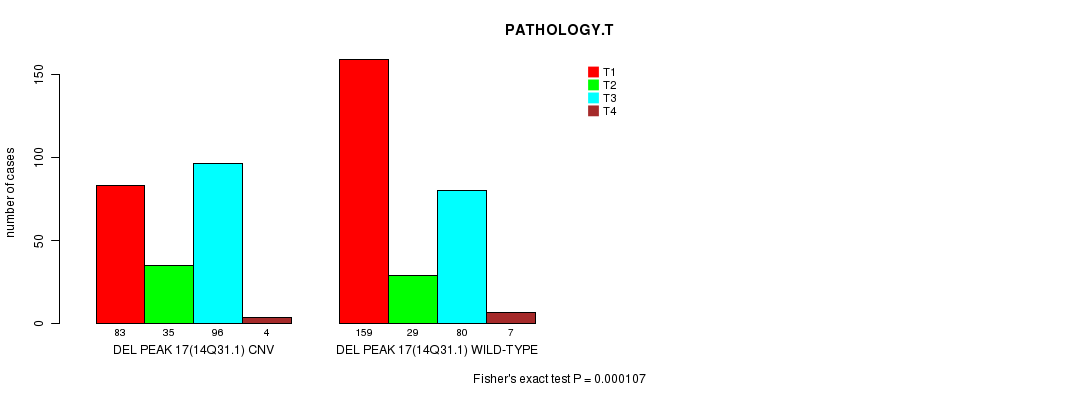
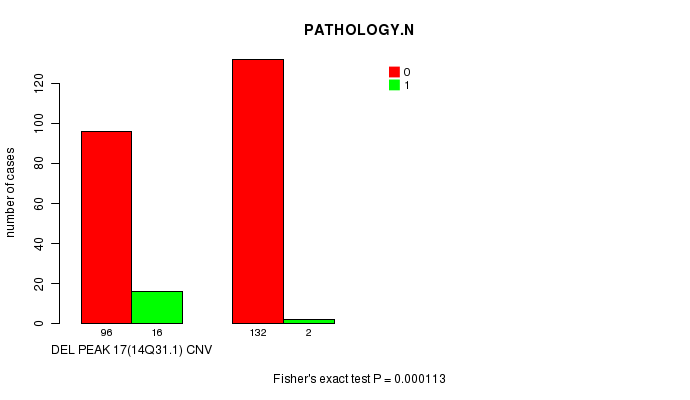
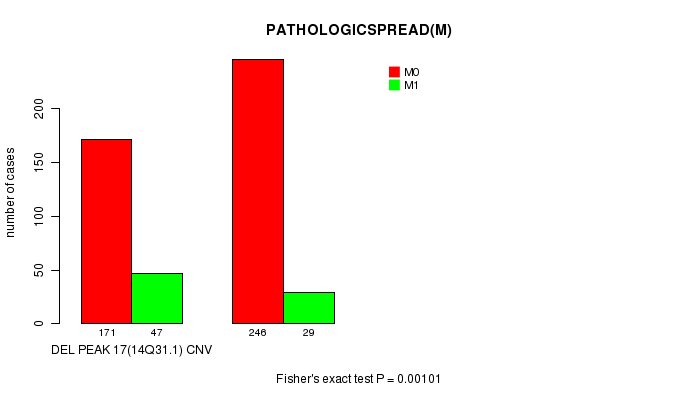
Del Peak 17(14q31.1) cnv correlated to 'PATHOLOGY.T', 'PATHOLOGY.N', 'PATHOLOGICSPREAD(M)', and 'TUMOR.STAGE'.
Table 1. Get Full Table Overview of the association between significant copy number variation of 30 arm-level results and 8 clinical features. Shown in the table are P values (Q values). Thresholded by Q value < 0.25, 26 significant findings detected.
|
Clinical Features |
Time to Death |
AGE | GENDER |
KARNOFSKY PERFORMANCE SCORE |
PATHOLOGY T |
PATHOLOGY N |
PATHOLOGICSPREAD(M) |
TUMOR STAGE |
||
| nCNV (%) | nWild-Type | logrank test | t-test | Fisher's exact test | t-test | Fisher's exact test | Fisher's exact test | Fisher's exact test | Fisher's exact test | |
| Del Peak 13(9p23) | 0 (0%) | 349 |
0.000138 (0.0304) |
0.0136 (1.00) |
0.00361 (0.744) |
0.656 (1.00) |
1.39e-05 (0.0032) |
0.262 (1.00) |
0.000876 (0.187) |
5.62e-06 (0.0013) |
| Del Peak 14(9p21 3) | 0 (0%) | 341 |
2.03e-06 (0.000473) |
0.0261 (1.00) |
0.00144 (0.303) |
0.656 (1.00) |
1.01e-07 (2.4e-05) |
0.0589 (1.00) |
6.93e-05 (0.0156) |
3.39e-08 (8.03e-06) |
| Del Peak 17(14q31 1) | 0 (0%) | 275 |
0.00179 (0.374) |
0.055 (1.00) |
0.393 (1.00) |
0.0872 (1.00) |
0.000107 (0.0238) |
0.000113 (0.0249) |
0.00101 (0.216) |
2.42e-05 (0.00553) |
| Amp Peak 3(3q26 32) | 0 (0%) | 413 |
0.156 (1.00) |
0.903 (1.00) |
0.442 (1.00) |
0.152 (1.00) |
0.000107 (0.0238) |
0.0593 (1.00) |
7.09e-05 (0.0159) |
2.55e-05 (0.00579) |
| Del Peak 9(4q34 3) | 0 (0%) | 417 |
0.000557 (0.12) |
0.568 (1.00) |
0.433 (1.00) |
0.0261 (1.00) |
4.27e-07 (9.98e-05) |
1 (1.00) |
0.00862 (1.00) |
2.7e-06 (0.000626) |
| Del Peak 16(13q13 3) | 0 (0%) | 417 |
0.000848 (0.182) |
0.884 (1.00) |
0.794 (1.00) |
0.748 (1.00) |
1.48e-05 (0.0034) |
0.325 (1.00) |
0.0377 (1.00) |
0.000348 (0.0762) |
| Del Peak 6(3p21 32) | 0 (0%) | 58 |
0.498 (1.00) |
0.704 (1.00) |
0.772 (1.00) |
0.0817 (1.00) |
3.34e-05 (0.00756) |
1 (1.00) |
0.333 (1.00) |
0.00053 (0.115) |
| Amp Peak 7(8q24 22) | 0 (0%) | 420 |
0.0527 (1.00) |
0.0214 (1.00) |
0.11 (1.00) |
0.297 (1.00) |
0.00112 (0.237) |
0.74 (1.00) |
0.053 (1.00) |
0.00241 (0.5) |
| Del Peak 8(3q11 2) | 0 (0%) | 343 |
0.635 (1.00) |
0.0111 (1.00) |
1.32e-07 (3.1e-05) |
0.749 (1.00) |
0.134 (1.00) |
0.787 (1.00) |
0.591 (1.00) |
0.45 (1.00) |
| Del Peak 15(10q23 31) | 0 (0%) | 403 |
0.217 (1.00) |
0.209 (1.00) |
0.0272 (1.00) |
0.764 (1.00) |
0.000477 (0.104) |
1 (1.00) |
0.333 (1.00) |
0.0177 (1.00) |
| Amp Peak 1(1q24 1) | 0 (0%) | 433 |
0.2 (1.00) |
0.164 (1.00) |
0.666 (1.00) |
0.499 (1.00) |
0.157 (1.00) |
0.0751 (1.00) |
0.339 (1.00) |
0.298 (1.00) |
| Amp Peak 2(1q32 1) | 0 (0%) | 434 |
0.437 (1.00) |
0.0725 (1.00) |
0.771 (1.00) |
0.499 (1.00) |
0.164 (1.00) |
0.482 (1.00) |
0.703 (1.00) |
0.24 (1.00) |
| Amp Peak 4(4q32 1) | 0 (0%) | 479 |
0.0584 (1.00) |
0.416 (1.00) |
0.258 (1.00) |
0.411 (1.00) |
0.265 (1.00) |
0.574 (1.00) |
0.462 (1.00) |
0.415 (1.00) |
| Amp Peak 5(5q35 1) | 0 (0%) | 182 |
0.0454 (1.00) |
0.0923 (1.00) |
0.141 (1.00) |
0.944 (1.00) |
0.295 (1.00) |
0.31 (1.00) |
0.366 (1.00) |
0.629 (1.00) |
| Amp Peak 6(7q36 3) | 0 (0%) | 330 |
0.724 (1.00) |
0.806 (1.00) |
0.0352 (1.00) |
0.57 (1.00) |
0.0563 (1.00) |
0.443 (1.00) |
0.00523 (1.00) |
0.0202 (1.00) |
| Amp Peak 8(10p14) | 0 (0%) | 477 |
0.234 (1.00) |
0.423 (1.00) |
0.594 (1.00) |
0.887 (1.00) |
0.013 (1.00) |
0.188 (1.00) |
0.288 (1.00) |
0.0494 (1.00) |
| Amp Peak 9(17q24 3) | 0 (0%) | 456 |
0.0512 (1.00) |
0.0662 (1.00) |
0.858 (1.00) |
0.471 (1.00) |
0.482 (1.00) |
0.359 (1.00) |
0.244 (1.00) |
0.857 (1.00) |
| Amp Peak 10(Xp22 2) | 0 (0%) | 458 |
0.468 (1.00) |
0.676 (1.00) |
0.854 (1.00) |
0.726 (1.00) |
0.0837 (1.00) |
0.668 (1.00) |
0.0897 (1.00) |
0.0108 (1.00) |
| Amp Peak 11(Xp11 4) | 0 (0%) | 457 |
0.759 (1.00) |
0.712 (1.00) |
0.857 (1.00) |
0.726 (1.00) |
0.0695 (1.00) |
0.668 (1.00) |
0.0509 (1.00) |
0.00533 (1.00) |
| Amp Peak 12(Xq11 2) | 0 (0%) | 461 |
0.803 (1.00) |
0.145 (1.00) |
0.706 (1.00) |
0.726 (1.00) |
0.179 (1.00) |
0.647 (1.00) |
0.31 (1.00) |
0.0584 (1.00) |
| Del Peak 1(1p36 23) | 0 (0%) | 395 |
0.0495 (1.00) |
0.123 (1.00) |
0.123 (1.00) |
0.284 (1.00) |
0.111 (1.00) |
1 (1.00) |
0.0844 (1.00) |
0.168 (1.00) |
| Del Peak 2(1p31 1) | 0 (0%) | 421 |
0.219 (1.00) |
0.0726 (1.00) |
0.016 (1.00) |
0.284 (1.00) |
0.0536 (1.00) |
0.722 (1.00) |
0.294 (1.00) |
0.181 (1.00) |
| Del Peak 3(1q43) | 0 (0%) | 455 |
0.704 (1.00) |
0.335 (1.00) |
1 (1.00) |
0.0712 (1.00) |
0.374 (1.00) |
1 (1.00) |
0.749 (1.00) |
|
| Del Peak 4(2q37 3) | 0 (0%) | 445 |
0.673 (1.00) |
0.63 (1.00) |
0.153 (1.00) |
0.822 (1.00) |
1 (1.00) |
0.402 (1.00) |
0.556 (1.00) |
|
| Del Peak 5(3p25 3) | 0 (0%) | 61 |
0.783 (1.00) |
0.788 (1.00) |
0.569 (1.00) |
0.0817 (1.00) |
0.00144 (0.303) |
1 (1.00) |
0.707 (1.00) |
0.0129 (1.00) |
| Del Peak 7(3p12 2) | 0 (0%) | 210 |
0.614 (1.00) |
0.761 (1.00) |
0.00221 (0.461) |
0.741 (1.00) |
0.217 (1.00) |
0.626 (1.00) |
0.53 (1.00) |
0.231 (1.00) |
| Del Peak 10(6q26) | 0 (0%) | 351 |
0.565 (1.00) |
0.287 (1.00) |
0.012 (1.00) |
0.256 (1.00) |
0.621 (1.00) |
0.0195 (1.00) |
0.41 (1.00) |
0.32 (1.00) |
| Del Peak 11(6q26) | 0 (0%) | 351 |
0.589 (1.00) |
0.226 (1.00) |
0.00648 (1.00) |
0.256 (1.00) |
0.621 (1.00) |
0.0195 (1.00) |
0.41 (1.00) |
0.32 (1.00) |
| Del Peak 12(8p23 2) | 0 (0%) | 347 |
0.0385 (1.00) |
0.139 (1.00) |
0.256 (1.00) |
0.893 (1.00) |
0.176 (1.00) |
0.786 (1.00) |
0.055 (1.00) |
0.14 (1.00) |
| Del Peak 18(Xq23) | 0 (0%) | 438 |
0.287 (1.00) |
0.669 (1.00) |
0.234 (1.00) |
0.297 (1.00) |
0.657 (1.00) |
0.168 (1.00) |
0.142 (1.00) |
P value = 0.000107 (Fisher's exact test), Q value = 0.024
Table S1. Gene #3: 'Amp Peak 3(3q26.32)' versus Clinical Feature #5: 'PATHOLOGY.T'
| nPatients | T1 | T2 | T3 | T4 |
|---|---|---|---|---|
| ALL | 242 | 64 | 176 | 11 |
| AMP PEAK 3(3Q26.32) CNV | 24 | 8 | 44 | 4 |
| AMP PEAK 3(3Q26.32) WILD-TYPE | 218 | 56 | 132 | 7 |
Figure S1. Get High-res Image Gene #3: 'Amp Peak 3(3q26.32)' versus Clinical Feature #5: 'PATHOLOGY.T'

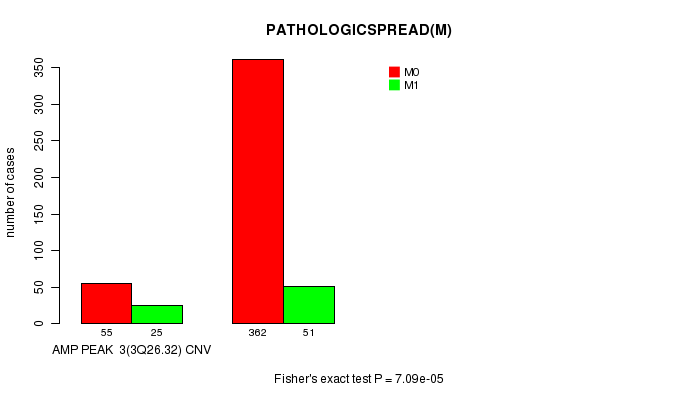
P value = 7.09e-05 (Fisher's exact test), Q value = 0.016
Table S2. Gene #3: 'Amp Peak 3(3q26.32)' versus Clinical Feature #7: 'PATHOLOGICSPREAD(M)'
| nPatients | M0 | M1 |
|---|---|---|
| ALL | 417 | 76 |
| AMP PEAK 3(3Q26.32) CNV | 55 | 25 |
| AMP PEAK 3(3Q26.32) WILD-TYPE | 362 | 51 |
Figure S2. Get High-res Image Gene #3: 'Amp Peak 3(3q26.32)' versus Clinical Feature #7: 'PATHOLOGICSPREAD(M)'
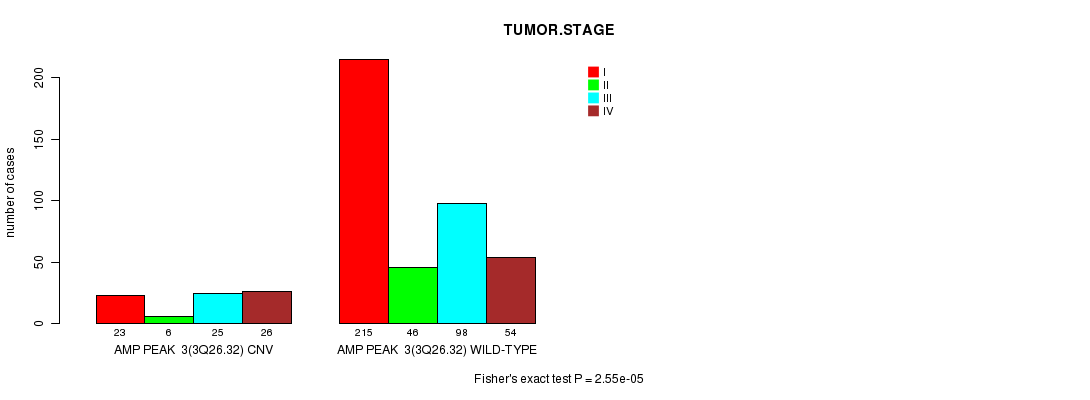
P value = 2.55e-05 (Fisher's exact test), Q value = 0.0058
Table S3. Gene #3: 'Amp Peak 3(3q26.32)' versus Clinical Feature #8: 'TUMOR.STAGE'
| nPatients | I | II | III | IV |
|---|---|---|---|---|
| ALL | 238 | 52 | 123 | 80 |
| AMP PEAK 3(3Q26.32) CNV | 23 | 6 | 25 | 26 |
| AMP PEAK 3(3Q26.32) WILD-TYPE | 215 | 46 | 98 | 54 |
Figure S3. Get High-res Image Gene #3: 'Amp Peak 3(3q26.32)' versus Clinical Feature #8: 'TUMOR.STAGE'
P value = 0.00112 (Fisher's exact test), Q value = 0.24
Table S4. Gene #7: 'Amp Peak 7(8q24.22)' versus Clinical Feature #5: 'PATHOLOGY.T'
| nPatients | T1 | T2 | T3 | T4 |
|---|---|---|---|---|
| ALL | 242 | 64 | 176 | 11 |
| AMP PEAK 7(8Q24.22) CNV | 21 | 11 | 39 | 2 |
| AMP PEAK 7(8Q24.22) WILD-TYPE | 221 | 53 | 137 | 9 |
Figure S4. Get High-res Image Gene #7: 'Amp Peak 7(8q24.22)' versus Clinical Feature #5: 'PATHOLOGY.T'

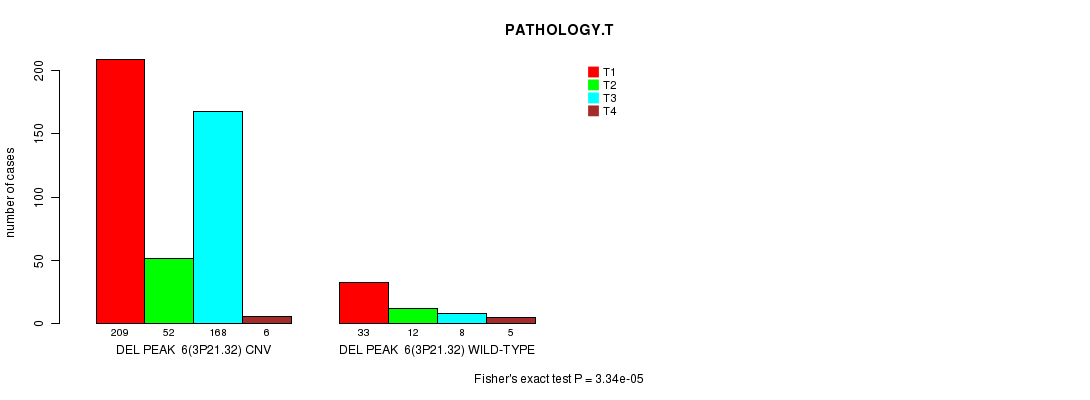
P value = 3.34e-05 (Fisher's exact test), Q value = 0.0076
Table S5. Gene #18: 'Del Peak 6(3p21.32)' versus Clinical Feature #5: 'PATHOLOGY.T'
| nPatients | T1 | T2 | T3 | T4 |
|---|---|---|---|---|
| ALL | 242 | 64 | 176 | 11 |
| DEL PEAK 6(3P21.32) CNV | 209 | 52 | 168 | 6 |
| DEL PEAK 6(3P21.32) WILD-TYPE | 33 | 12 | 8 | 5 |
Figure S5. Get High-res Image Gene #18: 'Del Peak 6(3p21.32)' versus Clinical Feature #5: 'PATHOLOGY.T'
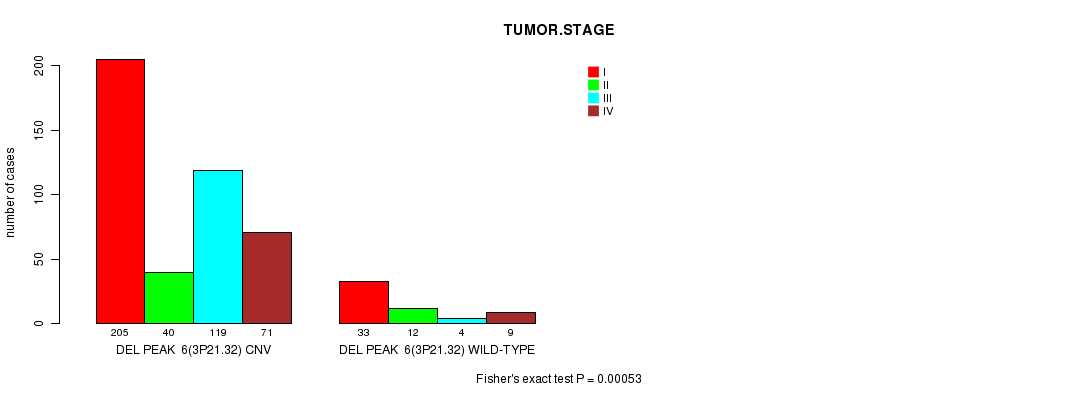
P value = 0.00053 (Fisher's exact test), Q value = 0.12
Table S6. Gene #18: 'Del Peak 6(3p21.32)' versus Clinical Feature #8: 'TUMOR.STAGE'
| nPatients | I | II | III | IV |
|---|---|---|---|---|
| ALL | 238 | 52 | 123 | 80 |
| DEL PEAK 6(3P21.32) CNV | 205 | 40 | 119 | 71 |
| DEL PEAK 6(3P21.32) WILD-TYPE | 33 | 12 | 4 | 9 |
Figure S6. Get High-res Image Gene #18: 'Del Peak 6(3p21.32)' versus Clinical Feature #8: 'TUMOR.STAGE'
P value = 1.32e-07 (Fisher's exact test), Q value = 3.1e-05
Table S7. Gene #20: 'Del Peak 8(3q11.2)' versus Clinical Feature #3: 'GENDER'
| nPatients | FEMALE | MALE |
|---|---|---|
| ALL | 171 | 322 |
| DEL PEAK 8(3Q11.2) CNV | 27 | 123 |
| DEL PEAK 8(3Q11.2) WILD-TYPE | 144 | 199 |
Figure S7. Get High-res Image Gene #20: 'Del Peak 8(3q11.2)' versus Clinical Feature #3: 'GENDER'
P value = 0.000557 (logrank test), Q value = 0.12
Table S8. Gene #21: 'Del Peak 9(4q34.3)' versus Clinical Feature #1: 'Time to Death'
| nPatients | nDeath | Duration Range (Median), Month | |
|---|---|---|---|
| ALL | 490 | 158 | 0.1 - 111.0 (35.2) |
| DEL PEAK 9(4Q34.3) CNV | 76 | 38 | 0.2 - 91.4 (35.1) |
| DEL PEAK 9(4Q34.3) WILD-TYPE | 414 | 120 | 0.1 - 111.0 (35.2) |
Figure S8. Get High-res Image Gene #21: 'Del Peak 9(4q34.3)' versus Clinical Feature #1: 'Time to Death'
P value = 4.27e-07 (Fisher's exact test), Q value = 1e-04
Table S9. Gene #21: 'Del Peak 9(4q34.3)' versus Clinical Feature #5: 'PATHOLOGY.T'
| nPatients | T1 | T2 | T3 | T4 |
|---|---|---|---|---|
| ALL | 242 | 64 | 176 | 11 |
| DEL PEAK 9(4Q34.3) CNV | 19 | 8 | 43 | 6 |
| DEL PEAK 9(4Q34.3) WILD-TYPE | 223 | 56 | 133 | 5 |
Figure S9. Get High-res Image Gene #21: 'Del Peak 9(4q34.3)' versus Clinical Feature #5: 'PATHOLOGY.T'
P value = 2.7e-06 (Fisher's exact test), Q value = 0.00063
Table S10. Gene #21: 'Del Peak 9(4q34.3)' versus Clinical Feature #8: 'TUMOR.STAGE'
| nPatients | I | II | III | IV |
|---|---|---|---|---|
| ALL | 238 | 52 | 123 | 80 |
| DEL PEAK 9(4Q34.3) CNV | 18 | 6 | 30 | 22 |
| DEL PEAK 9(4Q34.3) WILD-TYPE | 220 | 46 | 93 | 58 |
Figure S10. Get High-res Image Gene #21: 'Del Peak 9(4q34.3)' versus Clinical Feature #8: 'TUMOR.STAGE'

P value = 0.000138 (logrank test), Q value = 0.03
Table S11. Gene #25: 'Del Peak 13(9p23)' versus Clinical Feature #1: 'Time to Death'
| nPatients | nDeath | Duration Range (Median), Month | |
|---|---|---|---|
| ALL | 490 | 158 | 0.1 - 111.0 (35.2) |
| DEL PEAK 13(9P23) CNV | 143 | 65 | 0.2 - 109.9 (36.1) |
| DEL PEAK 13(9P23) WILD-TYPE | 347 | 93 | 0.1 - 111.0 (34.6) |
Figure S11. Get High-res Image Gene #25: 'Del Peak 13(9p23)' versus Clinical Feature #1: 'Time to Death'
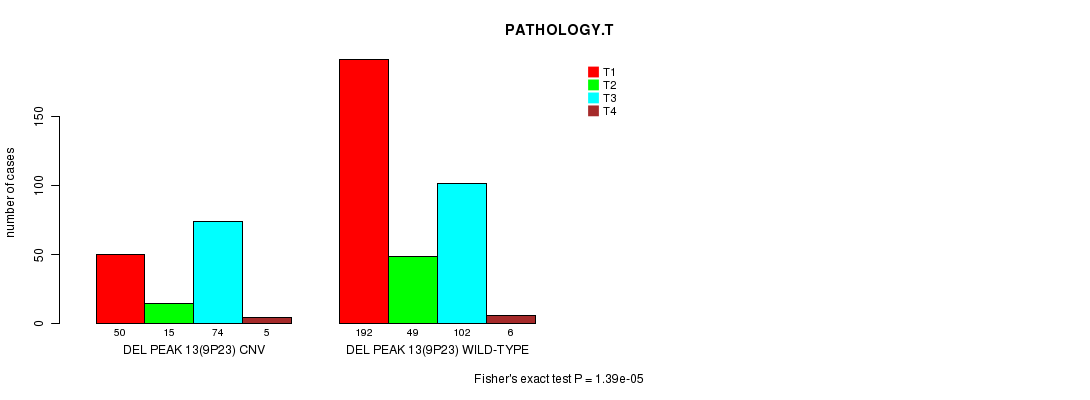
P value = 1.39e-05 (Fisher's exact test), Q value = 0.0032
Table S12. Gene #25: 'Del Peak 13(9p23)' versus Clinical Feature #5: 'PATHOLOGY.T'
| nPatients | T1 | T2 | T3 | T4 |
|---|---|---|---|---|
| ALL | 242 | 64 | 176 | 11 |
| DEL PEAK 13(9P23) CNV | 50 | 15 | 74 | 5 |
| DEL PEAK 13(9P23) WILD-TYPE | 192 | 49 | 102 | 6 |
Figure S12. Get High-res Image Gene #25: 'Del Peak 13(9p23)' versus Clinical Feature #5: 'PATHOLOGY.T'
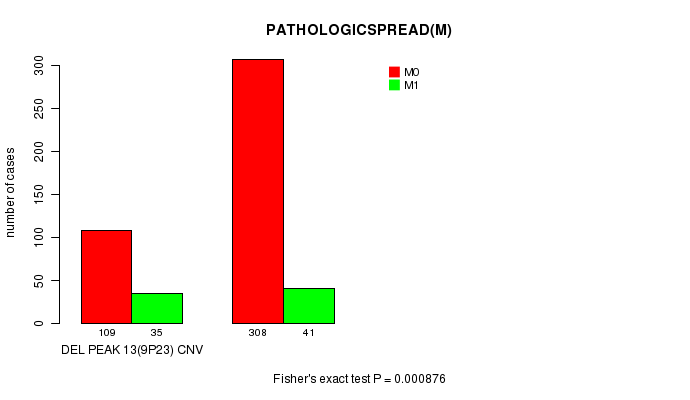
P value = 0.000876 (Fisher's exact test), Q value = 0.19
Table S13. Gene #25: 'Del Peak 13(9p23)' versus Clinical Feature #7: 'PATHOLOGICSPREAD(M)'
| nPatients | M0 | M1 |
|---|---|---|
| ALL | 417 | 76 |
| DEL PEAK 13(9P23) CNV | 109 | 35 |
| DEL PEAK 13(9P23) WILD-TYPE | 308 | 41 |
Figure S13. Get High-res Image Gene #25: 'Del Peak 13(9p23)' versus Clinical Feature #7: 'PATHOLOGICSPREAD(M)'
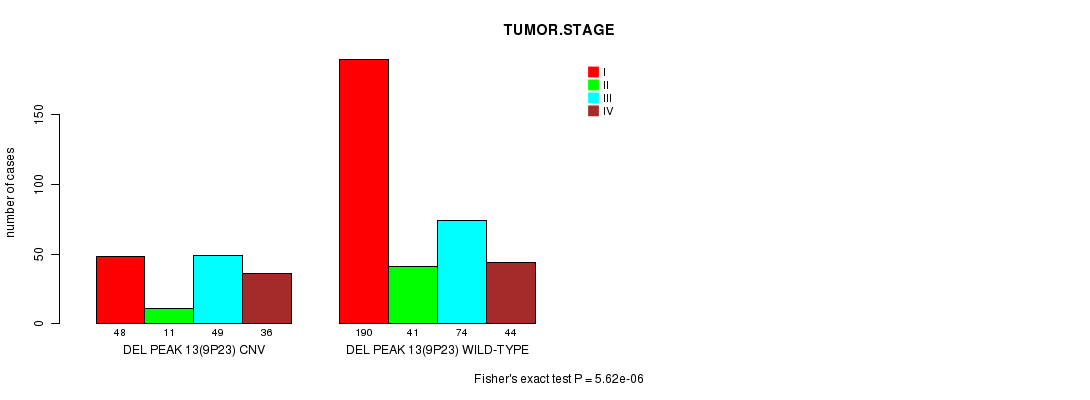
P value = 5.62e-06 (Fisher's exact test), Q value = 0.0013
Table S14. Gene #25: 'Del Peak 13(9p23)' versus Clinical Feature #8: 'TUMOR.STAGE'
| nPatients | I | II | III | IV |
|---|---|---|---|---|
| ALL | 238 | 52 | 123 | 80 |
| DEL PEAK 13(9P23) CNV | 48 | 11 | 49 | 36 |
| DEL PEAK 13(9P23) WILD-TYPE | 190 | 41 | 74 | 44 |
Figure S14. Get High-res Image Gene #25: 'Del Peak 13(9p23)' versus Clinical Feature #8: 'TUMOR.STAGE'
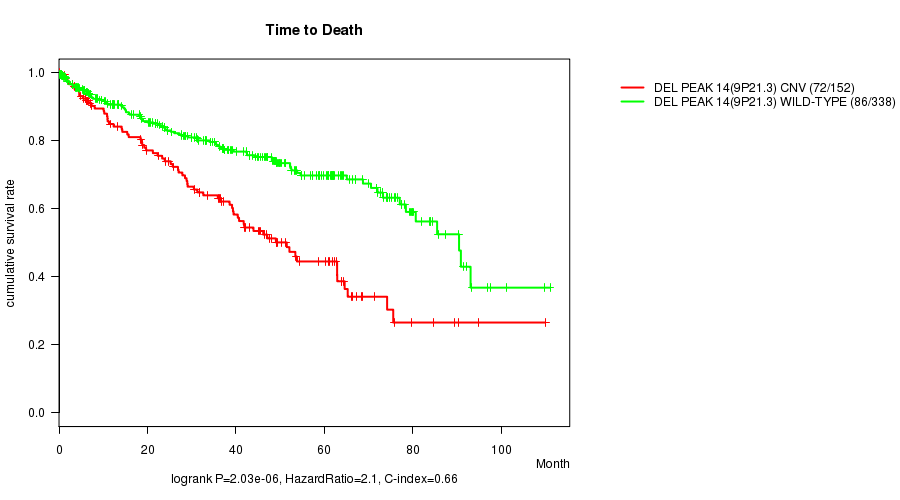
P value = 2.03e-06 (logrank test), Q value = 0.00047
Table S15. Gene #26: 'Del Peak 14(9p21.3)' versus Clinical Feature #1: 'Time to Death'
| nPatients | nDeath | Duration Range (Median), Month | |
|---|---|---|---|
| ALL | 490 | 158 | 0.1 - 111.0 (35.2) |
| DEL PEAK 14(9P21.3) CNV | 152 | 72 | 0.2 - 109.9 (31.5) |
| DEL PEAK 14(9P21.3) WILD-TYPE | 338 | 86 | 0.1 - 111.0 (36.2) |
Figure S15. Get High-res Image Gene #26: 'Del Peak 14(9p21.3)' versus Clinical Feature #1: 'Time to Death'
P value = 1.01e-07 (Fisher's exact test), Q value = 2.4e-05
Table S16. Gene #26: 'Del Peak 14(9p21.3)' versus Clinical Feature #5: 'PATHOLOGY.T'
| nPatients | T1 | T2 | T3 | T4 |
|---|---|---|---|---|
| ALL | 242 | 64 | 176 | 11 |
| DEL PEAK 14(9P21.3) CNV | 51 | 14 | 81 | 6 |
| DEL PEAK 14(9P21.3) WILD-TYPE | 191 | 50 | 95 | 5 |
Figure S16. Get High-res Image Gene #26: 'Del Peak 14(9p21.3)' versus Clinical Feature #5: 'PATHOLOGY.T'
P value = 6.93e-05 (Fisher's exact test), Q value = 0.016
Table S17. Gene #26: 'Del Peak 14(9p21.3)' versus Clinical Feature #7: 'PATHOLOGICSPREAD(M)'
| nPatients | M0 | M1 |
|---|---|---|
| ALL | 417 | 76 |
| DEL PEAK 14(9P21.3) CNV | 113 | 39 |
| DEL PEAK 14(9P21.3) WILD-TYPE | 304 | 37 |
Figure S17. Get High-res Image Gene #26: 'Del Peak 14(9p21.3)' versus Clinical Feature #7: 'PATHOLOGICSPREAD(M)'
P value = 3.39e-08 (Fisher's exact test), Q value = 8e-06
Table S18. Gene #26: 'Del Peak 14(9p21.3)' versus Clinical Feature #8: 'TUMOR.STAGE'
| nPatients | I | II | III | IV |
|---|---|---|---|---|
| ALL | 238 | 52 | 123 | 80 |
| DEL PEAK 14(9P21.3) CNV | 49 | 10 | 52 | 41 |
| DEL PEAK 14(9P21.3) WILD-TYPE | 189 | 42 | 71 | 39 |
Figure S18. Get High-res Image Gene #26: 'Del Peak 14(9p21.3)' versus Clinical Feature #8: 'TUMOR.STAGE'
P value = 0.000477 (Fisher's exact test), Q value = 0.1
Table S19. Gene #27: 'Del Peak 15(10q23.31)' versus Clinical Feature #5: 'PATHOLOGY.T'
| nPatients | T1 | T2 | T3 | T4 |
|---|---|---|---|---|
| ALL | 242 | 64 | 176 | 11 |
| DEL PEAK 15(10Q23.31) CNV | 31 | 10 | 43 | 6 |
| DEL PEAK 15(10Q23.31) WILD-TYPE | 211 | 54 | 133 | 5 |
Figure S19. Get High-res Image Gene #27: 'Del Peak 15(10q23.31)' versus Clinical Feature #5: 'PATHOLOGY.T'

P value = 0.000848 (logrank test), Q value = 0.18
Table S20. Gene #28: 'Del Peak 16(13q13.3)' versus Clinical Feature #1: 'Time to Death'
| nPatients | nDeath | Duration Range (Median), Month | |
|---|---|---|---|
| ALL | 490 | 158 | 0.1 - 111.0 (35.2) |
| DEL PEAK 16(13Q13.3) CNV | 75 | 34 | 0.1 - 89.4 (28.5) |
| DEL PEAK 16(13Q13.3) WILD-TYPE | 415 | 124 | 0.1 - 111.0 (36.3) |
Figure S20. Get High-res Image Gene #28: 'Del Peak 16(13q13.3)' versus Clinical Feature #1: 'Time to Death'
P value = 1.48e-05 (Fisher's exact test), Q value = 0.0034
Table S21. Gene #28: 'Del Peak 16(13q13.3)' versus Clinical Feature #5: 'PATHOLOGY.T'
| nPatients | T1 | T2 | T3 | T4 |
|---|---|---|---|---|
| ALL | 242 | 64 | 176 | 11 |
| DEL PEAK 16(13Q13.3) CNV | 28 | 3 | 39 | 6 |
| DEL PEAK 16(13Q13.3) WILD-TYPE | 214 | 61 | 137 | 5 |
Figure S21. Get High-res Image Gene #28: 'Del Peak 16(13q13.3)' versus Clinical Feature #5: 'PATHOLOGY.T'

P value = 0.000348 (Fisher's exact test), Q value = 0.076
Table S22. Gene #28: 'Del Peak 16(13q13.3)' versus Clinical Feature #8: 'TUMOR.STAGE'
| nPatients | I | II | III | IV |
|---|---|---|---|---|
| ALL | 238 | 52 | 123 | 80 |
| DEL PEAK 16(13Q13.3) CNV | 27 | 2 | 27 | 20 |
| DEL PEAK 16(13Q13.3) WILD-TYPE | 211 | 50 | 96 | 60 |
Figure S22. Get High-res Image Gene #28: 'Del Peak 16(13q13.3)' versus Clinical Feature #8: 'TUMOR.STAGE'
P value = 0.000107 (Fisher's exact test), Q value = 0.024
Table S23. Gene #29: 'Del Peak 17(14q31.1)' versus Clinical Feature #5: 'PATHOLOGY.T'
| nPatients | T1 | T2 | T3 | T4 |
|---|---|---|---|---|
| ALL | 242 | 64 | 176 | 11 |
| DEL PEAK 17(14Q31.1) CNV | 83 | 35 | 96 | 4 |
| DEL PEAK 17(14Q31.1) WILD-TYPE | 159 | 29 | 80 | 7 |
Figure S23. Get High-res Image Gene #29: 'Del Peak 17(14q31.1)' versus Clinical Feature #5: 'PATHOLOGY.T'
P value = 0.000113 (Fisher's exact test), Q value = 0.025
Table S24. Gene #29: 'Del Peak 17(14q31.1)' versus Clinical Feature #6: 'PATHOLOGY.N'
| nPatients | 0 | 1 |
|---|---|---|
| ALL | 228 | 18 |
| DEL PEAK 17(14Q31.1) CNV | 96 | 16 |
| DEL PEAK 17(14Q31.1) WILD-TYPE | 132 | 2 |
Figure S24. Get High-res Image Gene #29: 'Del Peak 17(14q31.1)' versus Clinical Feature #6: 'PATHOLOGY.N'
P value = 0.00101 (Fisher's exact test), Q value = 0.22
Table S25. Gene #29: 'Del Peak 17(14q31.1)' versus Clinical Feature #7: 'PATHOLOGICSPREAD(M)'
| nPatients | M0 | M1 |
|---|---|---|
| ALL | 417 | 76 |
| DEL PEAK 17(14Q31.1) CNV | 171 | 47 |
| DEL PEAK 17(14Q31.1) WILD-TYPE | 246 | 29 |
Figure S25. Get High-res Image Gene #29: 'Del Peak 17(14q31.1)' versus Clinical Feature #7: 'PATHOLOGICSPREAD(M)'
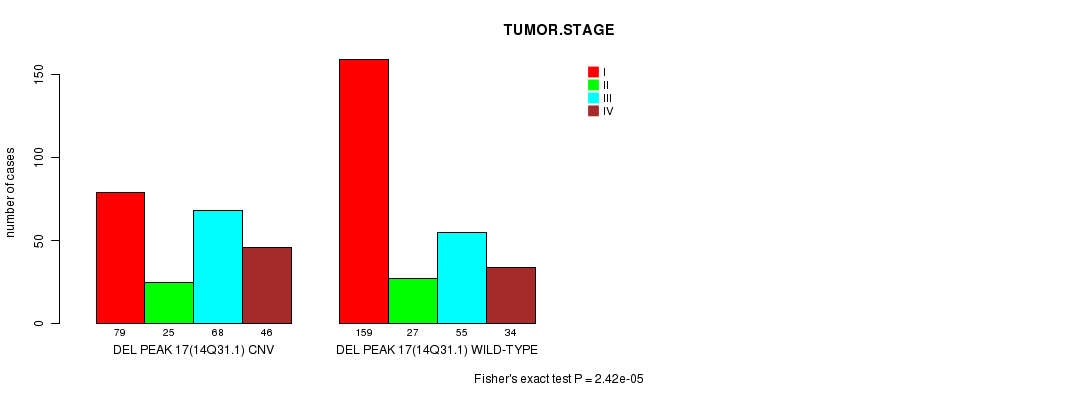
P value = 2.42e-05 (Fisher's exact test), Q value = 0.0055
Table S26. Gene #29: 'Del Peak 17(14q31.1)' versus Clinical Feature #8: 'TUMOR.STAGE'
| nPatients | I | II | III | IV |
|---|---|---|---|---|
| ALL | 238 | 52 | 123 | 80 |
| DEL PEAK 17(14Q31.1) CNV | 79 | 25 | 68 | 46 |
| DEL PEAK 17(14Q31.1) WILD-TYPE | 159 | 27 | 55 | 34 |
Figure S26. Get High-res Image Gene #29: 'Del Peak 17(14q31.1)' versus Clinical Feature #8: 'TUMOR.STAGE'
-
Mutation data file = all_lesions.conf_99.cnv.cluster.txt
-
Clinical data file = KIRC-TP.clin.merged.picked.txt
-
Number of patients = 493
-
Number of significantly arm-level cnvs = 30
-
Number of selected clinical features = 8
-
Exclude genes that fewer than K tumors have mutations, K = 3
For survival clinical features, the Kaplan-Meier survival curves of tumors with and without gene mutations were plotted and the statistical significance P values were estimated by logrank test (Bland and Altman 2004) using the 'survdiff' function in R
For continuous numerical clinical features, two-tailed Student's t test with unequal variance (Lehmann and Romano 2005) was applied to compare the clinical values between tumors with and without gene mutations using 't.test' function in R
For binary or multi-class clinical features (nominal or ordinal), two-tailed Fisher's exact tests (Fisher 1922) were used to estimate the P values using the 'fisher.test' function in R
For multiple hypothesis correction, Q value is the False Discovery Rate (FDR) analogue of the P value (Benjamini and Hochberg 1995), defined as the minimum FDR at which the test may be called significant. We used the 'Benjamini and Hochberg' method of 'p.adjust' function in R to convert P values into Q values.
This is an experimental feature. The full results of the analysis summarized in this report can be downloaded from the TCGA Data Coordination Center.