This pipeline uses various statistical tests to identify miRs whose expression levels correlated to selected clinical features.
Testing the association between 455 genes and 8 clinical features across 481 samples, statistically thresholded by Q value < 0.05, 6 clinical features related to at least one genes.
-
56 genes correlated to 'Time to Death'.
-
HSA-MIR-223 , HSA-MIR-130B , HSA-MIR-34C , HSA-MIR-21 , HSA-MIR-10B , ...
-
1 gene correlated to 'AGE'.
-
HSA-MIR-590
-
11 genes correlated to 'GENDER'.
-
HSA-MIR-100 , HSA-MIR-708 , HSA-MIR-455 , HSA-MIR-599 , HSA-MIR-30C-2 , ...
-
33 genes correlated to 'PATHOLOGY.T'.
-
HSA-MIR-139 , HSA-MIR-21 , HSA-MIR-625 , HSA-MIR-486 , HSA-MIR-144 , ...
-
21 genes correlated to 'PATHOLOGICSPREAD(M)'.
-
HSA-MIR-106B , HSA-MIR-193A , HSA-MIR-155 , HSA-MIR-625 , HSA-MIR-28 , ...
-
34 genes correlated to 'TUMOR.STAGE'.
-
HSA-MIR-139 , HSA-MIR-21 , HSA-MIR-486 , HSA-MIR-155 , HSA-MIR-144 , ...
-
No genes correlated to 'KARNOFSKY.PERFORMANCE.SCORE', and 'PATHOLOGY.N'.
Complete statistical result table is provided in Supplement Table 1
Table 1. Get Full Table This table shows the clinical features, statistical methods used, and the number of genes that are significantly associated with each clinical feature at Q value < 0.05.
| Clinical feature | Statistical test | Significant genes | Associated with | Associated with | ||
|---|---|---|---|---|---|---|
| Time to Death | Cox regression test | N=56 | shorter survival | N=49 | longer survival | N=7 |
| AGE | Spearman correlation test | N=1 | older | N=1 | younger | N=0 |
| GENDER | t test | N=11 | male | N=3 | female | N=8 |
| KARNOFSKY PERFORMANCE SCORE | Spearman correlation test | N=0 | ||||
| PATHOLOGY T | Spearman correlation test | N=33 | higher pT | N=24 | lower pT | N=9 |
| PATHOLOGY N | t test | N=0 | ||||
| PATHOLOGICSPREAD(M) | t test | N=21 | m1 | N=16 | m0 | N=5 |
| TUMOR STAGE | Spearman correlation test | N=34 | higher stage | N=26 | lower stage | N=8 |
Table S1. Basic characteristics of clinical feature: 'Time to Death'
| Time to Death | Duration (Months) | 0.1-111 (median=35.2) |
| censored | N = 323 | |
| death | N = 155 | |
| Significant markers | N = 56 | |
| associated with shorter survival | 49 | |
| associated with longer survival | 7 |
Table S2. Get Full Table List of top 10 genes significantly associated with 'Time to Death' by Cox regression test
| HazardRatio | Wald_P | Q | C_index | |
|---|---|---|---|---|
| HSA-MIR-223 | 1.64 | 2.721e-13 | 1.2e-10 | 0.652 |
| HSA-MIR-130B | 2 | 9.949e-12 | 4.5e-09 | 0.653 |
| HSA-MIR-34C | 1.28 | 5.06e-10 | 2.3e-07 | 0.644 |
| HSA-MIR-21 | 2.1 | 1.033e-09 | 4.7e-07 | 0.659 |
| HSA-MIR-10B | 0.56 | 6.213e-09 | 2.8e-06 | 0.366 |
| HSA-MIR-101-1 | 0.56 | 1.314e-08 | 5.9e-06 | 0.393 |
| HSA-MIR-1248 | 1.41 | 4.348e-08 | 2e-05 | 0.619 |
| HSA-MIR-18A | 1.53 | 1.027e-07 | 4.6e-05 | 0.618 |
| HSA-MIR-3614 | 1.61 | 1.914e-07 | 8.6e-05 | 0.616 |
| HSA-MIR-138-2 | 1.42 | 2.924e-07 | 0.00013 | 0.651 |
Figure S1. Get High-res Image As an example, this figure shows the association of HSA-MIR-223 to 'Time to Death'. four curves present the cumulative survival rates of 4 quartile subsets of patients. P value = 2.72e-13 with univariate Cox regression analysis using continuous log-2 expression values.
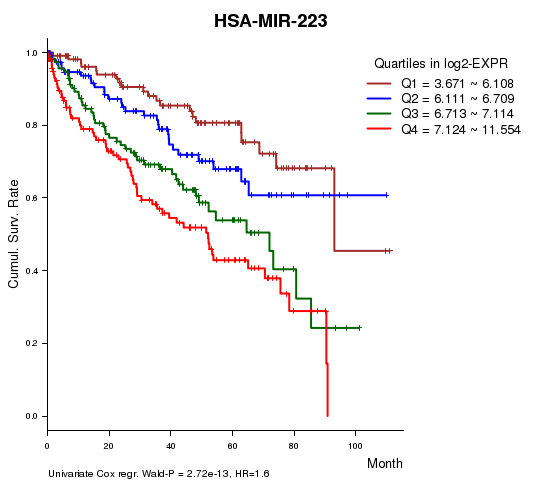
Table S3. Basic characteristics of clinical feature: 'AGE'
| AGE | Mean (SD) | 60.58 (12) |
| Significant markers | N = 1 | |
| pos. correlated | 1 | |
| neg. correlated | 0 |
Table S4. Get Full Table List of one gene significantly correlated to 'AGE' by Spearman correlation test
| SpearmanCorr | corrP | Q | |
|---|---|---|---|
| HSA-MIR-590 | 0.1846 | 4.661e-05 | 0.0212 |
Figure S2. Get High-res Image As an example, this figure shows the association of HSA-MIR-590 to 'AGE'. P value = 4.66e-05 with Spearman correlation analysis. The straight line presents the best linear regression.
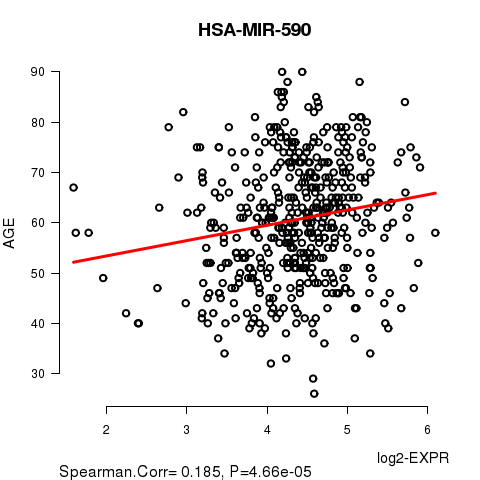
Table S5. Basic characteristics of clinical feature: 'GENDER'
| GENDER | Labels | N |
| FEMALE | 163 | |
| MALE | 318 | |
| Significant markers | N = 11 | |
| Higher in MALE | 3 | |
| Higher in FEMALE | 8 |
Table S6. Get Full Table List of top 10 genes differentially expressed by 'GENDER'
| T(pos if higher in 'MALE') | ttestP | Q | AUC | |
|---|---|---|---|---|
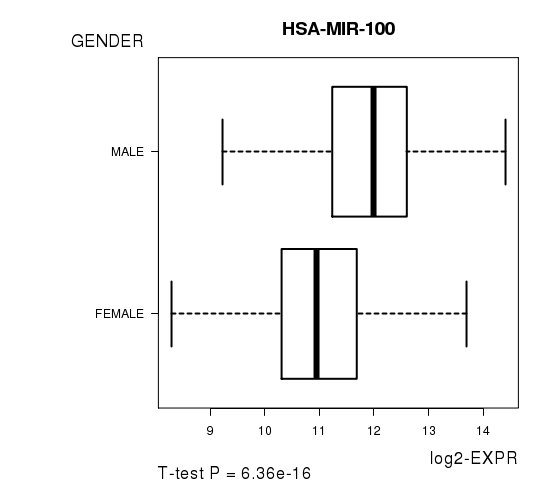
| HSA-MIR-100 | 8.53 | 6.355e-16 | 2.89e-13 | 0.7381 |
| HSA-MIR-708 | 5.36 | 1.635e-07 | 7.42e-05 | 0.6556 |
| HSA-MIR-455 | -5.31 | 1.912e-07 | 8.66e-05 | 0.6567 |
| HSA-MIR-599 | -5.08 | 7.306e-07 | 0.00033 | 0.6754 |
| HSA-MIR-30C-2 | -4.37 | 1.674e-05 | 0.00755 | 0.6153 |
| HSA-MIR-30A | -4.35 | 1.779e-05 | 0.00801 | 0.6139 |
| HSA-MIR-500B | -4.2 | 3.386e-05 | 0.0152 | 0.6121 |
| HSA-MIR-676 | -4.15 | 4.509e-05 | 0.0202 | 0.6145 |
| HSA-MIR-31 | 4.11 | 5.142e-05 | 0.023 | 0.6222 |
| HSA-MIR-328 | -4.07 | 5.919e-05 | 0.0264 | 0.6087 |
Figure S3. Get High-res Image As an example, this figure shows the association of HSA-MIR-100 to 'GENDER'. P value = 6.36e-16 with T-test analysis.
No gene related to 'KARNOFSKY.PERFORMANCE.SCORE'.
Table S7. Basic characteristics of clinical feature: 'KARNOFSKY.PERFORMANCE.SCORE'
| KARNOFSKY.PERFORMANCE.SCORE | Mean (SD) | 88.33 (23) |
| Score | N | |
| 0 | 2 | |
| 70 | 1 | |
| 80 | 3 | |
| 90 | 13 | |
| 100 | 17 | |
| Significant markers | N = 0 |
Table S8. Basic characteristics of clinical feature: 'PATHOLOGY.T'
| PATHOLOGY.T | Mean (SD) | 1.93 (0.97) |
| N | ||
| T1 | 233 | |
| T2 | 62 | |
| T3 | 175 | |
| T4 | 11 | |
| Significant markers | N = 33 | |
| pos. correlated | 24 | |
| neg. correlated | 9 |
Table S9. Get Full Table List of top 10 genes significantly correlated to 'PATHOLOGY.T' by Spearman correlation test
| SpearmanCorr | corrP | Q | |
|---|---|---|---|
| HSA-MIR-139 | -0.3323 | 7.3e-14 | 3.32e-11 |
| HSA-MIR-21 | 0.2777 | 5.795e-10 | 2.63e-07 |
| HSA-MIR-625 | 0.2742 | 9.592e-10 | 4.35e-07 |
| HSA-MIR-486 | -0.2685 | 2.197e-09 | 9.93e-07 |
| HSA-MIR-144 | -0.2539 | 1.629e-08 | 7.35e-06 |
| HSA-MIR-155 | 0.2523 | 2.014e-08 | 9.06e-06 |
| HSA-MIR-130B | 0.244 | 6.012e-08 | 2.7e-05 |
| HSA-MIR-451 | -0.2317 | 2.781e-07 | 0.000125 |
| HSA-MIR-9-1 | 0.2312 | 2.959e-07 | 0.000132 |
| HSA-LET-7I | 0.2244 | 6.627e-07 | 0.000296 |
Figure S4. Get High-res Image As an example, this figure shows the association of HSA-MIR-139 to 'PATHOLOGY.T'. P value = 7.3e-14 with Spearman correlation analysis.
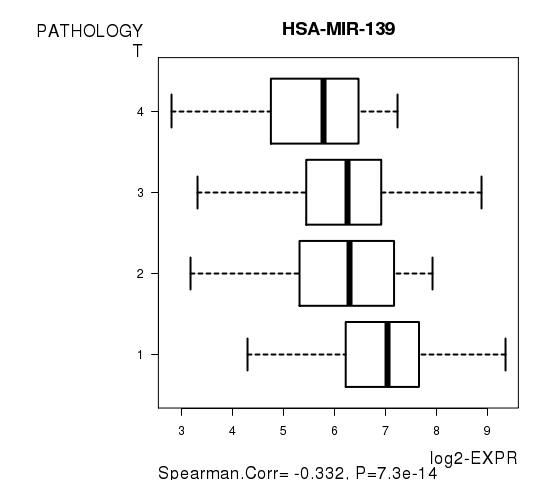
Table S10. Basic characteristics of clinical feature: 'PATHOLOGY.N'
| PATHOLOGY.N | Labels | N |
| N0 | 222 | |
| N1 | 18 | |
| Significant markers | N = 0 |
Table S11. Basic characteristics of clinical feature: 'PATHOLOGICSPREAD(M)'
| PATHOLOGICSPREAD(M) | Labels | N |
| M0 | 405 | |
| M1 | 76 | |
| Significant markers | N = 21 | |
| Higher in M1 | 16 | |
| Higher in M0 | 5 |
Table S12. Get Full Table List of top 10 genes differentially expressed by 'PATHOLOGICSPREAD(M)'
| T(pos if higher in 'M1') | ttestP | Q | AUC | |
|---|---|---|---|---|
| HSA-MIR-106B | 5.7 | 6.381e-08 | 2.9e-05 | 0.6738 |
| HSA-MIR-193A | 5.57 | 9.469e-08 | 4.3e-05 | 0.6407 |
| HSA-MIR-155 | 5.4 | 3.791e-07 | 0.000172 | 0.6873 |
| HSA-MIR-625 | 5.4 | 4.328e-07 | 0.000196 | 0.6887 |
| HSA-MIR-28 | 5.22 | 7.987e-07 | 0.00036 | 0.659 |
| HSA-LET-7I | 5.15 | 1.024e-06 | 0.000461 | 0.6667 |
| HSA-MIR-144 | -5.19 | 1.063e-06 | 0.000477 | 0.6849 |
| HSA-MIR-130B | 5.06 | 1.575e-06 | 0.000706 | 0.6683 |
| HSA-MIR-27A | 4.74 | 5.384e-06 | 0.00241 | 0.6273 |
| HSA-MIR-21 | 4.69 | 7.295e-06 | 0.00325 | 0.6458 |
Figure S5. Get High-res Image As an example, this figure shows the association of HSA-MIR-106B to 'PATHOLOGICSPREAD(M)'. P value = 6.38e-08 with T-test analysis.
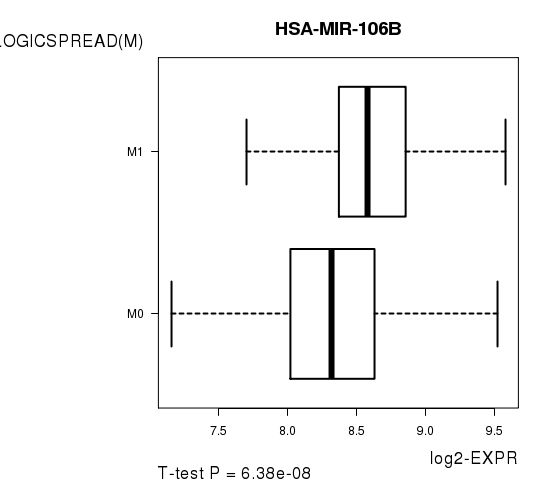
Table S13. Basic characteristics of clinical feature: 'TUMOR.STAGE'
| TUMOR.STAGE | Mean (SD) | 2.11 (1.2) |
| N | ||
| Stage 1 | 229 | |
| Stage 2 | 50 | |
| Stage 3 | 122 | |
| Stage 4 | 80 | |
| Significant markers | N = 34 | |
| pos. correlated | 26 | |
| neg. correlated | 8 |
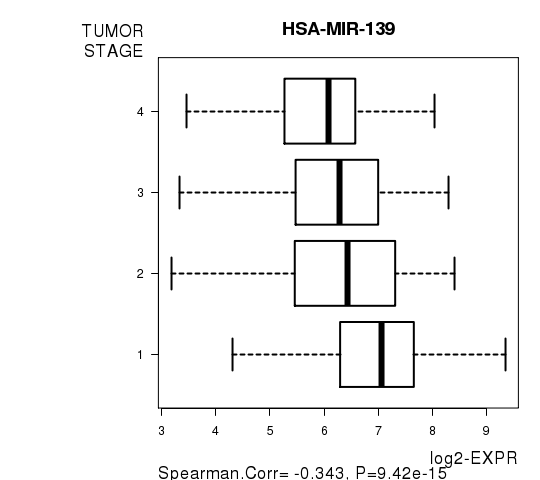
Table S14. Get Full Table List of top 10 genes significantly correlated to 'TUMOR.STAGE' by Spearman correlation test
| SpearmanCorr | corrP | Q | |
|---|---|---|---|
| HSA-MIR-139 | -0.3433 | 9.422e-15 | 4.29e-12 |
| HSA-MIR-21 | 0.2837 | 2.352e-10 | 1.07e-07 |
| HSA-MIR-486 | -0.2826 | 2.763e-10 | 1.25e-07 |
| HSA-MIR-155 | 0.28 | 4.118e-10 | 1.86e-07 |
| HSA-MIR-144 | -0.2797 | 4.31e-10 | 1.94e-07 |
| HSA-MIR-625 | 0.2742 | 9.583e-10 | 4.31e-07 |
| HSA-MIR-451 | -0.2572 | 1.052e-08 | 4.72e-06 |
| HSA-LET-7I | 0.2545 | 1.508e-08 | 6.75e-06 |
| HSA-MIR-9-1 | 0.2358 | 1.667e-07 | 7.45e-05 |
| HSA-MIR-10B | -0.2348 | 1.895e-07 | 8.45e-05 |
Figure S6. Get High-res Image As an example, this figure shows the association of HSA-MIR-139 to 'TUMOR.STAGE'. P value = 9.42e-15 with Spearman correlation analysis.
-
Expresson data file = KIRC-TP.miRseq_RPKM_log2.txt
-
Clinical data file = KIRC-TP.clin.merged.picked.txt
-
Number of patients = 481
-
Number of genes = 455
-
Number of clinical features = 8
For survival clinical features, Wald's test in univariate Cox regression analysis with proportional hazards model (Andersen and Gill 1982) was used to estimate the P values using the 'coxph' function in R. Kaplan-Meier survival curves were plot using the four quartile subgroups of patients based on expression levels
For continuous numerical clinical features, Spearman's rank correlation coefficients (Spearman 1904) and two-tailed P values were estimated using 'cor.test' function in R
For two-class clinical features, two-tailed Student's t test with unequal variance (Lehmann and Romano 2005) was applied to compare the log2-expression levels between the two clinical classes using 't.test' function in R
For multiple hypothesis correction, Q value is the False Discovery Rate (FDR) analogue of the P value (Benjamini and Hochberg 1995), defined as the minimum FDR at which the test may be called significant. We used the 'Benjamini and Hochberg' method of 'p.adjust' function in R to convert P values into Q values.
This is an experimental feature. The full results of the analysis summarized in this report can be downloaded from the TCGA Data Coordination Center.