This pipeline uses various statistical tests to identify genes whose promoter methylation levels correlated to selected clinical features.
Testing the association between 17247 genes and 8 clinical features across 59 samples, statistically thresholded by Q value < 0.05, 5 clinical features related to at least one genes.
-
1 gene correlated to 'AGE'.
-
IGF2BP2
-
4 genes correlated to 'GENDER'.
-
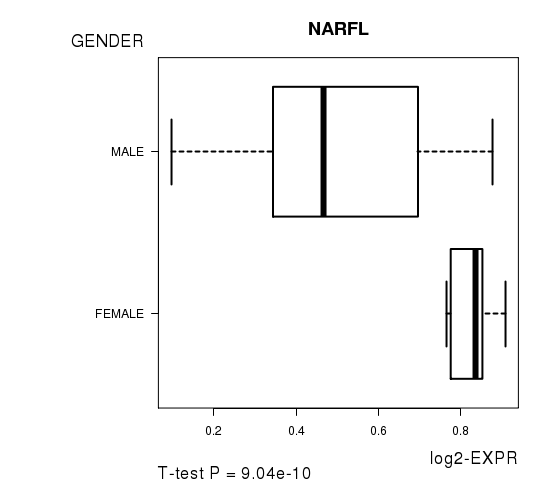
NARFL , ATAD5 , CCNYL1 , HNRNPD
-
51 genes correlated to 'PATHOLOGY.T'.
-
DLX6AS , GNASAS , GP2 , GPR150 , SLC2A14 , ...
-
25 genes correlated to 'PATHOLOGICSPREAD(M)'.
-
RFX7 , GDPD4 , ERCC2 , DHDH , UNC93A , ...
-
38 genes correlated to 'TUMOR.STAGE'.
-
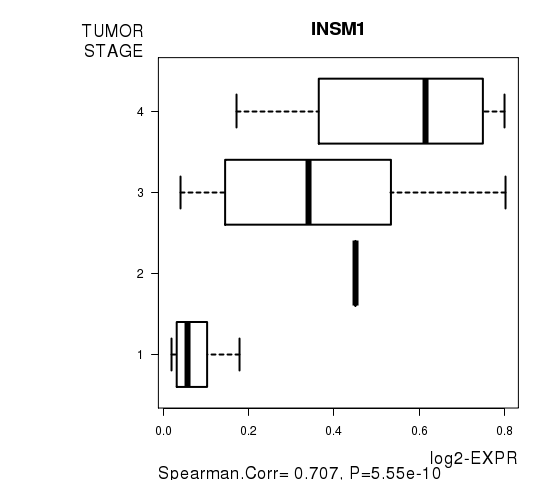
INSM1 , ZNF177 , DLX6AS , MATK , NSD1 , ...
-
No genes correlated to 'Time to Death', 'KARNOFSKY.PERFORMANCE.SCORE', and 'PATHOLOGY.N'.
Complete statistical result table is provided in Supplement Table 1
Table 1. Get Full Table This table shows the clinical features, statistical methods used, and the number of genes that are significantly associated with each clinical feature at Q value < 0.05.
| Clinical feature | Statistical test | Significant genes | Associated with | Associated with | ||
|---|---|---|---|---|---|---|
| Time to Death | Cox regression test | N=0 | ||||
| AGE | Spearman correlation test | N=1 | older | N=1 | younger | N=0 |
| GENDER | t test | N=4 | male | N=2 | female | N=2 |
| KARNOFSKY PERFORMANCE SCORE | t test | N=0 | ||||
| PATHOLOGY T | Spearman correlation test | N=51 | higher pT | N=36 | lower pT | N=15 |
| PATHOLOGY N | Spearman correlation test | N=0 | ||||
| PATHOLOGICSPREAD(M) | ANOVA test | N=25 | ||||
| TUMOR STAGE | Spearman correlation test | N=38 | higher stage | N=32 | lower stage | N=6 |
Table S1. Basic characteristics of clinical feature: 'Time to Death'
| Time to Death | Duration (Months) | 1-182.7 (median=20.9) |
| censored | N = 45 | |
| death | N = 11 | |
| Significant markers | N = 0 |
Table S2. Basic characteristics of clinical feature: 'AGE'
| AGE | Mean (SD) | 60.18 (14) |
| Significant markers | N = 1 | |
| pos. correlated | 1 | |
| neg. correlated | 0 |
Table S3. Get Full Table List of one gene significantly correlated to 'AGE' by Spearman correlation test
| SpearmanCorr | corrP | Q | |
|---|---|---|---|
| IGF2BP2 | 0.6161 | 4.32e-07 | 0.00745 |
Figure S1. Get High-res Image As an example, this figure shows the association of IGF2BP2 to 'AGE'. P value = 4.32e-07 with Spearman correlation analysis. The straight line presents the best linear regression.
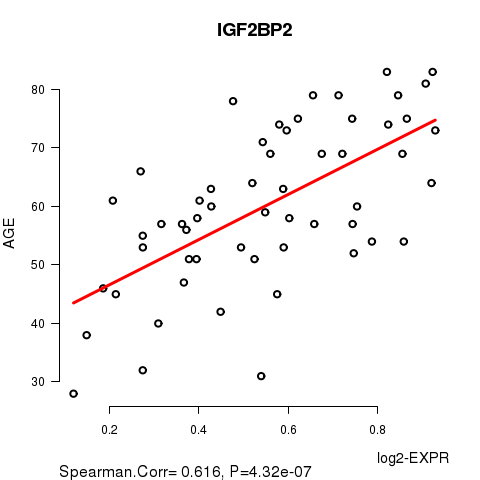
Table S4. Basic characteristics of clinical feature: 'GENDER'
| GENDER | Labels | N |
| FEMALE | 19 | |
| MALE | 40 | |
| Significant markers | N = 4 | |
| Higher in MALE | 2 | |
| Higher in FEMALE | 2 |
Table S5. Get Full Table List of 4 genes differentially expressed by 'GENDER'
| T(pos if higher in 'MALE') | ttestP | Q | AUC | |
|---|---|---|---|---|
| NARFL | -7.33 | 9.043e-10 | 1.56e-05 | 0.8921 |
| ATAD5 | 6.82 | 1.719e-07 | 0.00296 | 0.8947 |
| CCNYL1 | -6.43 | 6.931e-07 | 0.012 | 0.8908 |
| HNRNPD | 6.38 | 1.327e-06 | 0.0229 | 0.9171 |
Figure S2. Get High-res Image As an example, this figure shows the association of NARFL to 'GENDER'. P value = 9.04e-10 with T-test analysis.
No gene related to 'KARNOFSKY.PERFORMANCE.SCORE'.
Table S6. Basic characteristics of clinical feature: 'KARNOFSKY.PERFORMANCE.SCORE'
| KARNOFSKY.PERFORMANCE.SCORE | Labels | N |
| class100 | 5 | |
| class90 | 6 | |
| Significant markers | N = 0 |
Table S7. Basic characteristics of clinical feature: 'PATHOLOGY.T'
| PATHOLOGY.T | Mean (SD) | 1.93 (1) |
| N | ||
| T1 | 31 | |
| T2 | 2 | |
| T3 | 25 | |
| T4 | 1 | |
| Significant markers | N = 51 | |
| pos. correlated | 36 | |
| neg. correlated | 15 |
Table S8. Get Full Table List of top 10 genes significantly correlated to 'PATHOLOGY.T' by Spearman correlation test
| SpearmanCorr | corrP | Q | |
|---|---|---|---|
| DLX6AS | 0.7006 | 6.54e-10 | 1.13e-05 |
| GNASAS | -0.6969 | 8.771e-10 | 1.51e-05 |
| GP2 | -0.6568 | 1.616e-08 | 0.000279 |
| GPR150 | 0.6486 | 2.779e-08 | 0.000479 |
| SLC2A14 | 0.6419 | 4.276e-08 | 0.000737 |
| DLEU2 | -0.6397 | 4.932e-08 | 0.00085 |
| PCDHB19P | 0.6289 | 9.587e-08 | 0.00165 |
| C2ORF55 | 0.6285 | 9.86e-08 | 0.0017 |
| RIMS3 | 0.6237 | 1.316e-07 | 0.00227 |
| ZNF177 | 0.6231 | 1.364e-07 | 0.00235 |
Figure S3. Get High-res Image As an example, this figure shows the association of DLX6AS to 'PATHOLOGY.T'. P value = 6.54e-10 with Spearman correlation analysis.

Table S9. Basic characteristics of clinical feature: 'PATHOLOGY.N'
| PATHOLOGY.N | Mean (SD) | 0.57 (0.69) |
| N | ||
| N0 | 15 | |
| N1 | 10 | |
| N2 | 3 | |
| Significant markers | N = 0 |
Table S10. Basic characteristics of clinical feature: 'PATHOLOGICSPREAD(M)'
| PATHOLOGICSPREAD(M) | Labels | N |
| M0 | 37 | |
| M1 | 4 | |
| MX | 17 | |
| Significant markers | N = 25 |
Table S11. Get Full Table List of top 10 genes differentially expressed by 'PATHOLOGICSPREAD(M)'
| ANOVA_P | Q | |
|---|---|---|
| RFX7 | 1.268e-11 | 2.19e-07 |
| GDPD4 | 4.964e-09 | 8.56e-05 |
| ERCC2 | 2.597e-08 | 0.000448 |
| DHDH | 9.285e-08 | 0.0016 |
| UNC93A | 1.432e-07 | 0.00247 |
| ZPBP | 1.813e-07 | 0.00313 |
| NFE2L1 | 2.075e-07 | 0.00358 |
| PCDHA5 | 2.938e-07 | 0.00506 |
| KRAS | 4.228e-07 | 0.00729 |
| PPP4R1 | 4.939e-07 | 0.00851 |
Figure S4. Get High-res Image As an example, this figure shows the association of RFX7 to 'PATHOLOGICSPREAD(M)'. P value = 1.27e-11 with ANOVA analysis.
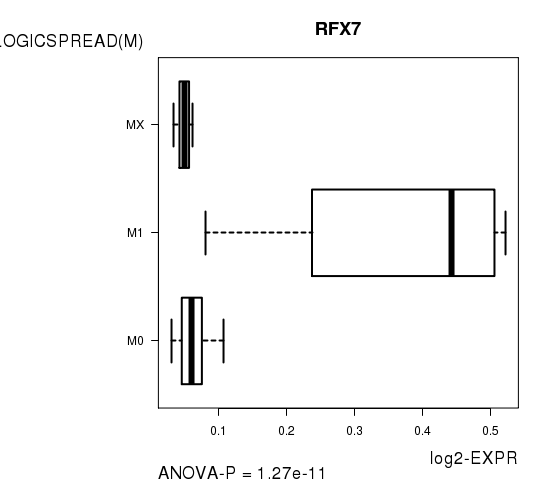
Table S12. Basic characteristics of clinical feature: 'TUMOR.STAGE'
| TUMOR.STAGE | Mean (SD) | 2.07 (1.2) |
| N | ||
| Stage 1 | 30 | |
| Stage 2 | 1 | |
| Stage 3 | 20 | |
| Stage 4 | 7 | |
| Significant markers | N = 38 | |
| pos. correlated | 32 | |
| neg. correlated | 6 |
Table S13. Get Full Table List of top 10 genes significantly correlated to 'TUMOR.STAGE' by Spearman correlation test
| SpearmanCorr | corrP | Q | |
|---|---|---|---|
| INSM1 | 0.707 | 5.552e-10 | 9.58e-06 |
| ZNF177 | 0.6769 | 5.41e-09 | 9.33e-05 |
| DLX6AS | 0.6731 | 7.101e-09 | 0.000122 |
| MATK | 0.6487 | 3.648e-08 | 0.000629 |
| NSD1 | 0.6463 | 4.266e-08 | 0.000736 |
| TMEM132B | -0.6425 | 5.413e-08 | 0.000933 |
| WDR16 | 0.6388 | 6.818e-08 | 0.00118 |
| DIO3 | 0.6329 | 9.794e-08 | 0.00169 |
| SERHL | 0.6278 | 1.333e-07 | 0.0023 |
| DLEU2 | -0.6209 | 1.995e-07 | 0.00344 |
Figure S5. Get High-res Image As an example, this figure shows the association of INSM1 to 'TUMOR.STAGE'. P value = 5.55e-10 with Spearman correlation analysis.
-
Expresson data file = KIRP-TP.meth.for_correlation.filtered_data.txt
-
Clinical data file = KIRP-TP.clin.merged.picked.txt
-
Number of patients = 59
-
Number of genes = 17247
-
Number of clinical features = 8
For survival clinical features, Wald's test in univariate Cox regression analysis with proportional hazards model (Andersen and Gill 1982) was used to estimate the P values using the 'coxph' function in R. Kaplan-Meier survival curves were plot using the four quartile subgroups of patients based on expression levels
For continuous numerical clinical features, Spearman's rank correlation coefficients (Spearman 1904) and two-tailed P values were estimated using 'cor.test' function in R
For two-class clinical features, two-tailed Student's t test with unequal variance (Lehmann and Romano 2005) was applied to compare the log2-expression levels between the two clinical classes using 't.test' function in R
For multi-class clinical features (ordinal or nominal), one-way analysis of variance (Howell 2002) was applied to compare the log2-expression levels between different clinical classes using 'anova' function in R
For multiple hypothesis correction, Q value is the False Discovery Rate (FDR) analogue of the P value (Benjamini and Hochberg 1995), defined as the minimum FDR at which the test may be called significant. We used the 'Benjamini and Hochberg' method of 'p.adjust' function in R to convert P values into Q values.
This is an experimental feature. The full results of the analysis summarized in this report can be downloaded from the TCGA Data Coordination Center.