This pipeline uses various statistical tests to identify mRNAs whose expression levels correlated to selected clinical features.
Testing the association between 18174 genes and 8 clinical features across 75 samples, statistically thresholded by Q value < 0.05, 6 clinical features related to at least one genes.
-
1 gene correlated to 'AGE'.
-
MCCC2|64087
-
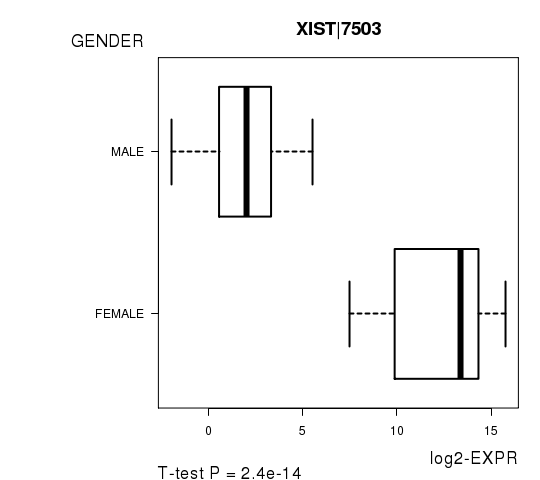
16 genes correlated to 'GENDER'.
-
XIST|7503 , RPS4Y1|6192 , KDM5C|8242 , ZFX|7543 , PRKY|5616 , ...
-
64 genes correlated to 'PATHOLOGY.T'.
-
UCK2|7371 , PRCC|5546 , MAD2L1|4085 , ACBD6|84320 , EPR1|8475 , ...
-
2 genes correlated to 'PATHOLOGY.N'.
-
KIAA0664|23277 , KCMF1|56888
-
2 genes correlated to 'PATHOLOGICSPREAD(M)'.
-
CA8|767 , GLB1L2|89944
-
127 genes correlated to 'TUMOR.STAGE'.
-
MAD2L1|4085 , UCK2|7371 , PRCC|5546 , EPR1|8475 , GPR19|2842 , ...
-
No genes correlated to 'Time to Death', and 'KARNOFSKY.PERFORMANCE.SCORE'.
Complete statistical result table is provided in Supplement Table 1
Table 1. Get Full Table This table shows the clinical features, statistical methods used, and the number of genes that are significantly associated with each clinical feature at Q value < 0.05.
| Clinical feature | Statistical test | Significant genes | Associated with | Associated with | ||
|---|---|---|---|---|---|---|
| Time to Death | Cox regression test | N=0 | ||||
| AGE | Spearman correlation test | N=1 | older | N=1 | younger | N=0 |
| GENDER | t test | N=16 | male | N=3 | female | N=13 |
| KARNOFSKY PERFORMANCE SCORE | Spearman correlation test | N=0 | ||||
| PATHOLOGY T | Spearman correlation test | N=64 | higher pT | N=61 | lower pT | N=3 |
| PATHOLOGY N | Spearman correlation test | N=2 | higher pN | N=1 | lower pN | N=1 |
| PATHOLOGICSPREAD(M) | ANOVA test | N=2 | ||||
| TUMOR STAGE | Spearman correlation test | N=127 | higher stage | N=110 | lower stage | N=17 |
Table S1. Basic characteristics of clinical feature: 'Time to Death'
| Time to Death | Duration (Months) | 0.5-182.7 (median=15.1) |
| censored | N = 59 | |
| death | N = 13 | |
| Significant markers | N = 0 |
Table S2. Basic characteristics of clinical feature: 'AGE'
| AGE | Mean (SD) | 59.68 (13) |
| Significant markers | N = 1 | |
| pos. correlated | 1 | |
| neg. correlated | 0 |
Table S3. Get Full Table List of one gene significantly correlated to 'AGE' by Spearman correlation test
| SpearmanCorr | corrP | Q | |
|---|---|---|---|
| MCCC2|64087 | 0.5368 | 1.166e-06 | 0.0212 |
Figure S1. Get High-res Image As an example, this figure shows the association of MCCC2|64087 to 'AGE'. P value = 1.17e-06 with Spearman correlation analysis. The straight line presents the best linear regression.
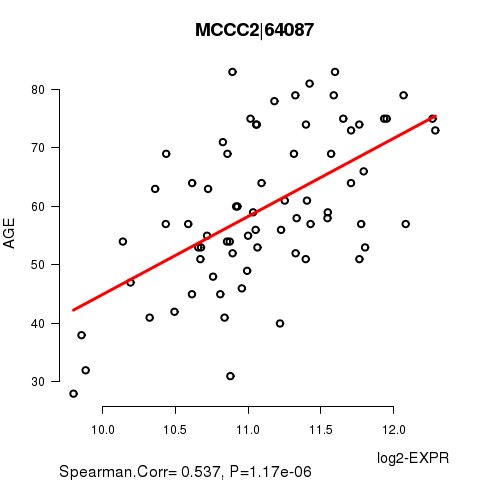
Table S4. Basic characteristics of clinical feature: 'GENDER'
| GENDER | Labels | N |
| FEMALE | 23 | |
| MALE | 52 | |
| Significant markers | N = 16 | |
| Higher in MALE | 3 | |
| Higher in FEMALE | 13 |
Table S5. Get Full Table List of top 10 genes differentially expressed by 'GENDER'
| T(pos if higher in 'MALE') | ttestP | Q | AUC | |
|---|---|---|---|---|
| XIST|7503 | -13.36 | 2.403e-14 | 4.36e-10 | 0.982 |
| RPS4Y1|6192 | 11.88 | 2.538e-11 | 4.61e-07 | 0.9562 |
| KDM5C|8242 | -8.17 | 4.536e-10 | 8.24e-06 | 0.9356 |
| ZFX|7543 | -6.99 | 9.264e-09 | 0.000168 | 0.8921 |
| PRKY|5616 | 7.5 | 9.69e-09 | 0.000176 | 0.9164 |
| KDM6A|7403 | -6.91 | 1.084e-08 | 0.000197 | 0.9105 |
| TSIX|9383 | -7.64 | 1.31e-08 | 0.000238 | 0.9309 |
| TXLNG|55787 | -6.28 | 5.748e-08 | 0.00104 | 0.8654 |
| UBA1|7317 | -6.13 | 4.028e-07 | 0.00731 | 0.8796 |
| ZNF275|10838 | -6.03 | 4.325e-07 | 0.00785 | 0.8671 |
Figure S2. Get High-res Image As an example, this figure shows the association of XIST|7503 to 'GENDER'. P value = 2.4e-14 with T-test analysis.
No gene related to 'KARNOFSKY.PERFORMANCE.SCORE'.
Table S6. Basic characteristics of clinical feature: 'KARNOFSKY.PERFORMANCE.SCORE'
| KARNOFSKY.PERFORMANCE.SCORE | Mean (SD) | 86.67 (28) |
| Score | N | |
| 0 | 1 | |
| 90 | 6 | |
| 100 | 5 | |
| Significant markers | N = 0 |
Table S7. Basic characteristics of clinical feature: 'PATHOLOGY.T'
| PATHOLOGY.T | Mean (SD) | 1.88 (0.96) |
| N | ||
| T1 | 38 | |
| T2 | 9 | |
| T3 | 27 | |
| T4 | 1 | |
| Significant markers | N = 64 | |
| pos. correlated | 61 | |
| neg. correlated | 3 |
Table S8. Get Full Table List of top 10 genes significantly correlated to 'PATHOLOGY.T' by Spearman correlation test
| SpearmanCorr | corrP | Q | |
|---|---|---|---|
| UCK2|7371 | 0.6687 | 5.507e-11 | 1e-06 |
| PRCC|5546 | 0.6038 | 9.811e-09 | 0.000178 |
| MAD2L1|4085 | 0.6012 | 1.171e-08 | 0.000213 |
| ACBD6|84320 | 0.5906 | 2.436e-08 | 0.000443 |
| EPR1|8475 | 0.5885 | 3.507e-08 | 0.000637 |
| NUF2|83540 | 0.5837 | 3.874e-08 | 0.000704 |
| CCT3|7203 | 0.5828 | 4.11e-08 | 0.000747 |
| GPR19|2842 | 0.5841 | 5.797e-08 | 0.00105 |
| UBE2T|29089 | 0.5753 | 6.702e-08 | 0.00122 |
| KIF4A|24137 | 0.5679 | 1.072e-07 | 0.00195 |
Figure S3. Get High-res Image As an example, this figure shows the association of UCK2|7371 to 'PATHOLOGY.T'. P value = 5.51e-11 with Spearman correlation analysis.
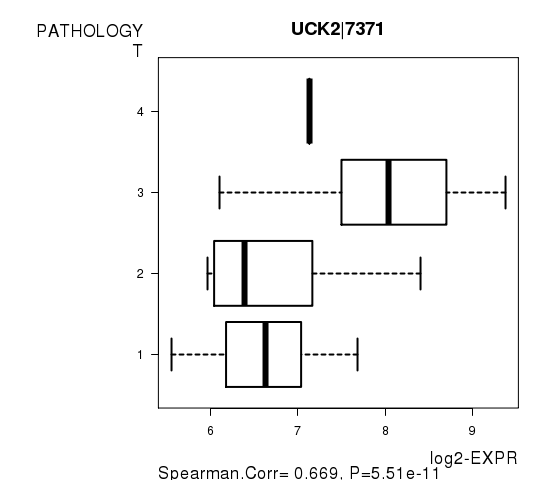
Table S9. Basic characteristics of clinical feature: 'PATHOLOGY.N'
| PATHOLOGY.N | Mean (SD) | 0.6 (0.67) |
| N | ||
| N0 | 15 | |
| N1 | 12 | |
| N2 | 3 | |
| Significant markers | N = 2 | |
| pos. correlated | 1 | |
| neg. correlated | 1 |
Table S10. Get Full Table List of 2 genes significantly correlated to 'PATHOLOGY.N' by Spearman correlation test
| SpearmanCorr | corrP | Q | |
|---|---|---|---|
| KIAA0664|23277 | -0.7671 | 7.624e-07 | 0.0139 |
| KCMF1|56888 | 0.7449 | 2.35e-06 | 0.0427 |
Figure S4. Get High-res Image As an example, this figure shows the association of KIAA0664|23277 to 'PATHOLOGY.N'. P value = 7.62e-07 with Spearman correlation analysis.
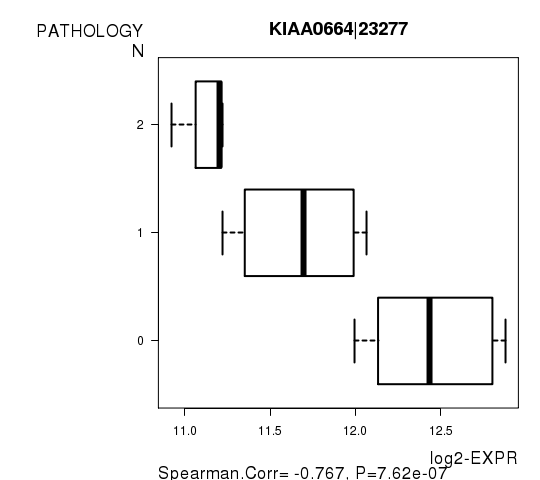
Table S11. Basic characteristics of clinical feature: 'PATHOLOGICSPREAD(M)'
| PATHOLOGICSPREAD(M) | Labels | N |
| M0 | 46 | |
| M1 | 5 | |
| MX | 17 | |
| Significant markers | N = 2 |
Table S12. Get Full Table List of 2 genes differentially expressed by 'PATHOLOGICSPREAD(M)'
| ANOVA_P | Q | |
|---|---|---|
| CA8|767 | 6.006e-08 | 0.00109 |
| GLB1L2|89944 | 1.979e-06 | 0.036 |
Figure S5. Get High-res Image As an example, this figure shows the association of CA8|767 to 'PATHOLOGICSPREAD(M)'. P value = 6.01e-08 with ANOVA analysis.
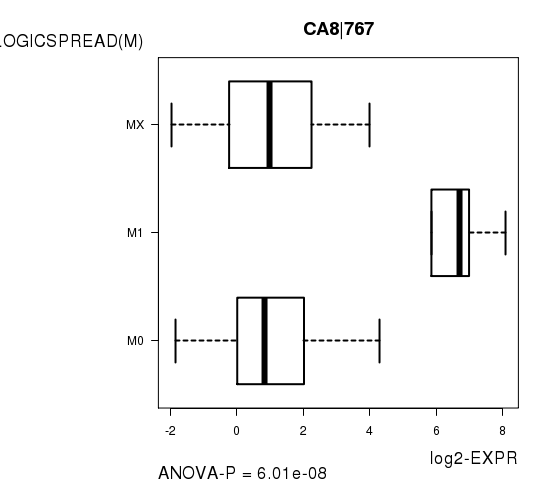
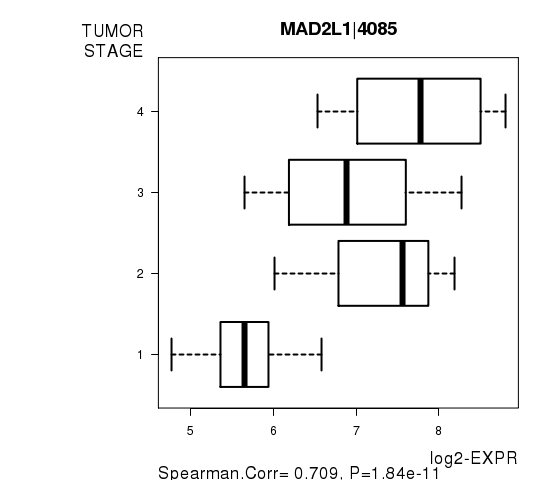
Table S13. Basic characteristics of clinical feature: 'TUMOR.STAGE'
| TUMOR.STAGE | Mean (SD) | 2.03 (1.2) |
| N | ||
| Stage 1 | 35 | |
| Stage 2 | 3 | |
| Stage 3 | 21 | |
| Stage 4 | 8 | |
| Significant markers | N = 127 | |
| pos. correlated | 110 | |
| neg. correlated | 17 |
Table S14. Get Full Table List of top 10 genes significantly correlated to 'TUMOR.STAGE' by Spearman correlation test
| SpearmanCorr | corrP | Q | |
|---|---|---|---|
| MAD2L1|4085 | 0.7093 | 1.836e-11 | 3.34e-07 |
| UCK2|7371 | 0.676 | 3.455e-10 | 6.28e-06 |
| PRCC|5546 | 0.6482 | 3.017e-09 | 5.48e-05 |
| EPR1|8475 | 0.6451 | 5.019e-09 | 9.12e-05 |
| GPR19|2842 | 0.6463 | 6.082e-09 | 0.000111 |
| TCTA|6988 | -0.6347 | 8.052e-09 | 0.000146 |
| CDCA5|113130 | 0.6219 | 1.939e-08 | 0.000352 |
| ORC6L|23594 | 0.6218 | 1.956e-08 | 0.000355 |
| TROAP|10024 | 0.6193 | 2.307e-08 | 0.000419 |
| KIF4A|24137 | 0.6183 | 2.475e-08 | 0.00045 |
Figure S6. Get High-res Image As an example, this figure shows the association of MAD2L1|4085 to 'TUMOR.STAGE'. P value = 1.84e-11 with Spearman correlation analysis.
-
Expresson data file = KIRP-TP.uncv2.mRNAseq_RSEM_normalized_log2.txt
-
Clinical data file = KIRP-TP.clin.merged.picked.txt
-
Number of patients = 75
-
Number of genes = 18174
-
Number of clinical features = 8
For survival clinical features, Wald's test in univariate Cox regression analysis with proportional hazards model (Andersen and Gill 1982) was used to estimate the P values using the 'coxph' function in R. Kaplan-Meier survival curves were plot using the four quartile subgroups of patients based on expression levels
For continuous numerical clinical features, Spearman's rank correlation coefficients (Spearman 1904) and two-tailed P values were estimated using 'cor.test' function in R
For two-class clinical features, two-tailed Student's t test with unequal variance (Lehmann and Romano 2005) was applied to compare the log2-expression levels between the two clinical classes using 't.test' function in R
For multi-class clinical features (ordinal or nominal), one-way analysis of variance (Howell 2002) was applied to compare the log2-expression levels between different clinical classes using 'anova' function in R
For multiple hypothesis correction, Q value is the False Discovery Rate (FDR) analogue of the P value (Benjamini and Hochberg 1995), defined as the minimum FDR at which the test may be called significant. We used the 'Benjamini and Hochberg' method of 'p.adjust' function in R to convert P values into Q values.
This is an experimental feature. The full results of the analysis summarized in this report can be downloaded from the TCGA Data Coordination Center.