This pipeline computes the correlation between significant copy number variation (cnv focal) genes and selected clinical features.
Testing the association between copy number variation 20 arm-level results and 3 clinical features across 191 patients, 6 significant findings detected with Q value < 0.25.
-
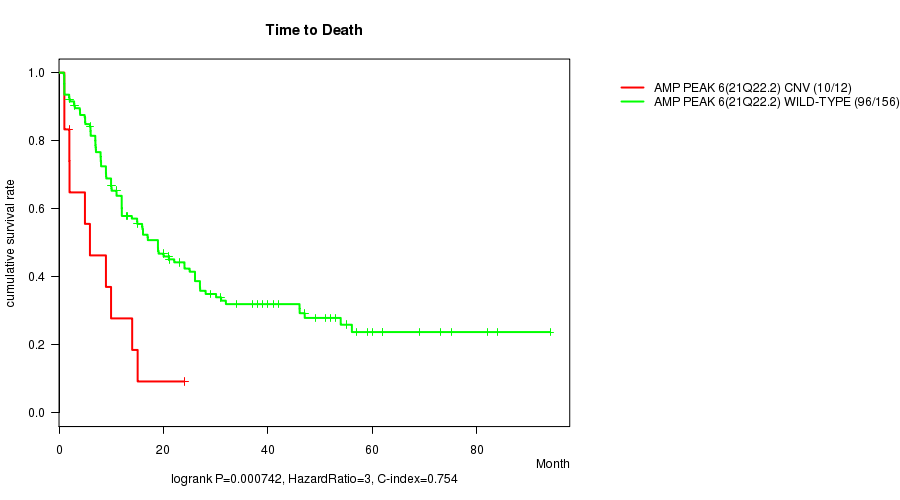
Amp Peak 6(21q22.2) cnv correlated to 'Time to Death'.
-
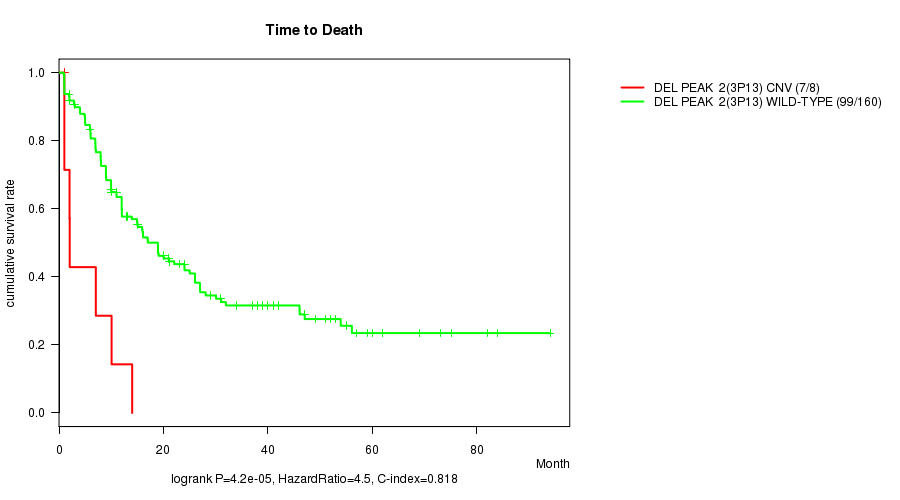
Del Peak 2(3p13) cnv correlated to 'Time to Death'.
-
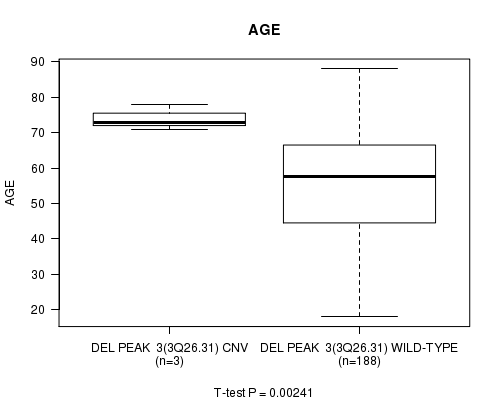
Del Peak 3(3q26.31) cnv correlated to 'AGE'.
-
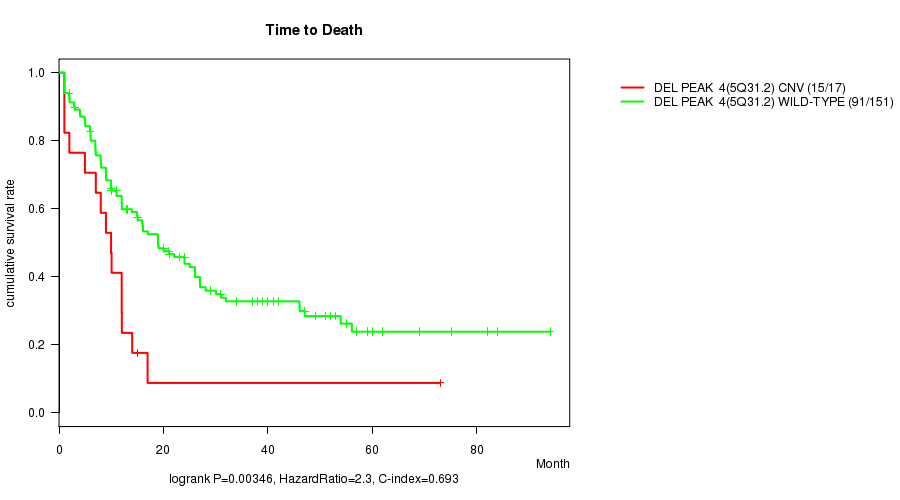
Del Peak 4(5q31.2) cnv correlated to 'Time to Death'.
-
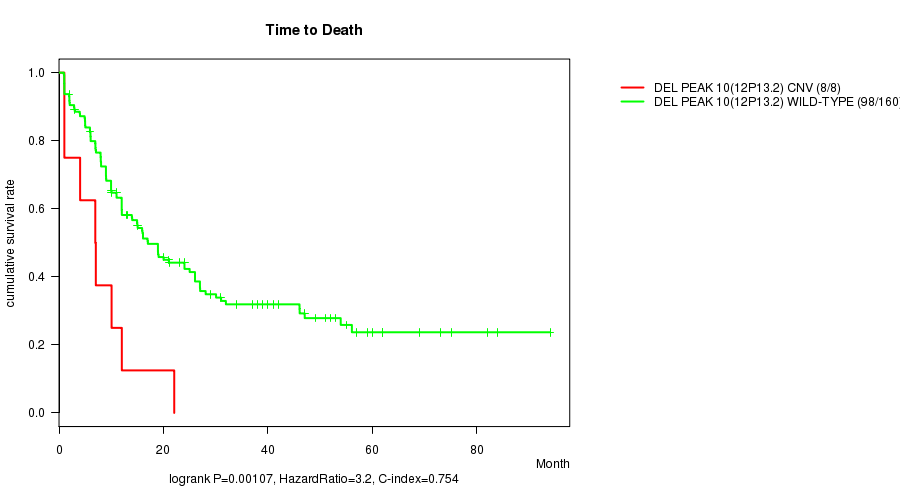
Del Peak 10(12p13.2) cnv correlated to 'Time to Death'.
-
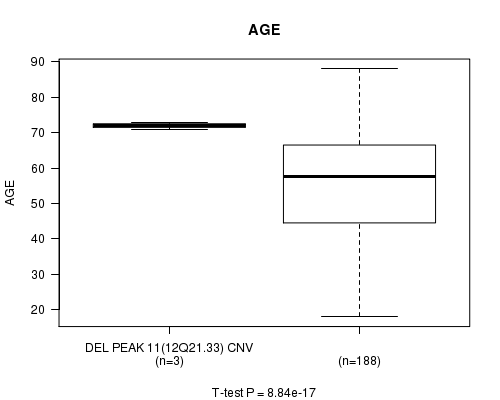
Del Peak 11(12q21.33) cnv correlated to 'AGE'.
Table 1. Get Full Table Overview of the association between significant copy number variation of 20 arm-level results and 3 clinical features. Shown in the table are P values (Q values). Thresholded by Q value < 0.25, 6 significant findings detected.
|
Clinical Features |
Time to Death |
AGE | GENDER | ||
| nCNV (%) | nWild-Type | logrank test | t-test | Fisher's exact test | |
| Amp Peak 6(21q22 2) | 0 (0%) | 177 |
0.000742 (0.0415) |
0.0657 (1.00) |
0.0922 (1.00) |
| Del Peak 2(3p13) | 0 (0%) | 182 |
4.2e-05 (0.00239) |
0.16 (1.00) |
0.185 (1.00) |
| Del Peak 3(3q26 31) | 0 (0%) | 188 |
0.00241 (0.13) |
0.252 (1.00) |
|
| Del Peak 4(5q31 2) | 0 (0%) | 173 |
0.00346 (0.183) |
0.00583 (0.297) |
0.0464 (1.00) |
| Del Peak 10(12p13 2) | 0 (0%) | 181 |
0.00107 (0.059) |
0.581 (1.00) |
0.351 (1.00) |
| Del Peak 11(12q21 33) | 0 (0%) | 188 |
8.84e-17 (5.13e-15) |
0.252 (1.00) |
|
| Amp Peak 1(1p33) | 0 (0%) | 184 |
0.34 (1.00) |
0.0372 (1.00) |
1 (1.00) |
| Amp Peak 2(1q43) | 0 (0%) | 184 |
0.737 (1.00) |
0.0234 (1.00) |
1 (1.00) |
| Amp Peak 3(11q23 3) | 0 (0%) | 174 |
0.117 (1.00) |
0.0106 (0.53) |
0.45 (1.00) |
| Amp Peak 4(13q31 3) | 0 (0%) | 184 |
0.929 (1.00) |
0.0714 (1.00) |
1 (1.00) |
| Amp Peak 5(20q11 21) | 0 (0%) | 188 |
0.116 (1.00) |
0.372 (1.00) |
0.252 (1.00) |
| Del Peak 5(7p12 1) | 0 (0%) | 175 |
0.075 (1.00) |
0.21 (1.00) |
0.604 (1.00) |
| Del Peak 6(7q32 3) | 0 (0%) | 168 |
0.0282 (1.00) |
0.0883 (1.00) |
0.656 (1.00) |
| Del Peak 7(7q34) | 0 (0%) | 167 |
0.0706 (1.00) |
0.0807 (1.00) |
0.512 (1.00) |
| Del Peak 9(9q21 32) | 0 (0%) | 186 |
0.899 (1.00) |
0.744 (1.00) |
0.378 (1.00) |
| Del Peak 12(16q23 1) | 0 (0%) | 182 |
0.126 (1.00) |
0.11 (1.00) |
0.513 (1.00) |
| Del Peak 13(17p13 2) | 0 (0%) | 176 |
0.0431 (1.00) |
0.226 (1.00) |
0.0565 (1.00) |
| Del Peak 14(17q11 2) | 0 (0%) | 178 |
0.0303 (1.00) |
0.547 (1.00) |
0.775 (1.00) |
| Del Peak 15(18p11 21) | 0 (0%) | 182 |
0.00548 (0.285) |
0.175 (1.00) |
0.185 (1.00) |
| Del Peak 16(20q13 13) | 0 (0%) | 187 |
0.0395 (1.00) |
0.113 (1.00) |
0.627 (1.00) |
P value = 0.000742 (logrank test), Q value = 0.042
Table S1. Gene #6: 'Amp Peak 6(21q22.2)' versus Clinical Feature #1: 'Time to Death'
| nPatients | nDeath | Duration Range (Median), Month | |
|---|---|---|---|
| ALL | 168 | 106 | 0.9 - 94.1 (12.0) |
| AMP PEAK 6(21Q22.2) CNV | 12 | 10 | 1.0 - 24.0 (5.4) |
| AMP PEAK 6(21Q22.2) WILD-TYPE | 156 | 96 | 0.9 - 94.1 (12.5) |
Figure S1. Get High-res Image Gene #6: 'Amp Peak 6(21q22.2)' versus Clinical Feature #1: 'Time to Death'
P value = 4.2e-05 (logrank test), Q value = 0.0024
Table S2. Gene #7: 'Del Peak 2(3p13)' versus Clinical Feature #1: 'Time to Death'
| nPatients | nDeath | Duration Range (Median), Month | |
|---|---|---|---|
| ALL | 168 | 106 | 0.9 - 94.1 (12.0) |
| DEL PEAK 2(3P13) CNV | 8 | 7 | 1.0 - 14.0 (2.0) |
| DEL PEAK 2(3P13) WILD-TYPE | 160 | 99 | 0.9 - 94.1 (12.5) |
Figure S2. Get High-res Image Gene #7: 'Del Peak 2(3p13)' versus Clinical Feature #1: 'Time to Death'
P value = 0.00241 (t-test), Q value = 0.13
Table S3. Gene #8: 'Del Peak 3(3q26.31)' versus Clinical Feature #2: 'AGE'
| nPatients | Mean (Std.Dev) | |
|---|---|---|
| ALL | 191 | 55.2 (16.1) |
| DEL PEAK 3(3Q26.31) CNV | 3 | 74.0 (3.6) |
| DEL PEAK 3(3Q26.31) WILD-TYPE | 188 | 54.9 (16.0) |
Figure S3. Get High-res Image Gene #8: 'Del Peak 3(3q26.31)' versus Clinical Feature #2: 'AGE'
P value = 0.00346 (logrank test), Q value = 0.18
Table S4. Gene #9: 'Del Peak 4(5q31.2)' versus Clinical Feature #1: 'Time to Death'
| nPatients | nDeath | Duration Range (Median), Month | |
|---|---|---|---|
| ALL | 168 | 106 | 0.9 - 94.1 (12.0) |
| DEL PEAK 4(5Q31.2) CNV | 17 | 15 | 1.0 - 73.0 (10.0) |
| DEL PEAK 4(5Q31.2) WILD-TYPE | 151 | 91 | 0.9 - 94.1 (12.9) |
Figure S4. Get High-res Image Gene #9: 'Del Peak 4(5q31.2)' versus Clinical Feature #1: 'Time to Death'
P value = 0.00107 (logrank test), Q value = 0.059
Table S5. Gene #14: 'Del Peak 10(12p13.2)' versus Clinical Feature #1: 'Time to Death'
| nPatients | nDeath | Duration Range (Median), Month | |
|---|---|---|---|
| ALL | 168 | 106 | 0.9 - 94.1 (12.0) |
| DEL PEAK 10(12P13.2) CNV | 8 | 8 | 1.0 - 22.1 (7.0) |
| DEL PEAK 10(12P13.2) WILD-TYPE | 160 | 98 | 0.9 - 94.1 (12.5) |
Figure S5. Get High-res Image Gene #14: 'Del Peak 10(12p13.2)' versus Clinical Feature #1: 'Time to Death'
P value = 8.84e-17 (t-test), Q value = 5.1e-15
Table S6. Gene #15: 'Del Peak 11(12q21.33)' versus Clinical Feature #2: 'AGE'
| nPatients | Mean (Std.Dev) | |
|---|---|---|
| ALL | 191 | 55.2 (16.1) |
| DEL PEAK 11(12Q21.33) CNV | 3 | 72.0 (1.0) |
| DEL PEAK 11(12Q21.33) WILD-TYPE | 188 | 55.0 (16.0) |
Figure S6. Get High-res Image Gene #15: 'Del Peak 11(12q21.33)' versus Clinical Feature #2: 'AGE'
-
Mutation data file = all_lesions.conf_99.cnv.cluster.txt
-
Clinical data file = LAML-TB.clin.merged.picked.txt
-
Number of patients = 191
-
Number of significantly arm-level cnvs = 20
-
Number of selected clinical features = 3
-
Exclude genes that fewer than K tumors have mutations, K = 3
For survival clinical features, the Kaplan-Meier survival curves of tumors with and without gene mutations were plotted and the statistical significance P values were estimated by logrank test (Bland and Altman 2004) using the 'survdiff' function in R
For continuous numerical clinical features, two-tailed Student's t test with unequal variance (Lehmann and Romano 2005) was applied to compare the clinical values between tumors with and without gene mutations using 't.test' function in R
For binary or multi-class clinical features (nominal or ordinal), two-tailed Fisher's exact tests (Fisher 1922) were used to estimate the P values using the 'fisher.test' function in R
For multiple hypothesis correction, Q value is the False Discovery Rate (FDR) analogue of the P value (Benjamini and Hochberg 1995), defined as the minimum FDR at which the test may be called significant. We used the 'Benjamini and Hochberg' method of 'p.adjust' function in R to convert P values into Q values.
This is an experimental feature. The full results of the analysis summarized in this report can be downloaded from the TCGA Data Coordination Center.