This pipeline uses various statistical tests to identify mRNAs whose expression levels correlated to selected clinical features.
Testing the association between 17276 genes and 3 clinical features across 173 samples, statistically thresholded by Q value < 0.05, 3 clinical features related to at least one genes.
-
8 genes correlated to 'Time to Death'.
-
MYB|4602 , PWWP2A|114825 , CLINT1|9685 , IL2RA|3559 , ADSS|159 , ...
-
12 genes correlated to 'AGE'.
-
GBP2|2634 , PI4K2A|55361 , FBXO32|114907 , C7ORF58|79974 , SLC22A16|85413 , ...
-
17 genes correlated to 'GENDER'.
-
PRKY|5616 , XIST|7503 , TSIX|9383 , ZFY|7544 , UTY|7404 , ...
Complete statistical result table is provided in Supplement Table 1
Table 1. Get Full Table This table shows the clinical features, statistical methods used, and the number of genes that are significantly associated with each clinical feature at Q value < 0.05.
| Clinical feature | Statistical test | Significant genes | Associated with | Associated with | ||
|---|---|---|---|---|---|---|
| Time to Death | Cox regression test | N=8 | shorter survival | N=2 | longer survival | N=6 |
| AGE | Spearman correlation test | N=12 | older | N=10 | younger | N=2 |
| GENDER | t test | N=17 | male | N=4 | female | N=13 |
Table S1. Basic characteristics of clinical feature: 'Time to Death'
| Time to Death | Duration (Months) | 0.9-94.1 (median=12) |
| censored | N = 57 | |
| death | N = 92 | |
| Significant markers | N = 8 | |
| associated with shorter survival | 2 | |
| associated with longer survival | 6 |
Table S2. Get Full Table List of 8 genes significantly associated with 'Time to Death' by Cox regression test
| HazardRatio | Wald_P | Q | C_index | |
|---|---|---|---|---|
| MYB|4602 | 0.53 | 5.867e-07 | 0.01 | 0.34 |
| PWWP2A|114825 | 0.37 | 8.601e-07 | 0.015 | 0.337 |
| CLINT1|9685 | 0.31 | 1.159e-06 | 0.02 | 0.363 |
| IL2RA|3559 | 1.24 | 1.602e-06 | 0.028 | 0.644 |
| ADSS|159 | 0.29 | 1.994e-06 | 0.034 | 0.332 |
| C10ORF128|170371 | 1.27 | 2.079e-06 | 0.036 | 0.654 |
| C2ORF67|151050 | 0.54 | 2.341e-06 | 0.04 | 0.329 |
| GMCL1|64395 | 0.42 | 2.758e-06 | 0.048 | 0.385 |
Figure S1. Get High-res Image As an example, this figure shows the association of MYB|4602 to 'Time to Death'. four curves present the cumulative survival rates of 4 quartile subsets of patients. P value = 5.87e-07 with univariate Cox regression analysis using continuous log-2 expression values.
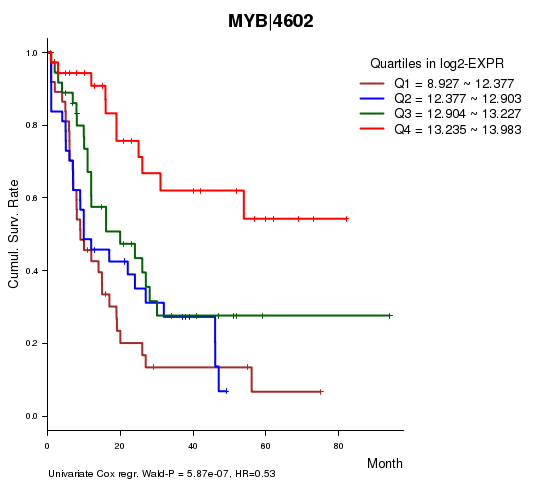
Table S3. Basic characteristics of clinical feature: 'AGE'
| AGE | Mean (SD) | 55.26 (16) |
| Significant markers | N = 12 | |
| pos. correlated | 10 | |
| neg. correlated | 2 |
Table S4. Get Full Table List of top 10 genes significantly correlated to 'AGE' by Spearman correlation test
| SpearmanCorr | corrP | Q | |
|---|---|---|---|
| GBP2|2634 | 0.4101 | 2.097e-08 | 0.000362 |
| PI4K2A|55361 | 0.4064 | 2.889e-08 | 0.000499 |
| FBXO32|114907 | 0.3685 | 6.076e-07 | 0.0105 |
| C7ORF58|79974 | 0.3723 | 6.221e-07 | 0.0107 |
| SLC22A16|85413 | -0.3627 | 9.392e-07 | 0.0162 |
| HK2|3099 | -0.3621 | 9.824e-07 | 0.017 |
| PPARD|5467 | 0.358 | 1.325e-06 | 0.0229 |
| STK16|8576 | 0.355 | 1.643e-06 | 0.0284 |
| TMEM117|84216 | 0.3703 | 1.679e-06 | 0.029 |
| KLRF1|51348 | 0.3506 | 2.251e-06 | 0.0389 |
Figure S2. Get High-res Image As an example, this figure shows the association of GBP2|2634 to 'AGE'. P value = 2.1e-08 with Spearman correlation analysis. The straight line presents the best linear regression.
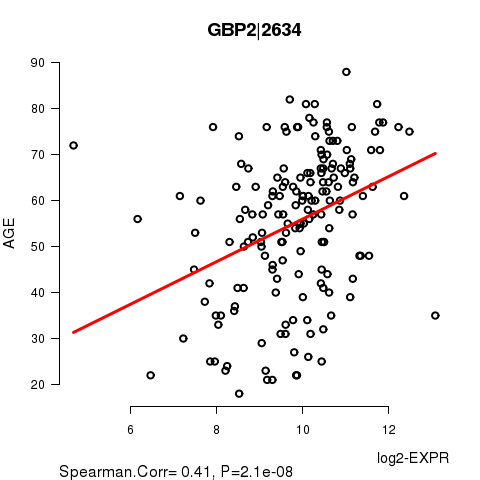
Table S5. Basic characteristics of clinical feature: 'GENDER'
| GENDER | Labels | N |
| FEMALE | 80 | |
| MALE | 93 | |
| Significant markers | N = 17 | |
| Higher in MALE | 4 | |
| Higher in FEMALE | 13 |
Table S6. Get Full Table List of top 10 genes differentially expressed by 'GENDER'
| T(pos if higher in 'MALE') | ttestP | Q | AUC | |
|---|---|---|---|---|
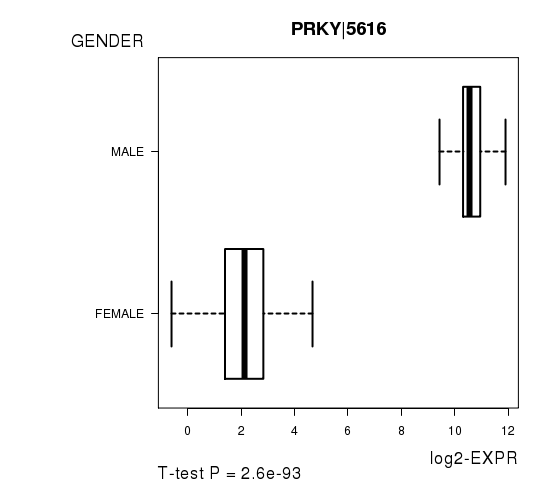
| PRKY|5616 | 52.08 | 2.604e-93 | 4.5e-89 | 1 |
| XIST|7503 | -44.33 | 3.364e-82 | 5.81e-78 | 0.9995 |
| TSIX|9383 | -33.18 | 2.43e-66 | 4.19e-62 | 0.9998 |
| ZFY|7544 | 56.47 | 1.64e-49 | 2.83e-45 | 1 |
| UTY|7404 | 68.34 | 1.127e-29 | 1.95e-25 | 1 |
| PRKX|5613 | -12.96 | 3.466e-27 | 5.98e-23 | 0.9194 |
| KDM5C|8242 | -10.21 | 7.258e-19 | 1.25e-14 | 0.8719 |
| NCRNA00183|554203 | -9.4 | 7.232e-17 | 1.25e-12 | 0.8442 |
| ZFX|7543 | -9.25 | 2.677e-16 | 4.62e-12 | 0.8653 |
| ZRSR2|8233 | -9.07 | 1.408e-15 | 2.43e-11 | 0.8535 |
Figure S3. Get High-res Image As an example, this figure shows the association of PRKY|5616 to 'GENDER'. P value = 2.6e-93 with T-test analysis.
-
Expresson data file = LAML-TB.uncv2.mRNAseq_RSEM_normalized_log2.txt
-
Clinical data file = LAML-TB.clin.merged.picked.txt
-
Number of patients = 173
-
Number of genes = 17276
-
Number of clinical features = 3
For survival clinical features, Wald's test in univariate Cox regression analysis with proportional hazards model (Andersen and Gill 1982) was used to estimate the P values using the 'coxph' function in R. Kaplan-Meier survival curves were plot using the four quartile subgroups of patients based on expression levels
For continuous numerical clinical features, Spearman's rank correlation coefficients (Spearman 1904) and two-tailed P values were estimated using 'cor.test' function in R
For two-class clinical features, two-tailed Student's t test with unequal variance (Lehmann and Romano 2005) was applied to compare the log2-expression levels between the two clinical classes using 't.test' function in R
For multiple hypothesis correction, Q value is the False Discovery Rate (FDR) analogue of the P value (Benjamini and Hochberg 1995), defined as the minimum FDR at which the test may be called significant. We used the 'Benjamini and Hochberg' method of 'p.adjust' function in R to convert P values into Q values.
This is an experimental feature. The full results of the analysis summarized in this report can be downloaded from the TCGA Data Coordination Center.