This pipeline uses various statistical tests to identify genes whose promoter methylation levels correlated to selected clinical features.
Testing the association between 17401 genes and 7 clinical features across 198 samples, statistically thresholded by Q value < 0.05, 5 clinical features related to at least one genes.
-
444 genes correlated to 'Time to Death'.
-
HS3ST4 , SSTR1 , RAB6C , ZNF492 , GALNT14 , ...
-
146 genes correlated to 'AGE'.
-
CD163L1 , HOXD8 , LOC150786 , ADAMTSL3 , PAX9 , ...
-
10 genes correlated to 'GENDER'.
-
UTP14C , POLDIP3 , GLUD1 , WBP11P1 , TFDP1 , ...
-
877 genes correlated to 'HISTOLOGICAL.TYPE'.
-
BVES , REST , MAPKAP1 , SNAPC2 , SLC2A4RG , ...
-
57 genes correlated to 'HISTOLOGICCLASSIFICATION'.
-
SLC11A2 , FMOD , ADAM19 , PRDM1 , SCGB1A1 , ...
-
No genes correlated to 'KARNOFSKY.PERFORMANCE.SCORE', and 'RADIATIONS.RADIATION.REGIMENINDICATION'.
Complete statistical result table is provided in Supplement Table 1
Table 1. Get Full Table This table shows the clinical features, statistical methods used, and the number of genes that are significantly associated with each clinical feature at Q value < 0.05.
| Clinical feature | Statistical test | Significant genes | Associated with | Associated with | ||
|---|---|---|---|---|---|---|
| Time to Death | Cox regression test | N=444 | shorter survival | N=76 | longer survival | N=368 |
| AGE | Spearman correlation test | N=146 | older | N=118 | younger | N=28 |
| GENDER | t test | N=10 | male | N=4 | female | N=6 |
| KARNOFSKY PERFORMANCE SCORE | Spearman correlation test | N=0 | ||||
| HISTOLOGICAL TYPE | ANOVA test | N=877 | ||||
| HISTOLOGICCLASSIFICATION | t test | N=57 | grade iii | N=3 | grade ii | N=54 |
| RADIATIONS RADIATION REGIMENINDICATION | t test | N=0 |
Table S1. Basic characteristics of clinical feature: 'Time to Death'
| Time to Death | Duration (Months) | 0-211.2 (median=13.4) |
| censored | N = 152 | |
| death | N = 45 | |
| Significant markers | N = 444 | |
| associated with shorter survival | 76 | |
| associated with longer survival | 368 |
Table S2. Get Full Table List of top 10 genes significantly associated with 'Time to Death' by Cox regression test
| HazardRatio | Wald_P | Q | C_index | |
|---|---|---|---|---|
| HS3ST4 | 191 | 3.061e-12 | 5.3e-08 | 0.77 |
| SSTR1 | 161 | 1.954e-11 | 3.4e-07 | 0.782 |
| RAB6C | 2401 | 3.114e-11 | 5.4e-07 | 0.801 |
| ZNF492 | 86 | 3.509e-11 | 6.1e-07 | 0.675 |
| GALNT14 | 121 | 6.793e-11 | 1.2e-06 | 0.793 |
| HPD | 0 | 6.994e-11 | 1.2e-06 | 0.293 |
| IRF2 | 0 | 7.467e-11 | 1.3e-06 | 0.321 |
| CD274 | 0.01 | 8.081e-11 | 1.4e-06 | 0.283 |
| LPAR3 | 171 | 1.012e-10 | 1.8e-06 | 0.75 |
| ATF3 | 0 | 1.472e-10 | 2.6e-06 | 0.277 |
Figure S1. Get High-res Image As an example, this figure shows the association of HS3ST4 to 'Time to Death'. four curves present the cumulative survival rates of 4 quartile subsets of patients. P value = 3.06e-12 with univariate Cox regression analysis using continuous log-2 expression values.
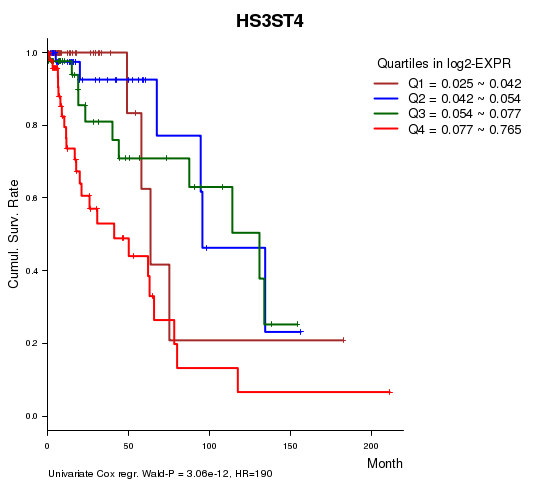
Table S3. Basic characteristics of clinical feature: 'AGE'
| AGE | Mean (SD) | 43.01 (13) |
| Significant markers | N = 146 | |
| pos. correlated | 118 | |
| neg. correlated | 28 |
Table S4. Get Full Table List of top 10 genes significantly correlated to 'AGE' by Spearman correlation test
| SpearmanCorr | corrP | Q | |
|---|---|---|---|
| CD163L1 | 0.541 | 1.899e-16 | 3.3e-12 |
| HOXD8 | 0.528 | 1.31e-15 | 2.28e-11 |
| LOC150786 | 0.5218 | 3.209e-15 | 5.58e-11 |
| ADAMTSL3 | 0.5028 | 4.405e-14 | 7.66e-10 |
| PAX9 | 0.4997 | 6.628e-14 | 1.15e-09 |
| SLC18A2 | 0.4947 | 1.278e-13 | 2.22e-09 |
| GALNT14 | 0.4835 | 5.35e-13 | 9.31e-09 |
| RAB6C | 0.4805 | 7.876e-13 | 1.37e-08 |
| SSTR4 | 0.474 | 1.738e-12 | 3.02e-08 |
| HOXD11 | 0.4659 | 4.637e-12 | 8.06e-08 |
Figure S2. Get High-res Image As an example, this figure shows the association of CD163L1 to 'AGE'. P value = 1.9e-16 with Spearman correlation analysis. The straight line presents the best linear regression.
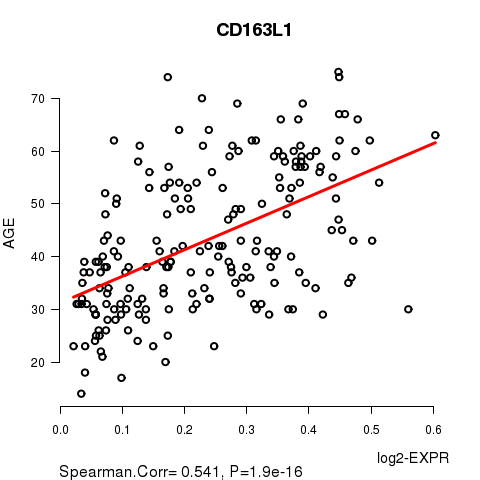
Table S5. Basic characteristics of clinical feature: 'GENDER'
| GENDER | Labels | N |
| FEMALE | 87 | |
| MALE | 111 | |
| Significant markers | N = 10 | |
| Higher in MALE | 4 | |
| Higher in FEMALE | 6 |
Table S6. Get Full Table List of 10 genes differentially expressed by 'GENDER'
| T(pos if higher in 'MALE') | ttestP | Q | AUC | |
|---|---|---|---|---|
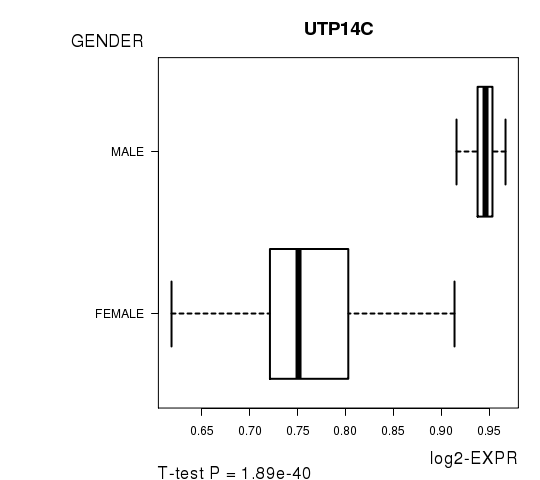
| UTP14C | 20.98 | 1.893e-40 | 3.29e-36 | 0.9765 |
| POLDIP3 | -15.04 | 1.41e-30 | 2.45e-26 | 0.941 |
| GLUD1 | -10.5 | 1.188e-20 | 2.07e-16 | 0.8288 |
| WBP11P1 | 8.41 | 1.752e-14 | 3.05e-10 | 0.8308 |
| TFDP1 | -7.32 | 7.71e-12 | 1.34e-07 | 0.8671 |
| FAM35A | -7.01 | 9.371e-11 | 1.63e-06 | 0.7708 |
| KIF4B | -6.94 | 1.181e-10 | 2.05e-06 | 0.7522 |
| ZNF839 | -5.84 | 2.583e-08 | 0.000449 | 0.7724 |
| CCDC121 | 5.48 | 1.629e-07 | 0.00283 | 0.7258 |
| AES | 5.34 | 2.56e-07 | 0.00445 | 0.7116 |
Figure S3. Get High-res Image As an example, this figure shows the association of UTP14C to 'GENDER'. P value = 1.89e-40 with T-test analysis.
No gene related to 'KARNOFSKY.PERFORMANCE.SCORE'.
Table S7. Basic characteristics of clinical feature: 'KARNOFSKY.PERFORMANCE.SCORE'
| KARNOFSKY.PERFORMANCE.SCORE | Mean (SD) | 88.28 (11) |
| Significant markers | N = 0 |
Table S8. Basic characteristics of clinical feature: 'HISTOLOGICAL.TYPE'
| HISTOLOGICAL.TYPE | Labels | N |
| ASTROCYTOMA | 58 | |
| OLIGOASTROCYTOMA | 52 | |
| OLIGODENDROGLIOMA | 87 | |
| Significant markers | N = 877 |
Table S9. Get Full Table List of top 10 genes differentially expressed by 'HISTOLOGICAL.TYPE'
| ANOVA_P | Q | |
|---|---|---|
| BVES | 9.878e-17 | 1.72e-12 |
| REST | 6.399e-16 | 1.11e-11 |
| MAPKAP1 | 2.878e-15 | 5.01e-11 |
| SNAPC2 | 3.397e-15 | 5.91e-11 |
| SLC2A4RG | 8.053e-15 | 1.4e-10 |
| GLIS3 | 9.227e-15 | 1.61e-10 |
| S100PBP | 1.956e-14 | 3.4e-10 |
| EMP1 | 5.592e-14 | 9.73e-10 |
| CBX2 | 5.991e-14 | 1.04e-09 |
| NFIA | 6.401e-14 | 1.11e-09 |
Figure S4. Get High-res Image As an example, this figure shows the association of BVES to 'HISTOLOGICAL.TYPE'. P value = 9.88e-17 with ANOVA analysis.
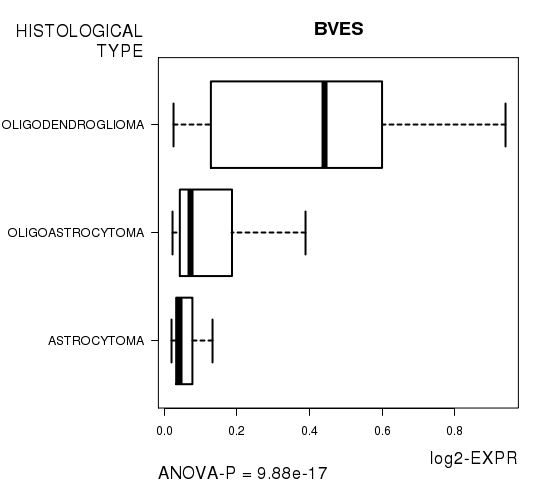
Table S10. Basic characteristics of clinical feature: 'HISTOLOGICCLASSIFICATION'
| HISTOLOGICCLASSIFICATION | Labels | N |
| GRADE II | 91 | |
| GRADE III | 106 | |
| Significant markers | N = 57 | |
| Higher in GRADE III | 3 | |
| Higher in GRADE II | 54 |
Table S11. Get Full Table List of top 10 genes differentially expressed by 'HISTOLOGICCLASSIFICATION'
| T(pos if higher in 'GRADE III') | ttestP | Q | AUC | |
|---|---|---|---|---|
| SLC11A2 | 5.68 | 6.049e-08 | 0.00105 | 0.6889 |
| FMOD | -5.51 | 1.562e-07 | 0.00272 | 0.6706 |
| ADAM19 | -5.43 | 1.905e-07 | 0.00332 | 0.7028 |
| PRDM1 | -5.46 | 2.092e-07 | 0.00364 | 0.7019 |
| SCGB1A1 | -5.44 | 2.216e-07 | 0.00386 | 0.6815 |
| MUC12 | -5.32 | 3.037e-07 | 0.00528 | 0.7182 |
| A4GNT | -5.34 | 3.039e-07 | 0.00529 | 0.6756 |
| LDLRAD2 | -5.35 | 3.196e-07 | 0.00556 | 0.6767 |
| LCE1E | -5.24 | 4.288e-07 | 0.00746 | 0.6968 |
| NR5A1 | -5.23 | 4.705e-07 | 0.00818 | 0.6865 |
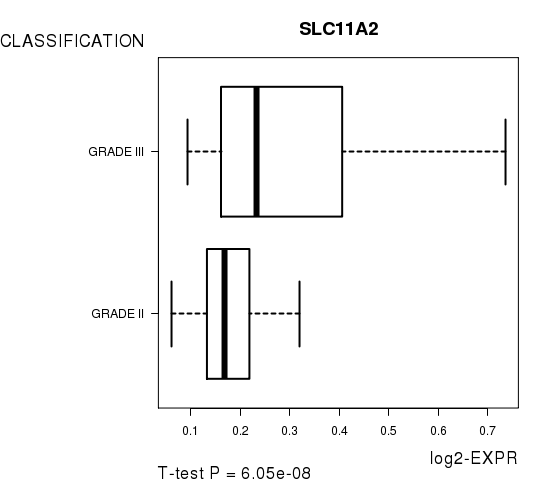
Figure S5. Get High-res Image As an example, this figure shows the association of SLC11A2 to 'HISTOLOGICCLASSIFICATION'. P value = 6.05e-08 with T-test analysis.
No gene related to 'RADIATIONS.RADIATION.REGIMENINDICATION'.
Table S12. Basic characteristics of clinical feature: 'RADIATIONS.RADIATION.REGIMENINDICATION'
| RADIATIONS.RADIATION.REGIMENINDICATION | Labels | N |
| NO | 98 | |
| YES | 100 | |
| Significant markers | N = 0 |
-
Expresson data file = LGG-TP.meth.for_correlation.filtered_data.txt
-
Clinical data file = LGG-TP.clin.merged.picked.txt
-
Number of patients = 198
-
Number of genes = 17401
-
Number of clinical features = 7
For survival clinical features, Wald's test in univariate Cox regression analysis with proportional hazards model (Andersen and Gill 1982) was used to estimate the P values using the 'coxph' function in R. Kaplan-Meier survival curves were plot using the four quartile subgroups of patients based on expression levels
For continuous numerical clinical features, Spearman's rank correlation coefficients (Spearman 1904) and two-tailed P values were estimated using 'cor.test' function in R
For two-class clinical features, two-tailed Student's t test with unequal variance (Lehmann and Romano 2005) was applied to compare the log2-expression levels between the two clinical classes using 't.test' function in R
For multi-class clinical features (ordinal or nominal), one-way analysis of variance (Howell 2002) was applied to compare the log2-expression levels between different clinical classes using 'anova' function in R
For multiple hypothesis correction, Q value is the False Discovery Rate (FDR) analogue of the P value (Benjamini and Hochberg 1995), defined as the minimum FDR at which the test may be called significant. We used the 'Benjamini and Hochberg' method of 'p.adjust' function in R to convert P values into Q values.
This is an experimental feature. The full results of the analysis summarized in this report can be downloaded from the TCGA Data Coordination Center.