This pipeline computes the correlation between significantly recurrent gene mutations and selected clinical features.
Testing the association between mutation status of 37 genes and 7 clinical features across 204 patients, 14 significant findings detected with Q value < 0.25.
-
IDH1 mutation correlated to 'Time to Death' and 'HISTOLOGICCLASSIFICATION'.
-
TP53 mutation correlated to 'AGE', 'HISTOLOGICAL.TYPE', and 'RADIATIONS.RADIATION.REGIMENINDICATION'.
-
ATRX mutation correlated to 'AGE' and 'HISTOLOGICAL.TYPE'.
-
FUBP1 mutation correlated to 'HISTOLOGICAL.TYPE'.
-
CIC mutation correlated to 'HISTOLOGICAL.TYPE'.
-
NOTCH1 mutation correlated to 'HISTOLOGICAL.TYPE'.
-
PTEN mutation correlated to 'HISTOLOGICAL.TYPE'.
-
EGFR mutation correlated to 'AGE' and 'KARNOFSKY.PERFORMANCE.SCORE'.
-
SPDYE5 mutation correlated to 'Time to Death'.
Table 1. Get Full Table Overview of the association between mutation status of 37 genes and 7 clinical features. Shown in the table are P values (Q values). Thresholded by Q value < 0.25, 14 significant findings detected.
|
Clinical Features |
Time to Death |
AGE | GENDER |
KARNOFSKY PERFORMANCE SCORE |
HISTOLOGICAL TYPE |
HISTOLOGICCLASSIFICATION |
RADIATIONS RADIATION REGIMENINDICATION |
||
| nMutated (%) | nWild-Type | logrank test | t-test | Fisher's exact test | t-test | Fisher's exact test | Fisher's exact test | Fisher's exact test | |
| TP53 | 105 (51%) | 99 |
0.17 (1.00) |
1.1e-06 (0.000262) |
0.157 (1.00) |
0.45 (1.00) |
4.95e-07 (0.000118) |
0.778 (1.00) |
4.33e-05 (0.0102) |
| IDH1 | 157 (77%) | 47 |
0.000178 (0.0414) |
0.0292 (1.00) |
0.0186 (1.00) |
0.842 (1.00) |
0.00713 (1.00) |
0.000429 (0.0987) |
0.62 (1.00) |
| ATRX | 87 (43%) | 117 |
0.106 (1.00) |
1.65e-05 (0.00389) |
0.476 (1.00) |
0.522 (1.00) |
5.21e-05 (0.0122) |
0.089 (1.00) |
0.00191 (0.431) |
| EGFR | 10 (5%) | 194 |
0.0285 (1.00) |
0.000197 (0.0456) |
0.745 (1.00) |
9.41e-12 (2.26e-09) |
0.12 (1.00) |
0.0227 (1.00) |
0.535 (1.00) |
| FUBP1 | 22 (11%) | 182 |
0.743 (1.00) |
0.00634 (1.00) |
1 (1.00) |
0.711 (1.00) |
0.000973 (0.221) |
0.375 (1.00) |
0.181 (1.00) |
| CIC | 40 (20%) | 164 |
0.0807 (1.00) |
0.587 (1.00) |
0.723 (1.00) |
0.718 (1.00) |
1.25e-09 (2.98e-07) |
0.598 (1.00) |
0.0345 (1.00) |
| NOTCH1 | 18 (9%) | 186 |
0.777 (1.00) |
0.0158 (1.00) |
0.318 (1.00) |
0.119 (1.00) |
0.000211 (0.0487) |
0.139 (1.00) |
0.333 (1.00) |
| PTEN | 11 (5%) | 193 |
0.279 (1.00) |
0.0305 (1.00) |
0.532 (1.00) |
0.000493 (0.113) |
0.0125 (1.00) |
0.766 (1.00) |
|
| SPDYE5 | 3 (1%) | 201 |
0.00076 (0.173) |
0.227 (1.00) |
0.574 (1.00) |
0.655 (1.00) |
0.347 (1.00) |
1 (1.00) |
0.12 (1.00) |
| IDH2 | 8 (4%) | 196 |
0.532 (1.00) |
0.148 (1.00) |
1 (1.00) |
0.0399 (1.00) |
0.474 (1.00) |
0.721 (1.00) |
|
| IL32 | 5 (2%) | 199 |
0.00837 (1.00) |
0.285 (1.00) |
1 (1.00) |
0.14 (1.00) |
1 (1.00) |
0.378 (1.00) |
0.0283 (1.00) |
| PIK3R1 | 14 (7%) | 190 |
0.196 (1.00) |
0.0624 (1.00) |
0.403 (1.00) |
0.674 (1.00) |
0.603 (1.00) |
1 (1.00) |
1 (1.00) |
| PIK3CA | 19 (9%) | 185 |
0.778 (1.00) |
0.47 (1.00) |
0.808 (1.00) |
0.351 (1.00) |
0.148 (1.00) |
1 (1.00) |
0.479 (1.00) |
| NF1 | 15 (7%) | 189 |
0.0409 (1.00) |
0.7 (1.00) |
0.421 (1.00) |
0.751 (1.00) |
0.0368 (1.00) |
0.0568 (1.00) |
0.593 (1.00) |
| ZNF844 | 4 (2%) | 200 |
0.376 (1.00) |
0.998 (1.00) |
1 (1.00) |
0.69 (1.00) |
0.627 (1.00) |
1 (1.00) |
|
| TCF12 | 9 (4%) | 195 |
0.921 (1.00) |
0.133 (1.00) |
0.497 (1.00) |
0.317 (1.00) |
0.623 (1.00) |
0.512 (1.00) |
0.0991 (1.00) |
| ZBTB20 | 8 (4%) | 196 |
0.171 (1.00) |
0.541 (1.00) |
0.472 (1.00) |
0.593 (1.00) |
0.146 (1.00) |
0.168 (1.00) |
|
| TIMD4 | 5 (2%) | 199 |
0.103 (1.00) |
0.175 (1.00) |
0.652 (1.00) |
0.14 (1.00) |
1 (1.00) |
1 (1.00) |
0.21 (1.00) |
| CREBZF | 4 (2%) | 200 |
0.648 (1.00) |
0.22 (1.00) |
0.312 (1.00) |
0.291 (1.00) |
0.477 (1.00) |
0.127 (1.00) |
1 (1.00) |
| ZNF57 | 6 (3%) | 198 |
0.249 (1.00) |
0.759 (1.00) |
0.242 (1.00) |
0.149 (1.00) |
0.69 (1.00) |
1 (1.00) |
|
| ARID1A | 11 (5%) | 193 |
0.0603 (1.00) |
0.799 (1.00) |
0.123 (1.00) |
0.351 (1.00) |
0.62 (1.00) |
0.554 (1.00) |
0.538 (1.00) |
| EMG1 | 4 (2%) | 200 |
0.53 (1.00) |
0.583 (1.00) |
0.64 (1.00) |
0.581 (1.00) |
0.627 (1.00) |
0.621 (1.00) |
|
| PRAMEF11 | 6 (3%) | 198 |
0.129 (1.00) |
0.577 (1.00) |
0.698 (1.00) |
1 (1.00) |
0.69 (1.00) |
1 (1.00) |
|
| PRDM9 | 6 (3%) | 198 |
0.266 (1.00) |
0.321 (1.00) |
0.698 (1.00) |
0.149 (1.00) |
0.69 (1.00) |
0.683 (1.00) |
|
| NOX4 | 5 (2%) | 199 |
0.475 (1.00) |
0.494 (1.00) |
1 (1.00) |
0.727 (1.00) |
0.378 (1.00) |
1 (1.00) |
|
| ANKRD30A | 8 (4%) | 196 |
0.212 (1.00) |
0.018 (1.00) |
0.472 (1.00) |
0.265 (1.00) |
1 (1.00) |
1 (1.00) |
|
| MUC7 | 4 (2%) | 200 |
0.145 (1.00) |
0.462 (1.00) |
1 (1.00) |
0.816 (1.00) |
0.627 (1.00) |
1 (1.00) |
|
| PAX4 | 5 (2%) | 199 |
0.373 (1.00) |
0.0046 (1.00) |
0.652 (1.00) |
0.448 (1.00) |
0.662 (1.00) |
0.681 (1.00) |
|
| ZNF845 | 6 (3%) | 198 |
0.353 (1.00) |
0.795 (1.00) |
0.698 (1.00) |
0.878 (1.00) |
0.69 (1.00) |
0.212 (1.00) |
|
| C15ORF2 | 8 (4%) | 196 |
0.934 (1.00) |
0.0976 (1.00) |
1 (1.00) |
0.235 (1.00) |
0.729 (1.00) |
0.721 (1.00) |
|
| SCAF1 | 4 (2%) | 200 |
0.133 (1.00) |
0.479 (1.00) |
0.0303 (1.00) |
0.816 (1.00) |
0.627 (1.00) |
0.621 (1.00) |
|
| FSTL5 | 6 (3%) | 198 |
0.986 (1.00) |
0.531 (1.00) |
1 (1.00) |
0.43 (1.00) |
0.69 (1.00) |
0.683 (1.00) |
|
| C9ORF79 | 8 (4%) | 196 |
0.392 (1.00) |
0.502 (1.00) |
0.723 (1.00) |
0.0712 (1.00) |
0.732 (1.00) |
0.0726 (1.00) |
0.279 (1.00) |
| ZCCHC12 | 3 (1%) | 201 |
0.56 (1.00) |
0.757 (1.00) |
0.574 (1.00) |
0.258 (1.00) |
1 (1.00) |
1 (1.00) |
|
| SMARCA4 | 12 (6%) | 192 |
0.042 (1.00) |
0.282 (1.00) |
0.565 (1.00) |
0.0229 (1.00) |
0.332 (1.00) |
1 (1.00) |
0.373 (1.00) |
| MYH4 | 5 (2%) | 199 |
0.176 (1.00) |
0.518 (1.00) |
0.164 (1.00) |
0.329 (1.00) |
1 (1.00) |
1 (1.00) |
|
| TRDN | 3 (1%) | 201 |
0.122 (1.00) |
0.378 (1.00) |
1 (1.00) |
1 (1.00) |
1 (1.00) |
0.246 (1.00) |
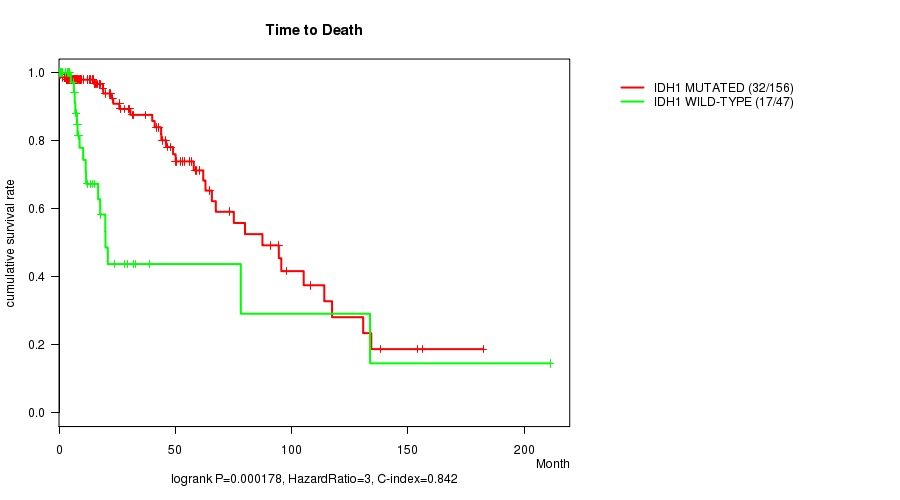
P value = 0.000178 (logrank test), Q value = 0.041
Table S1. Gene #1: 'IDH1 MUTATION STATUS' versus Clinical Feature #1: 'Time to Death'
| nPatients | nDeath | Duration Range (Median), Month | |
|---|---|---|---|
| ALL | 203 | 49 | 0.0 - 211.2 (13.4) |
| IDH1 MUTATED | 156 | 32 | 0.0 - 182.3 (15.2) |
| IDH1 WILD-TYPE | 47 | 17 | 0.1 - 211.2 (8.4) |
Figure S1. Get High-res Image Gene #1: 'IDH1 MUTATION STATUS' versus Clinical Feature #1: 'Time to Death'
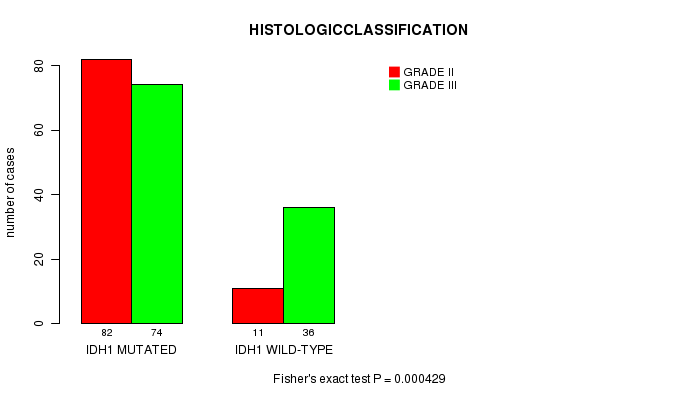
P value = 0.000429 (Fisher's exact test), Q value = 0.099
Table S2. Gene #1: 'IDH1 MUTATION STATUS' versus Clinical Feature #6: 'HISTOLOGICCLASSIFICATION'
| nPatients | GRADE II | GRADE III |
|---|---|---|
| ALL | 93 | 110 |
| IDH1 MUTATED | 82 | 74 |
| IDH1 WILD-TYPE | 11 | 36 |
Figure S2. Get High-res Image Gene #1: 'IDH1 MUTATION STATUS' versus Clinical Feature #6: 'HISTOLOGICCLASSIFICATION'
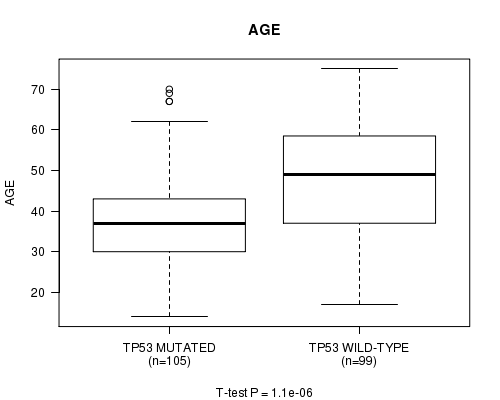
P value = 1.1e-06 (t-test), Q value = 0.00026
Table S3. Gene #4: 'TP53 MUTATION STATUS' versus Clinical Feature #2: 'AGE'
| nPatients | Mean (Std.Dev) | |
|---|---|---|
| ALL | 204 | 43.0 (13.3) |
| TP53 MUTATED | 105 | 38.7 (11.8) |
| TP53 WILD-TYPE | 99 | 47.6 (13.3) |
Figure S3. Get High-res Image Gene #4: 'TP53 MUTATION STATUS' versus Clinical Feature #2: 'AGE'
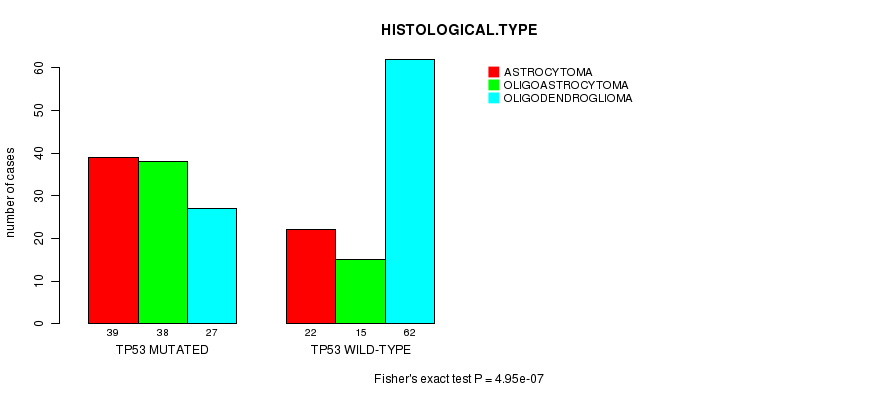
P value = 4.95e-07 (Fisher's exact test), Q value = 0.00012
Table S4. Gene #4: 'TP53 MUTATION STATUS' versus Clinical Feature #5: 'HISTOLOGICAL.TYPE'
| nPatients | ASTROCYTOMA | OLIGOASTROCYTOMA | OLIGODENDROGLIOMA |
|---|---|---|---|
| ALL | 61 | 53 | 89 |
| TP53 MUTATED | 39 | 38 | 27 |
| TP53 WILD-TYPE | 22 | 15 | 62 |
Figure S4. Get High-res Image Gene #4: 'TP53 MUTATION STATUS' versus Clinical Feature #5: 'HISTOLOGICAL.TYPE'
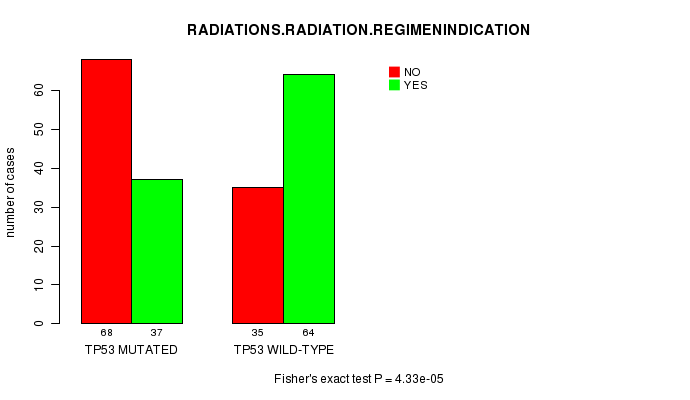
P value = 4.33e-05 (Fisher's exact test), Q value = 0.01
Table S5. Gene #4: 'TP53 MUTATION STATUS' versus Clinical Feature #7: 'RADIATIONS.RADIATION.REGIMENINDICATION'
| nPatients | NO | YES |
|---|---|---|
| ALL | 103 | 101 |
| TP53 MUTATED | 68 | 37 |
| TP53 WILD-TYPE | 35 | 64 |
Figure S5. Get High-res Image Gene #4: 'TP53 MUTATION STATUS' versus Clinical Feature #7: 'RADIATIONS.RADIATION.REGIMENINDICATION'
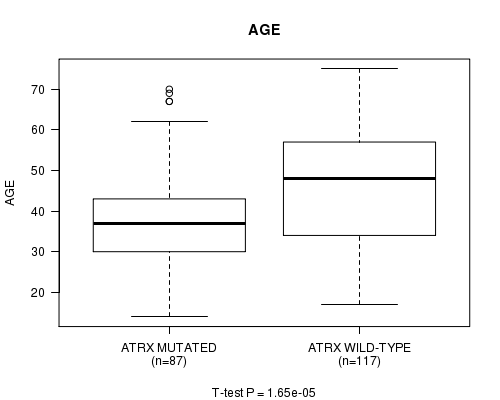
P value = 1.65e-05 (t-test), Q value = 0.0039
Table S6. Gene #7: 'ATRX MUTATION STATUS' versus Clinical Feature #2: 'AGE'
| nPatients | Mean (Std.Dev) | |
|---|---|---|
| ALL | 204 | 43.0 (13.3) |
| ATRX MUTATED | 87 | 38.5 (12.1) |
| ATRX WILD-TYPE | 117 | 46.4 (13.2) |
Figure S6. Get High-res Image Gene #7: 'ATRX MUTATION STATUS' versus Clinical Feature #2: 'AGE'
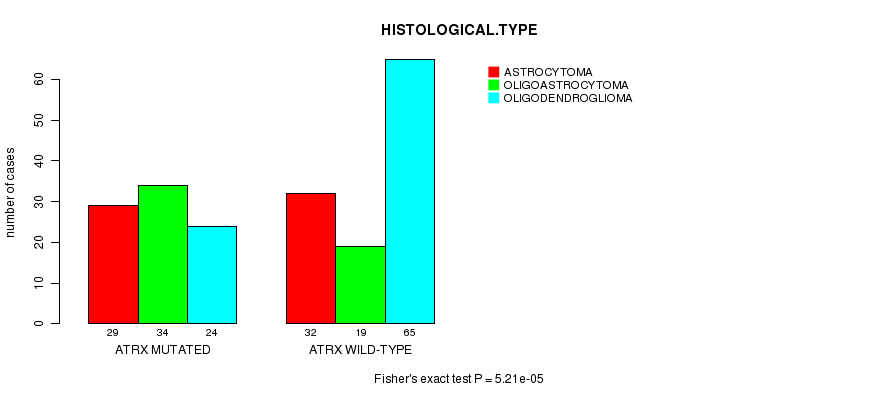
P value = 5.21e-05 (Fisher's exact test), Q value = 0.012
Table S7. Gene #7: 'ATRX MUTATION STATUS' versus Clinical Feature #5: 'HISTOLOGICAL.TYPE'
| nPatients | ASTROCYTOMA | OLIGOASTROCYTOMA | OLIGODENDROGLIOMA |
|---|---|---|---|
| ALL | 61 | 53 | 89 |
| ATRX MUTATED | 29 | 34 | 24 |
| ATRX WILD-TYPE | 32 | 19 | 65 |
Figure S7. Get High-res Image Gene #7: 'ATRX MUTATION STATUS' versus Clinical Feature #5: 'HISTOLOGICAL.TYPE'
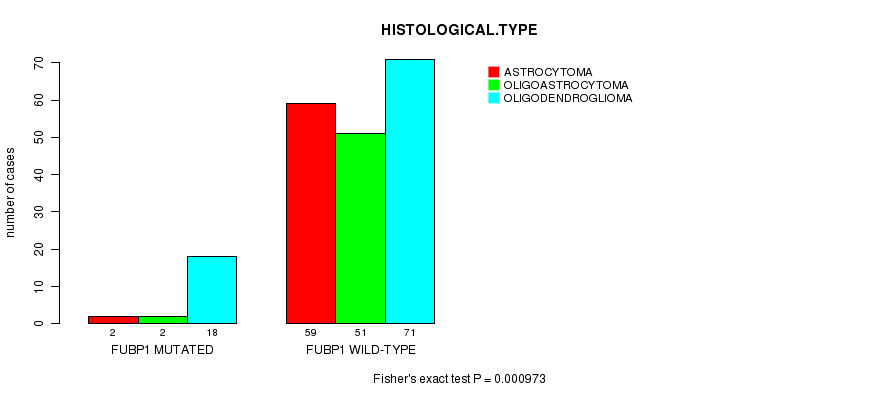
P value = 0.000973 (Fisher's exact test), Q value = 0.22
Table S8. Gene #8: 'FUBP1 MUTATION STATUS' versus Clinical Feature #5: 'HISTOLOGICAL.TYPE'
| nPatients | ASTROCYTOMA | OLIGOASTROCYTOMA | OLIGODENDROGLIOMA |
|---|---|---|---|
| ALL | 61 | 53 | 89 |
| FUBP1 MUTATED | 2 | 2 | 18 |
| FUBP1 WILD-TYPE | 59 | 51 | 71 |
Figure S8. Get High-res Image Gene #8: 'FUBP1 MUTATION STATUS' versus Clinical Feature #5: 'HISTOLOGICAL.TYPE'
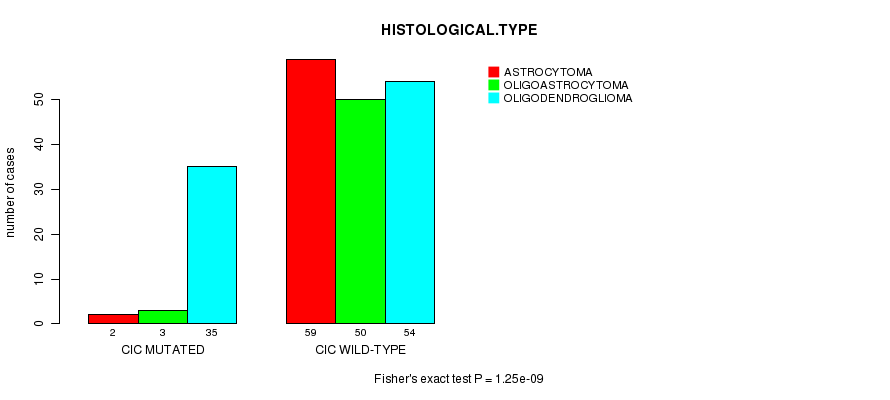
P value = 1.25e-09 (Fisher's exact test), Q value = 3e-07
Table S9. Gene #9: 'CIC MUTATION STATUS' versus Clinical Feature #5: 'HISTOLOGICAL.TYPE'
| nPatients | ASTROCYTOMA | OLIGOASTROCYTOMA | OLIGODENDROGLIOMA |
|---|---|---|---|
| ALL | 61 | 53 | 89 |
| CIC MUTATED | 2 | 3 | 35 |
| CIC WILD-TYPE | 59 | 50 | 54 |
Figure S9. Get High-res Image Gene #9: 'CIC MUTATION STATUS' versus Clinical Feature #5: 'HISTOLOGICAL.TYPE'
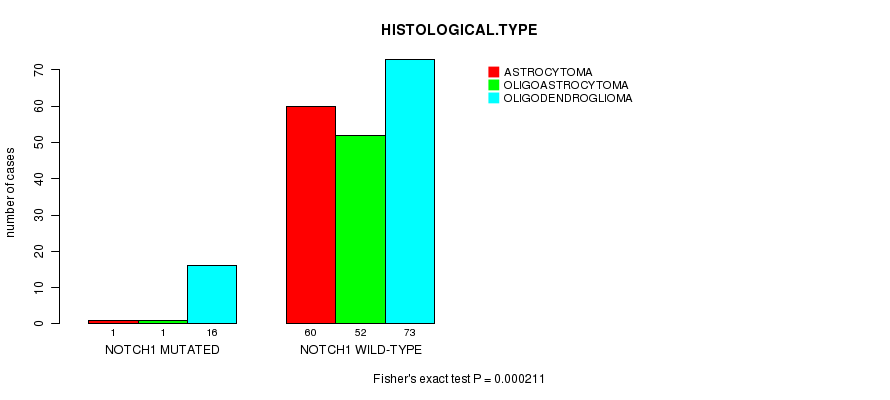
P value = 0.000211 (Fisher's exact test), Q value = 0.049
Table S10. Gene #10: 'NOTCH1 MUTATION STATUS' versus Clinical Feature #5: 'HISTOLOGICAL.TYPE'
| nPatients | ASTROCYTOMA | OLIGOASTROCYTOMA | OLIGODENDROGLIOMA |
|---|---|---|---|
| ALL | 61 | 53 | 89 |
| NOTCH1 MUTATED | 1 | 1 | 16 |
| NOTCH1 WILD-TYPE | 60 | 52 | 73 |
Figure S10. Get High-res Image Gene #10: 'NOTCH1 MUTATION STATUS' versus Clinical Feature #5: 'HISTOLOGICAL.TYPE'
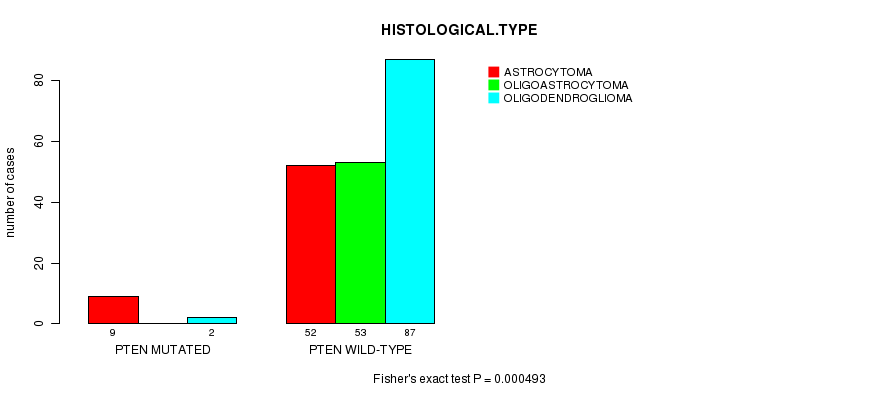
P value = 0.000493 (Fisher's exact test), Q value = 0.11
Table S11. Gene #11: 'PTEN MUTATION STATUS' versus Clinical Feature #5: 'HISTOLOGICAL.TYPE'
| nPatients | ASTROCYTOMA | OLIGOASTROCYTOMA | OLIGODENDROGLIOMA |
|---|---|---|---|
| ALL | 61 | 53 | 89 |
| PTEN MUTATED | 9 | 0 | 2 |
| PTEN WILD-TYPE | 52 | 53 | 87 |
Figure S11. Get High-res Image Gene #11: 'PTEN MUTATION STATUS' versus Clinical Feature #5: 'HISTOLOGICAL.TYPE'
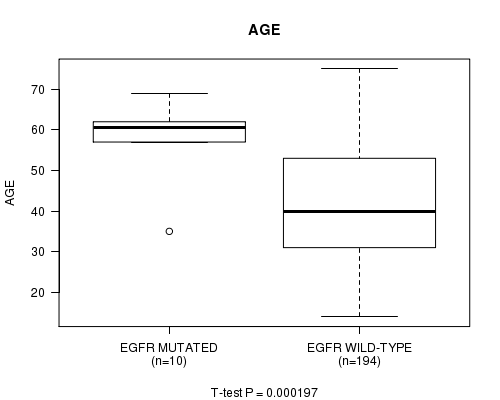
P value = 0.000197 (t-test), Q value = 0.046
Table S12. Gene #20: 'EGFR MUTATION STATUS' versus Clinical Feature #2: 'AGE'
| nPatients | Mean (Std.Dev) | |
|---|---|---|
| ALL | 204 | 43.0 (13.3) |
| EGFR MUTATED | 10 | 58.4 (8.9) |
| EGFR WILD-TYPE | 194 | 42.2 (13.0) |
Figure S12. Get High-res Image Gene #20: 'EGFR MUTATION STATUS' versus Clinical Feature #2: 'AGE'
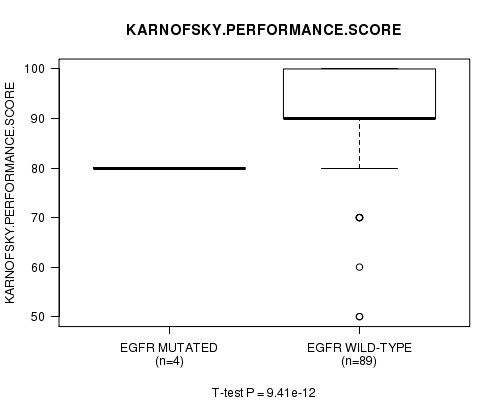
P value = 9.41e-12 (t-test), Q value = 2.3e-09
Table S13. Gene #20: 'EGFR MUTATION STATUS' versus Clinical Feature #4: 'KARNOFSKY.PERFORMANCE.SCORE'
| nPatients | Mean (Std.Dev) | |
|---|---|---|
| ALL | 93 | 88.4 (10.5) |
| EGFR MUTATED | 4 | 80.0 (0.0) |
| EGFR WILD-TYPE | 89 | 88.8 (10.5) |
Figure S13. Get High-res Image Gene #20: 'EGFR MUTATION STATUS' versus Clinical Feature #4: 'KARNOFSKY.PERFORMANCE.SCORE'
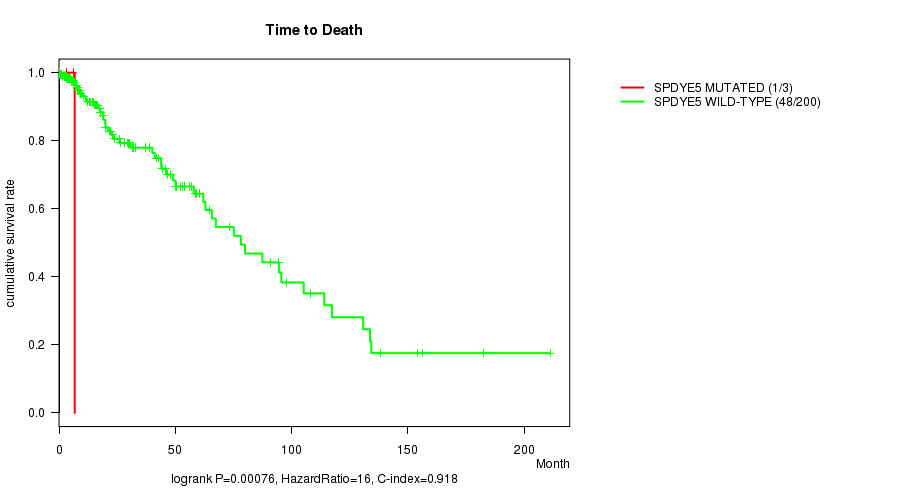
P value = 0.00076 (logrank test), Q value = 0.17
Table S14. Gene #30: 'SPDYE5 MUTATION STATUS' versus Clinical Feature #1: 'Time to Death'
| nPatients | nDeath | Duration Range (Median), Month | |
|---|---|---|---|
| ALL | 203 | 49 | 0.0 - 211.2 (13.4) |
| SPDYE5 MUTATED | 3 | 1 | 3.2 - 6.7 (6.0) |
| SPDYE5 WILD-TYPE | 200 | 48 | 0.0 - 211.2 (14.3) |
Figure S14. Get High-res Image Gene #30: 'SPDYE5 MUTATION STATUS' versus Clinical Feature #1: 'Time to Death'
-
Mutation data file = LGG-TP.mutsig.cluster.txt
-
Clinical data file = LGG-TP.clin.merged.picked.txt
-
Number of patients = 204
-
Number of significantly mutated genes = 37
-
Number of selected clinical features = 7
-
Exclude genes that fewer than K tumors have mutations, K = 3
For survival clinical features, the Kaplan-Meier survival curves of tumors with and without gene mutations were plotted and the statistical significance P values were estimated by logrank test (Bland and Altman 2004) using the 'survdiff' function in R
For continuous numerical clinical features, two-tailed Student's t test with unequal variance (Lehmann and Romano 2005) was applied to compare the clinical values between tumors with and without gene mutations using 't.test' function in R
For binary or multi-class clinical features (nominal or ordinal), two-tailed Fisher's exact tests (Fisher 1922) were used to estimate the P values using the 'fisher.test' function in R
For multiple hypothesis correction, Q value is the False Discovery Rate (FDR) analogue of the P value (Benjamini and Hochberg 1995), defined as the minimum FDR at which the test may be called significant. We used the 'Benjamini and Hochberg' method of 'p.adjust' function in R to convert P values into Q values.
This is an experimental feature. The full results of the analysis summarized in this report can be downloaded from the TCGA Data Coordination Center.