This pipeline uses various statistical tests to identify mRNAs whose expression levels correlated to selected clinical features.
Testing the association between 18364 genes and 7 clinical features across 206 samples, statistically thresholded by Q value < 0.05, 6 clinical features related to at least one genes.
-
357 genes correlated to 'Time to Death'.
-
RANBP17|64901 , ZRANB1|54764 , CBARA1|10367 , PPA1|5464 , MRPS16|51021 , ...
-
81 genes correlated to 'AGE'.
-
PRSS35|167681 , SIM2|6493 , SRXN1|140809 , TRMT2B|79979 , GRPEL2|134266 , ...
-
30 genes correlated to 'GENDER'.
-
XIST|7503 , ZFY|7544 , RPS4Y1|6192 , PRKY|5616 , DDX3Y|8653 , ...
-
2633 genes correlated to 'HISTOLOGICAL.TYPE'.
-
AK2|204 , TXNDC12|51060 , CAP1|10487 , RHOC|389 , WLS|79971 , ...
-
216 genes correlated to 'HISTOLOGICCLASSIFICATION'.
-
IGFBP2|3485 , AURKA|6790 , CD101|9398 , PTTG1|9232 , C4ORF12|404201 , ...
-
8 genes correlated to 'RADIATIONS.RADIATION.REGIMENINDICATION'.
-
ZNF362|149076 , ZDHHC21|340481 , PHC2|1912 , MAD2L2|10459 , STARD4|134429 , ...
-
No genes correlated to 'KARNOFSKY.PERFORMANCE.SCORE'
Complete statistical result table is provided in Supplement Table 1
Table 1. Get Full Table This table shows the clinical features, statistical methods used, and the number of genes that are significantly associated with each clinical feature at Q value < 0.05.
| Clinical feature | Statistical test | Significant genes | Associated with | Associated with | ||
|---|---|---|---|---|---|---|
| Time to Death | Cox regression test | N=357 | shorter survival | N=153 | longer survival | N=204 |
| AGE | Spearman correlation test | N=81 | older | N=36 | younger | N=45 |
| GENDER | t test | N=30 | male | N=17 | female | N=13 |
| KARNOFSKY PERFORMANCE SCORE | Spearman correlation test | N=0 | ||||
| HISTOLOGICAL TYPE | ANOVA test | N=2633 | ||||
| HISTOLOGICCLASSIFICATION | t test | N=216 | grade iii | N=151 | grade ii | N=65 |
| RADIATIONS RADIATION REGIMENINDICATION | t test | N=8 | yes | N=2 | no | N=6 |
Table S1. Basic characteristics of clinical feature: 'Time to Death'
| Time to Death | Duration (Months) | 0-211.2 (median=13.4) |
| censored | N = 154 | |
| death | N = 51 | |
| Significant markers | N = 357 | |
| associated with shorter survival | 153 | |
| associated with longer survival | 204 |
Table S2. Get Full Table List of top 10 genes significantly associated with 'Time to Death' by Cox regression test
| HazardRatio | Wald_P | Q | C_index | |
|---|---|---|---|---|
| RANBP17|64901 | 0.62 | 6.307e-12 | 1.2e-07 | 0.333 |
| ZRANB1|54764 | 0.12 | 1.832e-11 | 3.4e-07 | 0.242 |
| CBARA1|10367 | 0.14 | 1.838e-11 | 3.4e-07 | 0.248 |
| PPA1|5464 | 0.13 | 6.82e-11 | 1.3e-06 | 0.266 |
| MRPS16|51021 | 0.04 | 8.126e-11 | 1.5e-06 | 0.286 |
| CUEDC2|79004 | 0.09 | 9.864e-11 | 1.8e-06 | 0.258 |
| LOC254559|254559 | 0.53 | 1.356e-10 | 2.5e-06 | 0.246 |
| NTNG2|84628 | 0.48 | 1.536e-10 | 2.8e-06 | 0.225 |
| ACTR1A|10121 | 0.09 | 1.684e-10 | 3.1e-06 | 0.266 |
| ZNF217|7764 | 3.7 | 1.744e-10 | 3.2e-06 | 0.761 |
Figure S1. Get High-res Image As an example, this figure shows the association of RANBP17|64901 to 'Time to Death'. four curves present the cumulative survival rates of 4 quartile subsets of patients. P value = 6.31e-12 with univariate Cox regression analysis using continuous log-2 expression values.
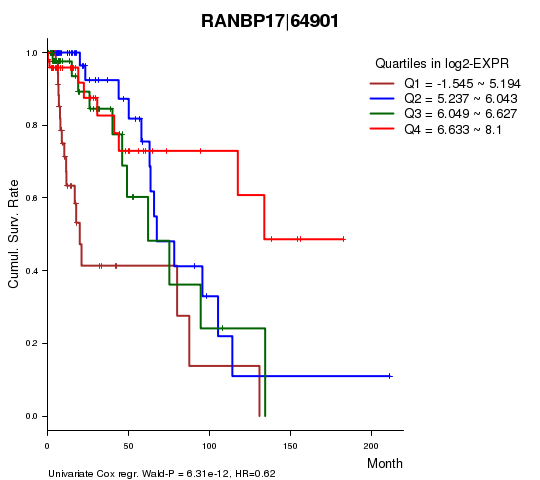
Table S3. Basic characteristics of clinical feature: 'AGE'
| AGE | Mean (SD) | 43.17 (13) |
| Significant markers | N = 81 | |
| pos. correlated | 36 | |
| neg. correlated | 45 |
Table S4. Get Full Table List of top 10 genes significantly correlated to 'AGE' by Spearman correlation test
| SpearmanCorr | corrP | Q | |
|---|---|---|---|
| PRSS35|167681 | -0.4292 | 1.215e-10 | 2.23e-06 |
| SIM2|6493 | 0.4074 | 1.217e-09 | 2.23e-05 |
| SRXN1|140809 | 0.4027 | 1.969e-09 | 3.62e-05 |
| TRMT2B|79979 | 0.4002 | 2.529e-09 | 4.64e-05 |
| GRPEL2|134266 | 0.3968 | 3.539e-09 | 6.5e-05 |
| RBM17|84991 | -0.395 | 4.234e-09 | 7.77e-05 |
| SFRP2|6423 | -0.3916 | 5.89e-09 | 0.000108 |
| SYT6|148281 | -0.3886 | 7.843e-09 | 0.000144 |
| LSG1|55341 | 0.3839 | 1.221e-08 | 0.000224 |
| PARP3|10039 | 0.3802 | 1.732e-08 | 0.000318 |
Figure S2. Get High-res Image As an example, this figure shows the association of PRSS35|167681 to 'AGE'. P value = 1.21e-10 with Spearman correlation analysis. The straight line presents the best linear regression.
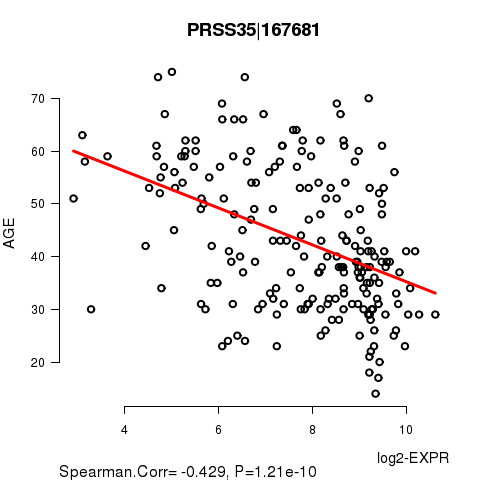
Table S5. Basic characteristics of clinical feature: 'GENDER'
| GENDER | Labels | N |
| FEMALE | 89 | |
| MALE | 117 | |
| Significant markers | N = 30 | |
| Higher in MALE | 17 | |
| Higher in FEMALE | 13 |
Table S6. Get Full Table List of top 10 genes differentially expressed by 'GENDER'
| T(pos if higher in 'MALE') | ttestP | Q | AUC | |
|---|---|---|---|---|
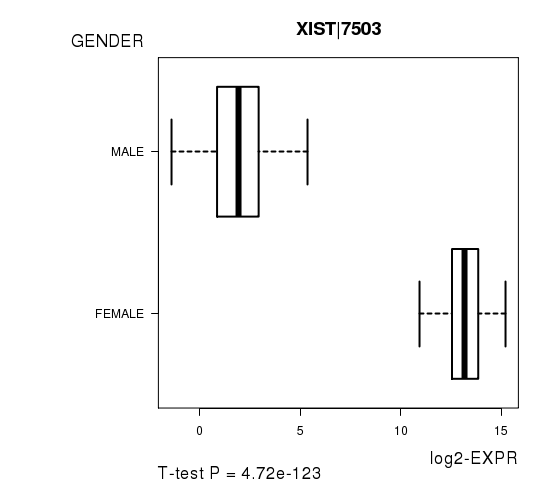
| XIST|7503 | -56.4 | 4.721e-123 | 8.67e-119 | 1 |
| ZFY|7544 | 64.24 | 6.673e-95 | 1.22e-90 | 1 |
| RPS4Y1|6192 | 57.15 | 9.674e-80 | 1.78e-75 | 1 |
| PRKY|5616 | 34.16 | 3.579e-72 | 6.57e-68 | 0.9998 |
| DDX3Y|8653 | 67.75 | 1.202e-69 | 2.21e-65 | 1 |
| KDM5D|8284 | 66.36 | 9.546e-69 | 1.75e-64 | 1 |
| NLGN4Y|22829 | 34.34 | 1.808e-68 | 3.32e-64 | 0.9965 |
| USP9Y|8287 | 69.81 | 2.508e-68 | 4.6e-64 | 1 |
| TSIX|9383 | -26.61 | 3.123e-60 | 5.73e-56 | 1 |
| EIF1AY|9086 | 71.19 | 7.588e-51 | 1.39e-46 | 1 |
Figure S3. Get High-res Image As an example, this figure shows the association of XIST|7503 to 'GENDER'. P value = 4.72e-123 with T-test analysis.
No gene related to 'KARNOFSKY.PERFORMANCE.SCORE'.
Table S7. Basic characteristics of clinical feature: 'KARNOFSKY.PERFORMANCE.SCORE'
| KARNOFSKY.PERFORMANCE.SCORE | Mean (SD) | 88.24 (10) |
| Significant markers | N = 0 |
Table S8. Basic characteristics of clinical feature: 'HISTOLOGICAL.TYPE'
| HISTOLOGICAL.TYPE | Labels | N |
| ASTROCYTOMA | 62 | |
| OLIGOASTROCYTOMA | 54 | |
| OLIGODENDROGLIOMA | 89 | |
| Significant markers | N = 2633 |
Table S9. Get Full Table List of top 10 genes differentially expressed by 'HISTOLOGICAL.TYPE'
| ANOVA_P | Q | |
|---|---|---|
| AK2|204 | 1.481e-21 | 2.72e-17 |
| TXNDC12|51060 | 1.794e-21 | 3.29e-17 |
| CAP1|10487 | 7.385e-21 | 1.36e-16 |
| RHOC|389 | 7.938e-21 | 1.46e-16 |
| WLS|79971 | 1.327e-20 | 2.44e-16 |
| TRAPPC3|27095 | 1.731e-20 | 3.18e-16 |
| SEP15|9403 | 2.452e-20 | 4.5e-16 |
| PAFAH2|5051 | 3.458e-20 | 6.35e-16 |
| GNG5|2787 | 6.748e-20 | 1.24e-15 |
| WDR77|79084 | 1.116e-19 | 2.05e-15 |
Figure S4. Get High-res Image As an example, this figure shows the association of AK2|204 to 'HISTOLOGICAL.TYPE'. P value = 1.48e-21 with ANOVA analysis.
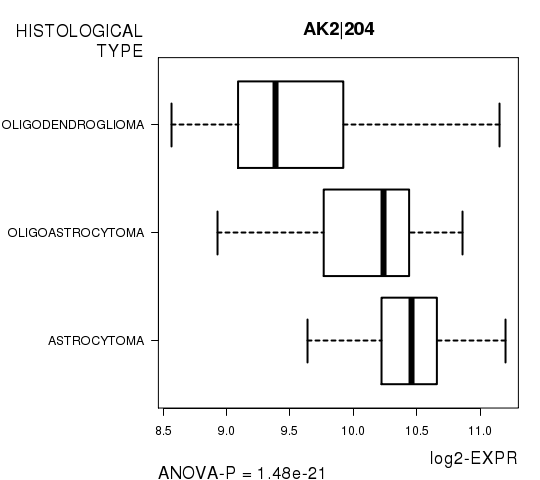
Table S10. Basic characteristics of clinical feature: 'HISTOLOGICCLASSIFICATION'
| HISTOLOGICCLASSIFICATION | Labels | N |
| GRADE II | 94 | |
| GRADE III | 111 | |
| Significant markers | N = 216 | |
| Higher in GRADE III | 151 | |
| Higher in GRADE II | 65 |
Table S11. Get Full Table List of top 10 genes differentially expressed by 'HISTOLOGICCLASSIFICATION'
| T(pos if higher in 'GRADE III') | ttestP | Q | AUC | |
|---|---|---|---|---|
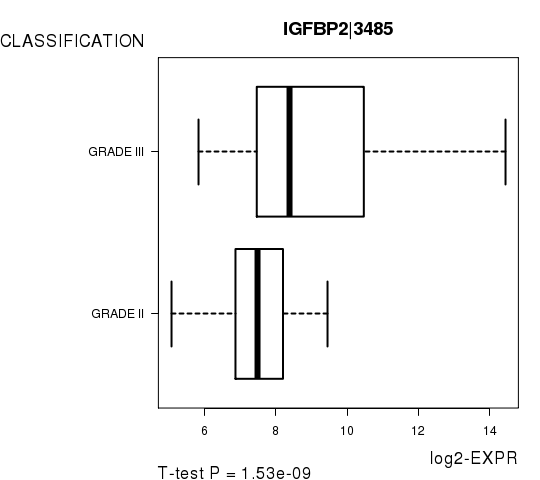
| IGFBP2|3485 | 6.38 | 1.528e-09 | 2.81e-05 | 0.7095 |
| AURKA|6790 | 6.16 | 3.964e-09 | 7.28e-05 | 0.7285 |
| CD101|9398 | 6.07 | 6.533e-09 | 0.00012 | 0.7142 |
| PTTG1|9232 | 5.9 | 1.494e-08 | 0.000274 | 0.72 |
| C4ORF12|404201 | -5.89 | 1.698e-08 | 0.000312 | 0.7128 |
| TOR1B|27348 | 5.89 | 1.864e-08 | 0.000342 | 0.6907 |
| CDCA8|55143 | 5.85 | 1.942e-08 | 0.000357 | 0.7099 |
| FAM46B|115572 | 5.8 | 2.61e-08 | 0.000479 | 0.7152 |
| WEE1|7465 | 5.79 | 2.704e-08 | 0.000496 | 0.7114 |
| KPNA2|3838 | 5.79 | 2.706e-08 | 0.000497 | 0.7118 |
Figure S5. Get High-res Image As an example, this figure shows the association of IGFBP2|3485 to 'HISTOLOGICCLASSIFICATION'. P value = 1.53e-09 with T-test analysis.
8 genes related to 'RADIATIONS.RADIATION.REGIMENINDICATION'.
Table S12. Basic characteristics of clinical feature: 'RADIATIONS.RADIATION.REGIMENINDICATION'
| RADIATIONS.RADIATION.REGIMENINDICATION | Labels | N |
| NO | 102 | |
| YES | 104 | |
| Significant markers | N = 8 | |
| Higher in YES | 2 | |
| Higher in NO | 6 |
Table S13. Get Full Table List of 8 genes differentially expressed by 'RADIATIONS.RADIATION.REGIMENINDICATION'
| T(pos if higher in 'YES') | ttestP | Q | AUC | |
|---|---|---|---|---|
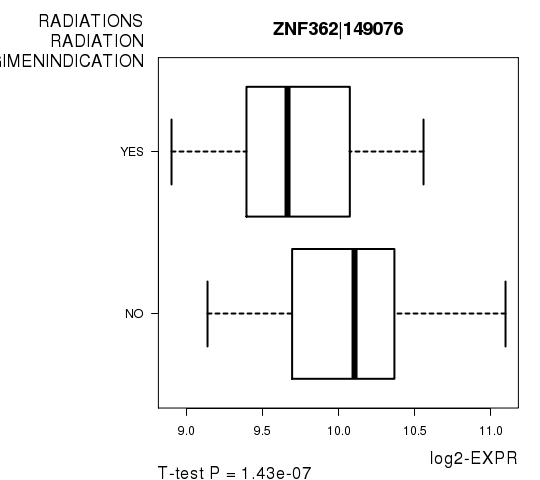
| ZNF362|149076 | -5.45 | 1.427e-07 | 0.00262 | 0.7044 |
| ZDHHC21|340481 | 5.45 | 1.494e-07 | 0.00274 | 0.7171 |
| PHC2|1912 | -5.37 | 2.135e-07 | 0.00392 | 0.7015 |
| MAD2L2|10459 | -5.37 | 2.157e-07 | 0.00396 | 0.7025 |
| STARD4|134429 | 5.3 | 3.038e-07 | 0.00558 | 0.7073 |
| ANP32A|8125 | -5.03 | 1.049e-06 | 0.0193 | 0.7036 |
| ARMC7|79637 | -5.01 | 1.193e-06 | 0.0219 | 0.676 |
| BTF3L4|91408 | -4.88 | 2.187e-06 | 0.0401 | 0.6828 |
Figure S6. Get High-res Image As an example, this figure shows the association of ZNF362|149076 to 'RADIATIONS.RADIATION.REGIMENINDICATION'. P value = 1.43e-07 with T-test analysis.
-
Expresson data file = LGG-TP.uncv2.mRNAseq_RSEM_normalized_log2.txt
-
Clinical data file = LGG-TP.clin.merged.picked.txt
-
Number of patients = 206
-
Number of genes = 18364
-
Number of clinical features = 7
For survival clinical features, Wald's test in univariate Cox regression analysis with proportional hazards model (Andersen and Gill 1982) was used to estimate the P values using the 'coxph' function in R. Kaplan-Meier survival curves were plot using the four quartile subgroups of patients based on expression levels
For continuous numerical clinical features, Spearman's rank correlation coefficients (Spearman 1904) and two-tailed P values were estimated using 'cor.test' function in R
For two-class clinical features, two-tailed Student's t test with unequal variance (Lehmann and Romano 2005) was applied to compare the log2-expression levels between the two clinical classes using 't.test' function in R
For multi-class clinical features (ordinal or nominal), one-way analysis of variance (Howell 2002) was applied to compare the log2-expression levels between different clinical classes using 'anova' function in R
For multiple hypothesis correction, Q value is the False Discovery Rate (FDR) analogue of the P value (Benjamini and Hochberg 1995), defined as the minimum FDR at which the test may be called significant. We used the 'Benjamini and Hochberg' method of 'p.adjust' function in R to convert P values into Q values.
This is an experimental feature. The full results of the analysis summarized in this report can be downloaded from the TCGA Data Coordination Center.