This pipeline uses various statistical tests to identify genes whose promoter methylation levels correlated to selected clinical features.
Testing the association between 16900 genes and 4 clinical features across 56 samples, statistically thresholded by Q value < 0.05, 3 clinical features related to at least one genes.
-
2 genes correlated to 'AGE'.
-
PPTC7 , ZNF311
-
1 gene correlated to 'GENDER'.
-
UTP14C
-
8 genes correlated to 'COMPLETENESS.OF.RESECTION'.
-
SEPSECS , C5ORF42 , KDELC1 , GOLGA7 , IREB2 , ...
-
No genes correlated to 'Time to Death'
Complete statistical result table is provided in Supplement Table 1
Table 1. Get Full Table This table shows the clinical features, statistical methods used, and the number of genes that are significantly associated with each clinical feature at Q value < 0.05.
| Clinical feature | Statistical test | Significant genes | Associated with | Associated with | ||
|---|---|---|---|---|---|---|
| Time to Death | Cox regression test | N=0 | ||||
| AGE | Spearman correlation test | N=2 | older | N=0 | younger | N=2 |
| GENDER | t test | N=1 | male | N=1 | female | N=0 |
| COMPLETENESS OF RESECTION | ANOVA test | N=8 |
Table S1. Basic characteristics of clinical feature: 'Time to Death'
| Time to Death | Duration (Months) | 0.1-83.6 (median=13.8) |
| censored | N = 31 | |
| death | N = 20 | |
| Significant markers | N = 0 |
Table S2. Basic characteristics of clinical feature: 'AGE'
| AGE | Mean (SD) | 58.56 (15) |
| Significant markers | N = 2 | |
| pos. correlated | 0 | |
| neg. correlated | 2 |
Table S3. Get Full Table List of 2 genes significantly correlated to 'AGE' by Spearman correlation test
| SpearmanCorr | corrP | Q | |
|---|---|---|---|
| PPTC7 | -0.5951 | 1.657e-06 | 0.028 |
| ZNF311 | -0.5901 | 2.121e-06 | 0.0358 |
Figure S1. Get High-res Image As an example, this figure shows the association of PPTC7 to 'AGE'. P value = 1.66e-06 with Spearman correlation analysis. The straight line presents the best linear regression.
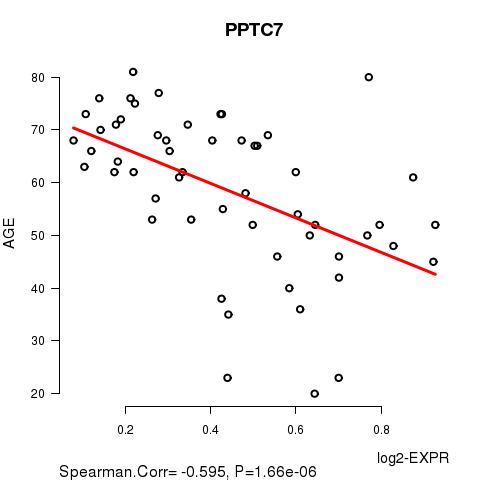
Table S4. Basic characteristics of clinical feature: 'GENDER'
| GENDER | Labels | N |
| FEMALE | 21 | |
| MALE | 35 | |
| Significant markers | N = 1 | |
| Higher in MALE | 1 | |
| Higher in FEMALE | 0 |
Table S5. Get Full Table List of one gene differentially expressed by 'GENDER'
| T(pos if higher in 'MALE') | ttestP | Q | AUC | |
|---|---|---|---|---|
| UTP14C | 8.17 | 2.139e-08 | 0.000361 | 0.9456 |
Figure S2. Get High-res Image As an example, this figure shows the association of UTP14C to 'GENDER'. P value = 2.14e-08 with T-test analysis.
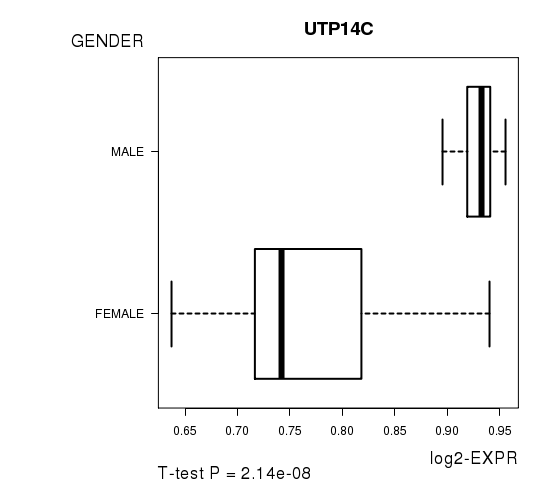
Table S6. Basic characteristics of clinical feature: 'COMPLETENESS.OF.RESECTION'
| COMPLETENESS.OF.RESECTION | Labels | N |
| R0 | 42 | |
| R1 | 4 | |
| R2 | 1 | |
| RX | 6 | |
| Significant markers | N = 8 |
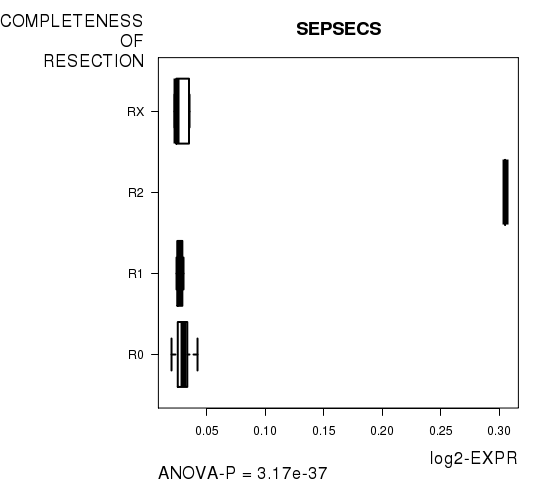
Table S7. Get Full Table List of 8 genes differentially expressed by 'COMPLETENESS.OF.RESECTION'
| ANOVA_P | Q | |
|---|---|---|
| SEPSECS | 3.171e-37 | 5.36e-33 |
| C5ORF42 | 3.664e-13 | 6.19e-09 |
| KDELC1 | 5.313e-10 | 8.98e-06 |
| GOLGA7 | 2.808e-09 | 4.74e-05 |
| IREB2 | 4.829e-08 | 0.000816 |
| C4ORF12 | 1.411e-07 | 0.00238 |
| MGMT | 5.062e-07 | 0.00855 |
| SEPT2 | 1.797e-06 | 0.0304 |
Figure S3. Get High-res Image As an example, this figure shows the association of SEPSECS to 'COMPLETENESS.OF.RESECTION'. P value = 3.17e-37 with ANOVA analysis.
-
Expresson data file = LIHC-TP.meth.for_correlation.filtered_data.txt
-
Clinical data file = LIHC-TP.clin.merged.picked.txt
-
Number of patients = 56
-
Number of genes = 16900
-
Number of clinical features = 4
For survival clinical features, Wald's test in univariate Cox regression analysis with proportional hazards model (Andersen and Gill 1982) was used to estimate the P values using the 'coxph' function in R. Kaplan-Meier survival curves were plot using the four quartile subgroups of patients based on expression levels
For continuous numerical clinical features, Spearman's rank correlation coefficients (Spearman 1904) and two-tailed P values were estimated using 'cor.test' function in R
For two-class clinical features, two-tailed Student's t test with unequal variance (Lehmann and Romano 2005) was applied to compare the log2-expression levels between the two clinical classes using 't.test' function in R
For multi-class clinical features (ordinal or nominal), one-way analysis of variance (Howell 2002) was applied to compare the log2-expression levels between different clinical classes using 'anova' function in R
For multiple hypothesis correction, Q value is the False Discovery Rate (FDR) analogue of the P value (Benjamini and Hochberg 1995), defined as the minimum FDR at which the test may be called significant. We used the 'Benjamini and Hochberg' method of 'p.adjust' function in R to convert P values into Q values.
This is an experimental feature. The full results of the analysis summarized in this report can be downloaded from the TCGA Data Coordination Center.