This pipeline computes the correlation between significant copy number variation (cnv focal) genes and selected clinical features.
Testing the association between copy number variation 69 arm-level results and 7 clinical features across 562 patients, 9 significant findings detected with Q value < 0.25.
-
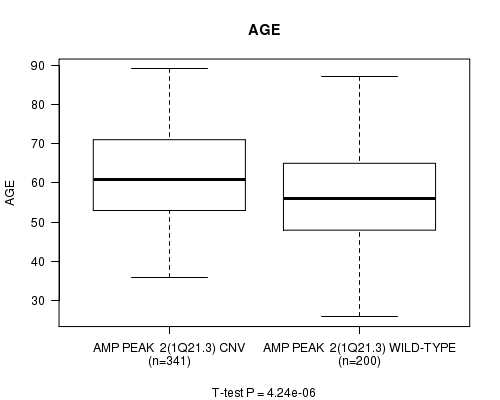
Amp Peak 2(1q21.3) cnv correlated to 'AGE'.
-
Amp Peak 14(10p15.3) cnv correlated to 'AGE'.
-
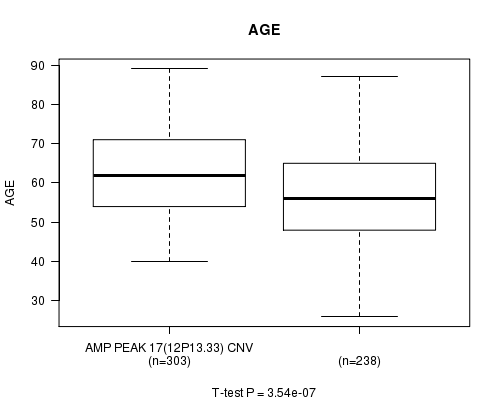
Amp Peak 17(12p13.33) cnv correlated to 'AGE'.
-
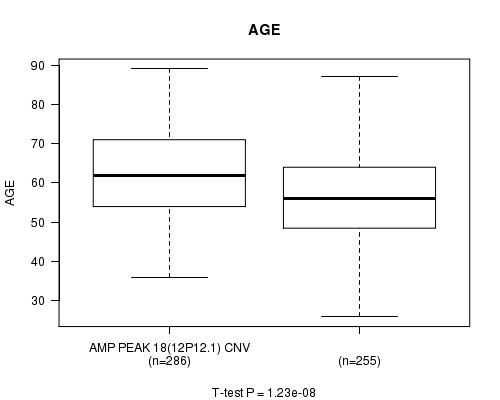
Amp Peak 18(12p12.1) cnv correlated to 'AGE'.
-
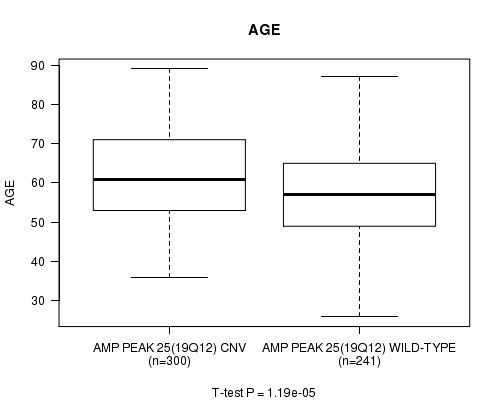
Amp Peak 25(19q12) cnv correlated to 'AGE'.
-
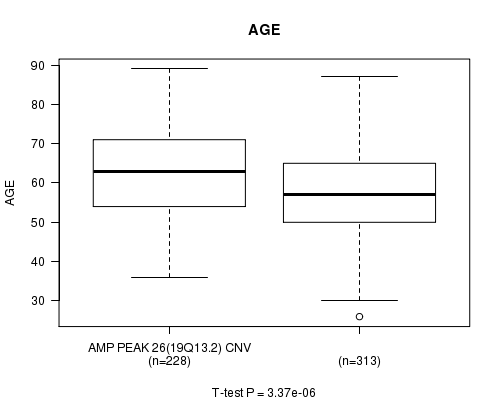
Amp Peak 26(19q13.2) cnv correlated to 'AGE'.
-
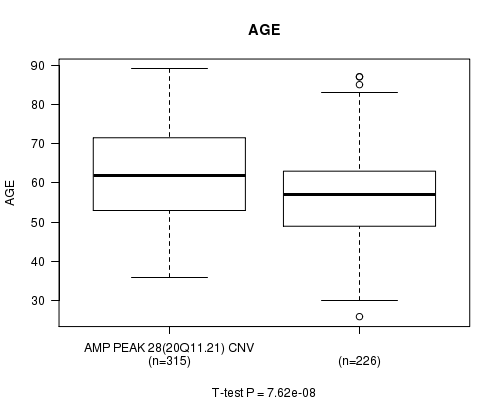
Amp Peak 28(20q11.21) cnv correlated to 'AGE'.
-
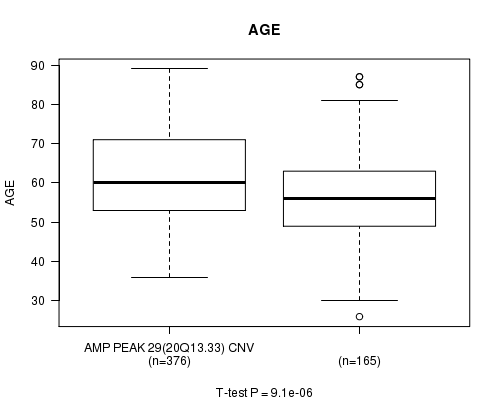
Amp Peak 29(20q13.33) cnv correlated to 'AGE'.
-
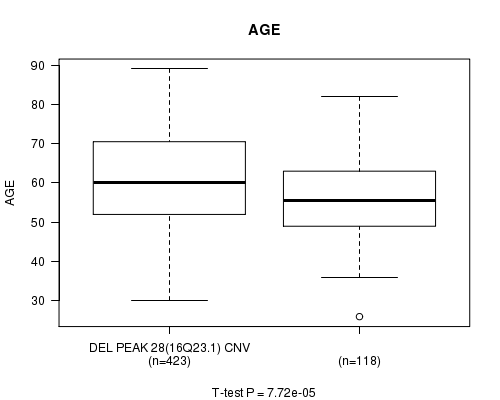
Del Peak 28(16q23.1) cnv correlated to 'AGE'.
Table 1. Get Full Table Overview of the association between significant copy number variation of 69 arm-level results and 7 clinical features. Shown in the table are P values (Q values). Thresholded by Q value < 0.25, 9 significant findings detected.
|
Clinical Features |
Time to Death |
AGE |
PRIMARY SITE OF DISEASE |
KARNOFSKY PERFORMANCE SCORE |
TUMOR STAGE |
RADIATIONS RADIATION REGIMENINDICATION |
COMPLETENESS OF RESECTION |
||
| nCNV (%) | nWild-Type | logrank test | t-test | Fisher's exact test | t-test | Fisher's exact test | Fisher's exact test | Fisher's exact test | |
| Amp Peak 2(1q21 3) | 0 (0%) | 209 |
0.291 (1.00) |
4.24e-06 (0.00203) |
0.128 (1.00) |
0.408 (1.00) |
0.757 (1.00) |
1 (1.00) |
0.501 (1.00) |
| Amp Peak 14(10p15 3) | 0 (0%) | 323 |
0.13 (1.00) |
0.000432 (0.205) |
0.154 (1.00) |
0.923 (1.00) |
0.228 (1.00) |
0.578 (1.00) |
0.747 (1.00) |
| Amp Peak 17(12p13 33) | 0 (0%) | 247 |
0.772 (1.00) |
3.54e-07 (0.00017) |
0.756 (1.00) |
0.735 (1.00) |
0.0955 (1.00) |
1 (1.00) |
0.51 (1.00) |
| Amp Peak 18(12p12 1) | 0 (0%) | 262 |
0.0918 (1.00) |
1.23e-08 (5.92e-06) |
0.251 (1.00) |
0.335 (1.00) |
0.0316 (1.00) |
0.601 (1.00) |
1 (1.00) |
| Amp Peak 25(19q12) | 0 (0%) | 252 |
0.602 (1.00) |
1.19e-05 (0.0057) |
0.162 (1.00) |
0.51 (1.00) |
0.104 (1.00) |
1 (1.00) |
1 (1.00) |
| Amp Peak 26(19q13 2) | 0 (0%) | 327 |
0.0201 (1.00) |
3.37e-06 (0.00162) |
0.15 (1.00) |
0.989 (1.00) |
0.639 (1.00) |
0.574 (1.00) |
0.326 (1.00) |
| Amp Peak 28(20q11 21) | 0 (0%) | 234 |
0.104 (1.00) |
7.62e-08 (3.67e-05) |
1 (1.00) |
0.264 (1.00) |
0.0856 (1.00) |
1 (1.00) |
1 (1.00) |
| Amp Peak 29(20q13 33) | 0 (0%) | 173 |
0.331 (1.00) |
9.1e-06 (0.00435) |
1 (1.00) |
0.752 (1.00) |
0.546 (1.00) |
1 (1.00) |
0.0958 (1.00) |
| Del Peak 28(16q23 1) | 0 (0%) | 125 |
0.161 (1.00) |
7.72e-05 (0.0368) |
0.636 (1.00) |
0.0778 (1.00) |
0.128 (1.00) |
1 (1.00) |
0.0885 (1.00) |
| Amp Peak 1(1p34 3) | 0 (0%) | 282 |
0.0333 (1.00) |
0.00962 (1.00) |
1 (1.00) |
0.985 (1.00) |
0.874 (1.00) |
0.123 (1.00) |
0.332 (1.00) |
| Amp Peak 3(1q42 2) | 0 (0%) | 256 |
0.29 (1.00) |
0.000643 (0.304) |
0.252 (1.00) |
0.736 (1.00) |
0.173 (1.00) |
0.594 (1.00) |
0.742 (1.00) |
| Amp Peak 4(2p23 2) | 0 (0%) | 327 |
0.915 (1.00) |
0.0855 (1.00) |
0.762 (1.00) |
0.988 (1.00) |
0.369 (1.00) |
1 (1.00) |
0.501 (1.00) |
| Amp Peak 5(2q31 2) | 0 (0%) | 314 |
0.177 (1.00) |
0.0132 (1.00) |
0.756 (1.00) |
0.693 (1.00) |
0.00661 (1.00) |
0.0853 (1.00) |
0.734 (1.00) |
| Amp Peak 6(3q26 2) | 0 (0%) | 96 |
0.898 (1.00) |
0.000761 (0.359) |
0.527 (1.00) |
0.00131 (0.615) |
0.0553 (1.00) |
1 (1.00) |
0.673 (1.00) |
| Amp Peak 7(4p16 3) | 0 (0%) | 407 |
0.456 (1.00) |
0.644 (1.00) |
0.723 (1.00) |
0.0728 (1.00) |
0.831 (1.00) |
1 (1.00) |
0.481 (1.00) |
| Amp Peak 8(4q13 3) | 0 (0%) | 456 |
0.204 (1.00) |
0.208 (1.00) |
0.571 (1.00) |
0.42 (1.00) |
0.407 (1.00) |
1 (1.00) |
0.28 (1.00) |
| Amp Peak 9(5p15 33) | 0 (0%) | 266 |
0.0538 (1.00) |
0.00274 (1.00) |
0.751 (1.00) |
0.798 (1.00) |
0.292 (1.00) |
0.605 (1.00) |
0.0516 (1.00) |
| Amp Peak 10(6p22 3) | 0 (0%) | 277 |
0.132 (1.00) |
0.00543 (1.00) |
1 (1.00) |
0.545 (1.00) |
0.0489 (1.00) |
0.619 (1.00) |
0.744 (1.00) |
| Amp Peak 11(7q36 3) | 0 (0%) | 262 |
0.291 (1.00) |
0.858 (1.00) |
1 (1.00) |
0.1 (1.00) |
0.741 (1.00) |
0.601 (1.00) |
0.501 (1.00) |
| Amp Peak 12(8p11 21) | 0 (0%) | 360 |
0.335 (1.00) |
0.000534 (0.253) |
0.121 (1.00) |
0.662 (1.00) |
0.317 (1.00) |
0.294 (1.00) |
0.501 (1.00) |
| Amp Peak 13(8q24 21) | 0 (0%) | 121 |
0.547 (1.00) |
0.0995 (1.00) |
1 (1.00) |
0.628 (1.00) |
0.188 (1.00) |
0.518 (1.00) |
0.673 (1.00) |
| Amp Peak 15(10q22 3) | 0 (0%) | 388 |
0.523 (1.00) |
0.221 (1.00) |
0.0934 (1.00) |
0.989 (1.00) |
0.751 (1.00) |
1 (1.00) |
0.719 (1.00) |
| Amp Peak 16(11q14 1) | 0 (0%) | 314 |
0.298 (1.00) |
0.335 (1.00) |
0.256 (1.00) |
0.474 (1.00) |
0.0508 (1.00) |
1 (1.00) |
0.734 (1.00) |
| Amp Peak 19(14q11 2) | 0 (0%) | 420 |
0.752 (1.00) |
0.0651 (1.00) |
0.124 (1.00) |
0.378 (1.00) |
0.101 (1.00) |
1 (1.00) |
0.692 (1.00) |
| Amp Peak 20(14q32 33) | 0 (0%) | 412 |
0.216 (1.00) |
0.0162 (1.00) |
0.711 (1.00) |
0.113 (1.00) |
0.484 (1.00) |
0.175 (1.00) |
1 (1.00) |
| Amp Peak 21(15q26 3) | 0 (0%) | 408 |
0.0716 (1.00) |
0.284 (1.00) |
0.728 (1.00) |
0.42 (1.00) |
0.147 (1.00) |
0.565 (1.00) |
0.734 (1.00) |
| Amp Peak 22(17q25 3) | 0 (0%) | 358 |
0.0217 (1.00) |
0.783 (1.00) |
1 (1.00) |
0.685 (1.00) |
0.381 (1.00) |
1 (1.00) |
0.186 (1.00) |
| Amp Peak 23(18q11 2) | 0 (0%) | 426 |
0.979 (1.00) |
0.0441 (1.00) |
0.114 (1.00) |
0.18 (1.00) |
0.843 (1.00) |
0.565 (1.00) |
0.712 (1.00) |
| Amp Peak 24(19p13 12) | 0 (0%) | 258 |
0.199 (1.00) |
0.072 (1.00) |
0.461 (1.00) |
0.597 (1.00) |
0.119 (1.00) |
0.596 (1.00) |
0.197 (1.00) |
| Amp Peak 27(20p13) | 0 (0%) | 253 |
0.325 (1.00) |
0.00209 (0.978) |
0.754 (1.00) |
0.11 (1.00) |
0.0202 (1.00) |
1 (1.00) |
0.305 (1.00) |
| Amp Peak 30(22q12 2) | 0 (0%) | 474 |
0.545 (1.00) |
0.0241 (1.00) |
1 (1.00) |
0.419 (1.00) |
0.434 (1.00) |
1 (1.00) |
1 (1.00) |
| Amp Peak 31(Xp11 23) | 0 (0%) | 399 |
0.144 (1.00) |
0.0223 (1.00) |
0.0781 (1.00) |
0.275 (1.00) |
0.364 (1.00) |
0.56 (1.00) |
0.14 (1.00) |
| Amp Peak 32(Xq28) | 0 (0%) | 341 |
0.355 (1.00) |
0.97 (1.00) |
0.77 (1.00) |
0.654 (1.00) |
0.00163 (0.767) |
0.0603 (1.00) |
0.744 (1.00) |
| Del Peak 1(1p36 11) | 0 (0%) | 301 |
0.169 (1.00) |
0.187 (1.00) |
0.751 (1.00) |
0.427 (1.00) |
0.496 (1.00) |
1 (1.00) |
1 (1.00) |
| Del Peak 2(1q32 3) | 0 (0%) | 470 |
0.96 (1.00) |
0.544 (1.00) |
1 (1.00) |
0.287 (1.00) |
0.423 (1.00) |
0.416 (1.00) |
1 (1.00) |
| Del Peak 3(2p25 3) | 0 (0%) | 444 |
0.922 (1.00) |
0.425 (1.00) |
0.615 (1.00) |
0.875 (1.00) |
0.0602 (1.00) |
0.508 (1.00) |
0.0175 (1.00) |
| Del Peak 4(2q22 1) | 0 (0%) | 431 |
0.25 (1.00) |
0.385 (1.00) |
0.656 (1.00) |
0.595 (1.00) |
0.356 (1.00) |
1 (1.00) |
0.512 (1.00) |
| Del Peak 5(2q37 3) | 0 (0%) | 391 |
0.457 (1.00) |
0.106 (1.00) |
0.359 (1.00) |
0.432 (1.00) |
0.768 (1.00) |
0.221 (1.00) |
0.463 (1.00) |
| Del Peak 6(3p26 2) | 0 (0%) | 355 |
0.792 (1.00) |
0.00246 (1.00) |
0.126 (1.00) |
0.246 (1.00) |
0.136 (1.00) |
0.0495 (1.00) |
0.278 (1.00) |
| Del Peak 7(4q22 1) | 0 (0%) | 183 |
0.51 (1.00) |
0.95 (1.00) |
1 (1.00) |
0.925 (1.00) |
0.0436 (1.00) |
1 (1.00) |
0.481 (1.00) |
| Del Peak 8(4q34 3) | 0 (0%) | 155 |
0.797 (1.00) |
0.36 (1.00) |
0.728 (1.00) |
0.171 (1.00) |
0.796 (1.00) |
0.565 (1.00) |
0.275 (1.00) |
| Del Peak 9(5q11 2) | 0 (0%) | 227 |
0.737 (1.00) |
0.628 (1.00) |
0.767 (1.00) |
0.325 (1.00) |
0.243 (1.00) |
0.568 (1.00) |
0.742 (1.00) |
| Del Peak 10(5q13 2) | 0 (0%) | 162 |
0.261 (1.00) |
0.922 (1.00) |
0.747 (1.00) |
0.216 (1.00) |
0.884 (1.00) |
0.201 (1.00) |
0.742 (1.00) |
| Del Peak 11(6q27) | 0 (0%) | 187 |
0.307 (1.00) |
0.000707 (0.334) |
1 (1.00) |
0.508 (1.00) |
0.371 (1.00) |
1 (1.00) |
0.734 (1.00) |
| Del Peak 12(7p22 1) | 0 (0%) | 318 |
0.09 (1.00) |
0.0291 (1.00) |
0.758 (1.00) |
0.497 (1.00) |
0.966 (1.00) |
1 (1.00) |
0.0862 (1.00) |
| Del Peak 13(8p23 3) | 0 (0%) | 185 |
0.271 (1.00) |
0.0639 (1.00) |
1 (1.00) |
0.95 (1.00) |
0.888 (1.00) |
1 (1.00) |
1 (1.00) |
| Del Peak 14(8p21 2) | 0 (0%) | 170 |
0.672 (1.00) |
0.0645 (1.00) |
1 (1.00) |
0.647 (1.00) |
0.538 (1.00) |
1 (1.00) |
0.734 (1.00) |
| Del Peak 15(9p24 3) | 0 (0%) | 309 |
0.943 (1.00) |
0.025 (1.00) |
0.45 (1.00) |
0.928 (1.00) |
0.397 (1.00) |
0.591 (1.00) |
0.322 (1.00) |
| Del Peak 16(9q34 13) | 0 (0%) | 226 |
0.786 (1.00) |
0.0402 (1.00) |
0.767 (1.00) |
0.623 (1.00) |
0.859 (1.00) |
0.277 (1.00) |
0.326 (1.00) |
| Del Peak 17(10p15 3) | 0 (0%) | 444 |
0.336 (1.00) |
0.83 (1.00) |
0.608 (1.00) |
0.72 (1.00) |
0.392 (1.00) |
0.508 (1.00) |
1 (1.00) |
| Del Peak 18(10q23 31) | 0 (0%) | 343 |
0.328 (1.00) |
0.972 (1.00) |
1 (1.00) |
0.393 (1.00) |
0.625 (1.00) |
0.563 (1.00) |
0.463 (1.00) |
| Del Peak 19(10q26 3) | 0 (0%) | 373 |
0.0829 (1.00) |
0.842 (1.00) |
0.8 (1.00) |
0.77 (1.00) |
0.345 (1.00) |
1 (1.00) |
0.734 (1.00) |
| Del Peak 20(11p15 5) | 0 (0%) | 230 |
0.0509 (1.00) |
0.563 (1.00) |
0.0267 (1.00) |
0.267 (1.00) |
0.675 (1.00) |
1 (1.00) |
0.512 (1.00) |
| Del Peak 21(11q25) | 0 (0%) | 369 |
0.598 (1.00) |
0.0797 (1.00) |
0.225 (1.00) |
0.631 (1.00) |
0.0759 (1.00) |
0.272 (1.00) |
0.267 (1.00) |
| Del Peak 22(12q24 33) | 0 (0%) | 351 |
0.655 (1.00) |
0.112 (1.00) |
0.13 (1.00) |
0.652 (1.00) |
0.539 (1.00) |
0.295 (1.00) |
0.0838 (1.00) |
| Del Peak 23(13q14 2) | 0 (0%) | 213 |
0.0714 (1.00) |
0.561 (1.00) |
0.777 (1.00) |
0.592 (1.00) |
0.747 (1.00) |
0.56 (1.00) |
0.189 (1.00) |
| Del Peak 24(14q23 3) | 0 (0%) | 267 |
0.453 (1.00) |
0.589 (1.00) |
0.475 (1.00) |
0.0123 (1.00) |
0.384 (1.00) |
0.107 (1.00) |
0.306 (1.00) |
| Del Peak 25(15q15 1) | 0 (0%) | 209 |
0.664 (1.00) |
0.00579 (1.00) |
0.411 (1.00) |
0.253 (1.00) |
0.0296 (1.00) |
0.298 (1.00) |
0.742 (1.00) |
| Del Peak 26(16p13 3) | 0 (0%) | 263 |
0.886 (1.00) |
0.883 (1.00) |
0.751 (1.00) |
0.578 (1.00) |
0.217 (1.00) |
0.602 (1.00) |
0.512 (1.00) |
| Del Peak 27(16q22 1) | 0 (0%) | 115 |
0.645 (1.00) |
0.00497 (1.00) |
0.193 (1.00) |
0.275 (1.00) |
0.547 (1.00) |
1 (1.00) |
0.231 (1.00) |
| Del Peak 29(17p12) | 0 (0%) | 87 |
0.797 (1.00) |
0.982 (1.00) |
0.493 (1.00) |
0.73 (1.00) |
0.0127 (1.00) |
1 (1.00) |
0.712 (1.00) |
| Del Peak 30(17q11 2) | 0 (0%) | 102 |
0.708 (1.00) |
0.0331 (1.00) |
0.0666 (1.00) |
0.686 (1.00) |
0.259 (1.00) |
1 (1.00) |
0.734 (1.00) |
| Del Peak 31(18q23) | 0 (0%) | 194 |
0.673 (1.00) |
0.454 (1.00) |
0.225 (1.00) |
0.544 (1.00) |
0.708 (1.00) |
1 (1.00) |
1 (1.00) |
| Del Peak 32(19p13 3) | 0 (0%) | 67 |
0.19 (1.00) |
0.0164 (1.00) |
1 (1.00) |
0.00833 (1.00) |
0.0647 (1.00) |
1 (1.00) |
0.692 (1.00) |
| Del Peak 33(19q13 33) | 0 (0%) | 271 |
0.603 (1.00) |
0.355 (1.00) |
1 (1.00) |
0.311 (1.00) |
0.374 (1.00) |
0.25 (1.00) |
1 (1.00) |
| Del Peak 34(19q13 43) | 0 (0%) | 286 |
0.389 (1.00) |
0.0316 (1.00) |
1 (1.00) |
0.283 (1.00) |
0.275 (1.00) |
1 (1.00) |
0.52 (1.00) |
| Del Peak 35(21q22 3) | 0 (0%) | 345 |
0.584 (1.00) |
0.35 (1.00) |
0.774 (1.00) |
0.665 (1.00) |
0.124 (1.00) |
1 (1.00) |
1 (1.00) |
| Del Peak 36(22q13 32) | 0 (0%) | 75 |
0.843 (1.00) |
0.901 (1.00) |
0.443 (1.00) |
0.752 (1.00) |
0.548 (1.00) |
1 (1.00) |
0.596 (1.00) |
| Del Peak 37(Xp21 1) | 0 (0%) | 202 |
0.838 (1.00) |
0.367 (1.00) |
1 (1.00) |
0.987 (1.00) |
0.682 (1.00) |
0.556 (1.00) |
0.742 (1.00) |
P value = 4.24e-06 (t-test), Q value = 0.002
Table S1. Gene #2: 'Amp Peak 2(1q21.3)' versus Clinical Feature #2: 'AGE'
| nPatients | Mean (Std.Dev) | |
|---|---|---|
| ALL | 541 | 59.8 (11.6) |
| AMP PEAK 2(1Q21.3) CNV | 341 | 61.6 (11.0) |
| AMP PEAK 2(1Q21.3) WILD-TYPE | 200 | 56.8 (12.0) |
Figure S1. Get High-res Image Gene #2: 'Amp Peak 2(1q21.3)' versus Clinical Feature #2: 'AGE'
P value = 0.000432 (t-test), Q value = 0.21
Table S2. Gene #14: 'Amp Peak 14(10p15.3)' versus Clinical Feature #2: 'AGE'
| nPatients | Mean (Std.Dev) | |
|---|---|---|
| ALL | 541 | 59.8 (11.6) |
| AMP PEAK 14(10P15.3) CNV | 233 | 61.8 (11.2) |
| AMP PEAK 14(10P15.3) WILD-TYPE | 308 | 58.3 (11.7) |
Figure S2. Get High-res Image Gene #14: 'Amp Peak 14(10p15.3)' versus Clinical Feature #2: 'AGE'

P value = 3.54e-07 (t-test), Q value = 0.00017
Table S3. Gene #17: 'Amp Peak 17(12p13.33)' versus Clinical Feature #2: 'AGE'
| nPatients | Mean (Std.Dev) | |
|---|---|---|
| ALL | 541 | 59.8 (11.6) |
| AMP PEAK 17(12P13.33) CNV | 303 | 62.1 (10.8) |
| AMP PEAK 17(12P13.33) WILD-TYPE | 238 | 56.9 (12.0) |
Figure S3. Get High-res Image Gene #17: 'Amp Peak 17(12p13.33)' versus Clinical Feature #2: 'AGE'
P value = 1.23e-08 (t-test), Q value = 5.9e-06
Table S4. Gene #18: 'Amp Peak 18(12p12.1)' versus Clinical Feature #2: 'AGE'
| nPatients | Mean (Std.Dev) | |
|---|---|---|
| ALL | 541 | 59.8 (11.6) |
| AMP PEAK 18(12P12.1) CNV | 286 | 62.5 (11.2) |
| AMP PEAK 18(12P12.1) WILD-TYPE | 255 | 56.8 (11.4) |
Figure S4. Get High-res Image Gene #18: 'Amp Peak 18(12p12.1)' versus Clinical Feature #2: 'AGE'
P value = 1.19e-05 (t-test), Q value = 0.0057
Table S5. Gene #25: 'Amp Peak 25(19q12)' versus Clinical Feature #2: 'AGE'
| nPatients | Mean (Std.Dev) | |
|---|---|---|
| ALL | 541 | 59.8 (11.6) |
| AMP PEAK 25(19Q12) CNV | 300 | 61.8 (11.1) |
| AMP PEAK 25(19Q12) WILD-TYPE | 241 | 57.4 (11.7) |
Figure S5. Get High-res Image Gene #25: 'Amp Peak 25(19q12)' versus Clinical Feature #2: 'AGE'
P value = 3.37e-06 (t-test), Q value = 0.0016
Table S6. Gene #26: 'Amp Peak 26(19q13.2)' versus Clinical Feature #2: 'AGE'
| nPatients | Mean (Std.Dev) | |
|---|---|---|
| ALL | 541 | 59.8 (11.6) |
| AMP PEAK 26(19Q13.2) CNV | 228 | 62.5 (11.2) |
| AMP PEAK 26(19Q13.2) WILD-TYPE | 313 | 57.8 (11.5) |
Figure S6. Get High-res Image Gene #26: 'Amp Peak 26(19q13.2)' versus Clinical Feature #2: 'AGE'
P value = 7.62e-08 (t-test), Q value = 3.7e-05
Table S7. Gene #28: 'Amp Peak 28(20q11.21)' versus Clinical Feature #2: 'AGE'
| nPatients | Mean (Std.Dev) | |
|---|---|---|
| ALL | 541 | 59.8 (11.6) |
| AMP PEAK 28(20Q11.21) CNV | 315 | 62.0 (11.5) |
| AMP PEAK 28(20Q11.21) WILD-TYPE | 226 | 56.7 (11.0) |
Figure S7. Get High-res Image Gene #28: 'Amp Peak 28(20q11.21)' versus Clinical Feature #2: 'AGE'
P value = 9.1e-06 (t-test), Q value = 0.0044
Table S8. Gene #29: 'Amp Peak 29(20q13.33)' versus Clinical Feature #2: 'AGE'
| nPatients | Mean (Std.Dev) | |
|---|---|---|
| ALL | 541 | 59.8 (11.6) |
| AMP PEAK 29(20Q13.33) CNV | 376 | 61.2 (11.5) |
| AMP PEAK 29(20Q13.33) WILD-TYPE | 165 | 56.5 (11.1) |
Figure S8. Get High-res Image Gene #29: 'Amp Peak 29(20q13.33)' versus Clinical Feature #2: 'AGE'
P value = 7.72e-05 (t-test), Q value = 0.037
Table S9. Gene #60: 'Del Peak 28(16q23.1)' versus Clinical Feature #2: 'AGE'
| nPatients | Mean (Std.Dev) | |
|---|---|---|
| ALL | 541 | 59.8 (11.6) |
| DEL PEAK 28(16Q23.1) CNV | 423 | 60.8 (11.5) |
| DEL PEAK 28(16Q23.1) WILD-TYPE | 118 | 56.1 (11.2) |
Figure S9. Get High-res Image Gene #60: 'Del Peak 28(16q23.1)' versus Clinical Feature #2: 'AGE'
-
Mutation data file = all_lesions.conf_99.cnv.cluster.txt
-
Clinical data file = OV-TP.clin.merged.picked.txt
-
Number of patients = 562
-
Number of significantly arm-level cnvs = 69
-
Number of selected clinical features = 7
-
Exclude genes that fewer than K tumors have mutations, K = 3
For survival clinical features, the Kaplan-Meier survival curves of tumors with and without gene mutations were plotted and the statistical significance P values were estimated by logrank test (Bland and Altman 2004) using the 'survdiff' function in R
For continuous numerical clinical features, two-tailed Student's t test with unequal variance (Lehmann and Romano 2005) was applied to compare the clinical values between tumors with and without gene mutations using 't.test' function in R
For binary or multi-class clinical features (nominal or ordinal), two-tailed Fisher's exact tests (Fisher 1922) were used to estimate the P values using the 'fisher.test' function in R
For multiple hypothesis correction, Q value is the False Discovery Rate (FDR) analogue of the P value (Benjamini and Hochberg 1995), defined as the minimum FDR at which the test may be called significant. We used the 'Benjamini and Hochberg' method of 'p.adjust' function in R to convert P values into Q values.
This is an experimental feature. The full results of the analysis summarized in this report can be downloaded from the TCGA Data Coordination Center.