This pipeline uses various statistical tests to identify mRNAs whose expression levels correlated to selected clinical features.
Testing the association between 18632 genes and 7 clinical features across 562 samples, statistically thresholded by Q value < 0.05, 6 clinical features related to at least one genes.
-
1 gene correlated to 'Time to Death'.
-
ZFHX4
-
183 genes correlated to 'AGE'.
-
STS , GNPNAT1 , GREB1 , DEPDC6 , SLCO1A2 , ...
-
4 genes correlated to 'PRIMARY.SITE.OF.DISEASE'.
-
SPINK8 , PTBP1 , EBI3 , LOC390110
-
1 gene correlated to 'KARNOFSKY.PERFORMANCE.SCORE'.
-
WDR60
-
28 genes correlated to 'TUMOR.STAGE'.
-
BACE1 , PTRF , FREQ , PRRG1 , GAS1 , ...
-
25 genes correlated to 'RADIATIONS.RADIATION.REGIMENINDICATION'.
-
RAPGEF1 , SNX9 , EIF4G2 , PRRX1 , ZNF507 , ...
-
No genes correlated to 'COMPLETENESS.OF.RESECTION'
Complete statistical result table is provided in Supplement Table 1
Table 1. Get Full Table This table shows the clinical features, statistical methods used, and the number of genes that are significantly associated with each clinical feature at Q value < 0.05.
| Clinical feature | Statistical test | Significant genes | Associated with | Associated with | ||
|---|---|---|---|---|---|---|
| Time to Death | Cox regression test | N=1 | shorter survival | N=1 | longer survival | N=0 |
| AGE | Spearman correlation test | N=183 | older | N=73 | younger | N=110 |
| PRIMARY SITE OF DISEASE | ANOVA test | N=4 | ||||
| KARNOFSKY PERFORMANCE SCORE | Spearman correlation test | N=1 | higher score | N=1 | lower score | N=0 |
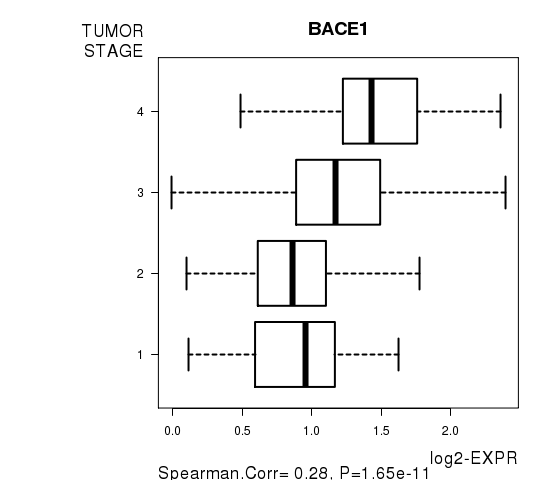
| TUMOR STAGE | Spearman correlation test | N=28 | higher stage | N=25 | lower stage | N=3 |
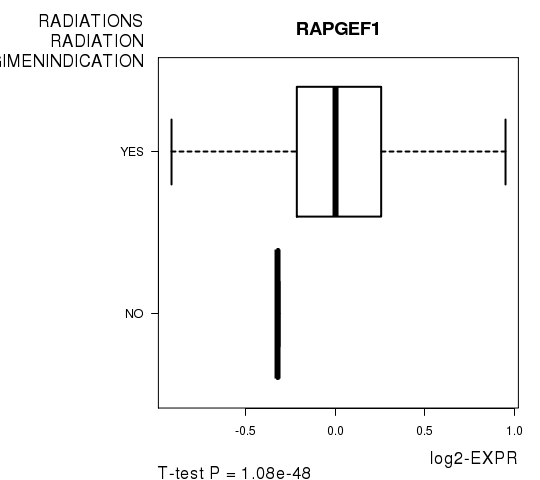
| RADIATIONS RADIATION REGIMENINDICATION | t test | N=25 | yes | N=18 | no | N=7 |
| COMPLETENESS OF RESECTION | t test | N=0 |
Table S1. Basic characteristics of clinical feature: 'Time to Death'
| Time to Death | Duration (Months) | 0.3-180.2 (median=28.3) |
| censored | N = 267 | |
| death | N = 290 | |
| Significant markers | N = 1 | |
| associated with shorter survival | 1 | |
| associated with longer survival | 0 |
Table S2. Get Full Table List of one gene significantly associated with 'Time to Death' by Cox regression test
| HazardRatio | Wald_P | Q | C_index | |
|---|---|---|---|---|
| ZFHX4 | 1.63 | 1.961e-06 | 0.037 | 0.574 |
Figure S1. Get High-res Image As an example, this figure shows the association of ZFHX4 to 'Time to Death'. four curves present the cumulative survival rates of 4 quartile subsets of patients. P value = 1.96e-06 with univariate Cox regression analysis using continuous log-2 expression values.
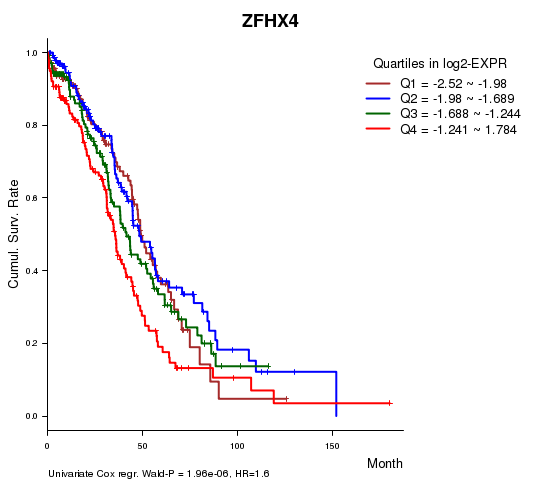
Table S3. Basic characteristics of clinical feature: 'AGE'
| AGE | Mean (SD) | 59.72 (12) |
| Significant markers | N = 183 | |
| pos. correlated | 73 | |
| neg. correlated | 110 |
Table S4. Get Full Table List of top 10 genes significantly correlated to 'AGE' by Spearman correlation test
| SpearmanCorr | corrP | Q | |
|---|---|---|---|
| STS | -0.3018 | 4.535e-13 | 8.45e-09 |
| GNPNAT1 | -0.2996 | 6.839e-13 | 1.27e-08 |
| GREB1 | -0.2984 | 8.545e-13 | 1.59e-08 |
| DEPDC6 | -0.2979 | 9.442e-13 | 1.76e-08 |
| SLCO1A2 | 0.2878 | 5.726e-12 | 1.07e-07 |
| EIF4E3 | -0.2849 | 9.423e-12 | 1.76e-07 |
| NPAL2 | -0.2736 | 6.483e-11 | 1.21e-06 |
| C9ORF103 | -0.2731 | 6.964e-11 | 1.3e-06 |
| GEMIN8 | -0.27 | 1.16e-10 | 2.16e-06 |
| ODZ1 | 0.2688 | 1.416e-10 | 2.64e-06 |
Figure S2. Get High-res Image As an example, this figure shows the association of STS to 'AGE'. P value = 4.54e-13 with Spearman correlation analysis. The straight line presents the best linear regression.
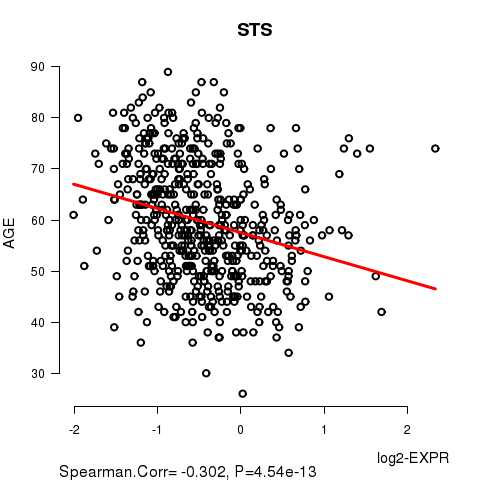
Table S5. Basic characteristics of clinical feature: 'PRIMARY.SITE.OF.DISEASE'
| PRIMARY.SITE.OF.DISEASE | Labels | N |
| OMENTUM | 2 | |
| OVARY | 558 | |
| PERITONEUM (OVARY) | 2 | |
| Significant markers | N = 4 |
Table S6. Get Full Table List of 4 genes differentially expressed by 'PRIMARY.SITE.OF.DISEASE'
| ANOVA_P | Q | |
|---|---|---|
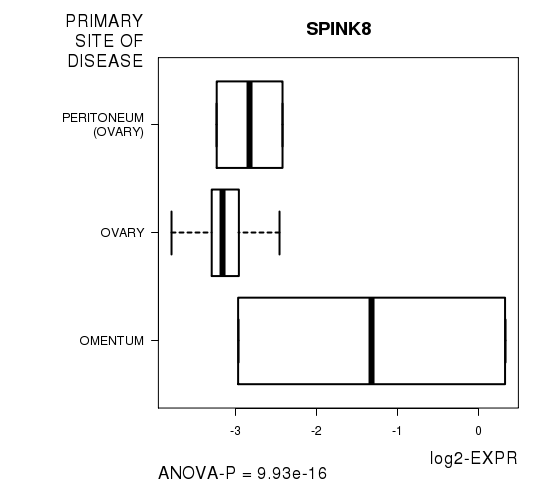
| SPINK8 | 9.933e-16 | 1.85e-11 |
| PTBP1 | 1.007e-08 | 0.000188 |
| EBI3 | 4.195e-07 | 0.00781 |
| LOC390110 | 2.486e-06 | 0.0463 |
Figure S3. Get High-res Image As an example, this figure shows the association of SPINK8 to 'PRIMARY.SITE.OF.DISEASE'. P value = 9.93e-16 with ANOVA analysis.
One gene related to 'KARNOFSKY.PERFORMANCE.SCORE'.
Table S7. Basic characteristics of clinical feature: 'KARNOFSKY.PERFORMANCE.SCORE'
| KARNOFSKY.PERFORMANCE.SCORE | Mean (SD) | 75.64 (13) |
| Score | N | |
| 40 | 2 | |
| 60 | 20 | |
| 80 | 49 | |
| 100 | 7 | |
| Significant markers | N = 1 | |
| pos. correlated | 1 | |
| neg. correlated | 0 |
Table S8. Get Full Table List of one gene significantly correlated to 'KARNOFSKY.PERFORMANCE.SCORE' by Spearman correlation test
| SpearmanCorr | corrP | Q | |
|---|---|---|---|
| WDR60 | 0.5131 | 1.561e-06 | 0.0291 |
Figure S4. Get High-res Image As an example, this figure shows the association of WDR60 to 'KARNOFSKY.PERFORMANCE.SCORE'. P value = 1.56e-06 with Spearman correlation analysis.
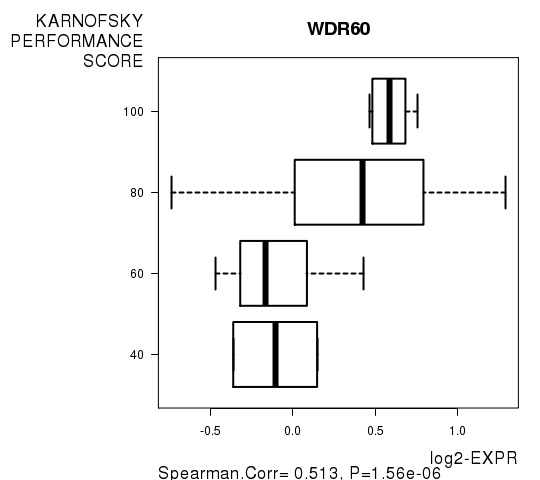
Table S9. Basic characteristics of clinical feature: 'TUMOR.STAGE'
| TUMOR.STAGE | Mean (SD) | 3.05 (0.56) |
| N | ||
| Stage 1 | 16 | |
| Stage 2 | 26 | |
| Stage 3 | 431 | |
| Stage 4 | 85 | |
| Significant markers | N = 28 | |
| pos. correlated | 25 | |
| neg. correlated | 3 |
Table S10. Get Full Table List of top 10 genes significantly correlated to 'TUMOR.STAGE' by Spearman correlation test
| SpearmanCorr | corrP | Q | |
|---|---|---|---|
| BACE1 | 0.28 | 1.654e-11 | 3.08e-07 |
| PTRF | 0.2454 | 4.269e-09 | 7.95e-05 |
| FREQ | 0.2307 | 3.545e-08 | 0.00066 |
| PRRG1 | 0.2299 | 3.972e-08 | 0.00074 |
| GAS1 | 0.2222 | 1.131e-07 | 0.00211 |
| PDK1 | -0.2199 | 1.541e-07 | 0.00287 |
| PLCD3 | 0.2178 | 2.043e-07 | 0.00381 |
| CELSR2 | 0.2135 | 3.564e-07 | 0.00664 |
| NBL1 | 0.2112 | 4.791e-07 | 0.00892 |
| AKAP12 | 0.2091 | 6.215e-07 | 0.0116 |
Figure S5. Get High-res Image As an example, this figure shows the association of BACE1 to 'TUMOR.STAGE'. P value = 1.65e-11 with Spearman correlation analysis.
25 genes related to 'RADIATIONS.RADIATION.REGIMENINDICATION'.
Table S11. Basic characteristics of clinical feature: 'RADIATIONS.RADIATION.REGIMENINDICATION'
| RADIATIONS.RADIATION.REGIMENINDICATION | Labels | N |
| NO | 3 | |
| YES | 559 | |
| Significant markers | N = 25 | |
| Higher in YES | 18 | |
| Higher in NO | 7 |
Table S12. Get Full Table List of top 10 genes differentially expressed by 'RADIATIONS.RADIATION.REGIMENINDICATION'
| T(pos if higher in 'YES') | ttestP | Q | AUC | |
|---|---|---|---|---|
| RAPGEF1 | 21.41 | 1.075e-48 | 2e-44 | 0.8372 |
| SNX9 | -15.64 | 3.191e-33 | 5.94e-29 | 0.7633 |
| EIF4G2 | 14.34 | 1.53e-23 | 2.85e-19 | 0.7639 |
| PRRX1 | 13.55 | 1.099e-19 | 2.05e-15 | 0.653 |
| ZNF507 | -23.17 | 5.921e-15 | 1.1e-10 | 0.8998 |
| ACTL7B | -11.46 | 7.486e-15 | 1.39e-10 | 0.7102 |
| CNKSR2 | -8.77 | 1.11e-14 | 2.07e-10 | 0.7257 |
| AKAP9 | 16.71 | 2.413e-14 | 4.49e-10 | 0.7895 |
| CRIP2 | 9.87 | 2.984e-14 | 5.56e-10 | 0.6947 |
| CALR | 7.62 | 1.079e-13 | 2.01e-09 | 0.5963 |
Figure S6. Get High-res Image As an example, this figure shows the association of RAPGEF1 to 'RADIATIONS.RADIATION.REGIMENINDICATION'. P value = 1.08e-48 with T-test analysis.
-
Expresson data file = OV-TP.medianexp.txt
-
Clinical data file = OV-TP.clin.merged.picked.txt
-
Number of patients = 562
-
Number of genes = 18632
-
Number of clinical features = 7
For survival clinical features, Wald's test in univariate Cox regression analysis with proportional hazards model (Andersen and Gill 1982) was used to estimate the P values using the 'coxph' function in R. Kaplan-Meier survival curves were plot using the four quartile subgroups of patients based on expression levels
For continuous numerical clinical features, Spearman's rank correlation coefficients (Spearman 1904) and two-tailed P values were estimated using 'cor.test' function in R
For multi-class clinical features (ordinal or nominal), one-way analysis of variance (Howell 2002) was applied to compare the log2-expression levels between different clinical classes using 'anova' function in R
For two-class clinical features, two-tailed Student's t test with unequal variance (Lehmann and Romano 2005) was applied to compare the log2-expression levels between the two clinical classes using 't.test' function in R
For multiple hypothesis correction, Q value is the False Discovery Rate (FDR) analogue of the P value (Benjamini and Hochberg 1995), defined as the minimum FDR at which the test may be called significant. We used the 'Benjamini and Hochberg' method of 'p.adjust' function in R to convert P values into Q values.
This is an experimental feature. The full results of the analysis summarized in this report can be downloaded from the TCGA Data Coordination Center.