This pipeline uses various statistical tests to identify mRNAs whose expression levels correlated to selected clinical features.
Testing the association between 18555 genes and 4 clinical features across 261 samples, statistically thresholded by Q value < 0.05, 3 clinical features related to at least one genes.
-
1 gene correlated to 'Time to Death'.
-
KRTCAP3|200634
-
57 genes correlated to 'AGE'.
-
STS|412 , LRP6|4040 , C8ORF55|51337 , EIF4E3|317649 , C12ORF4|57102 , ...
-
1 gene correlated to 'TUMOR.STAGE'.
-
BACE1|23621
-
No genes correlated to 'KARNOFSKY.PERFORMANCE.SCORE'
Complete statistical result table is provided in Supplement Table 1
Table 1. Get Full Table This table shows the clinical features, statistical methods used, and the number of genes that are significantly associated with each clinical feature at Q value < 0.05.
| Clinical feature | Statistical test | Significant genes | Associated with | Associated with | ||
|---|---|---|---|---|---|---|
| Time to Death | Cox regression test | N=1 | shorter survival | N=0 | longer survival | N=1 |
| AGE | Spearman correlation test | N=57 | older | N=30 | younger | N=27 |
| KARNOFSKY PERFORMANCE SCORE | Spearman correlation test | N=0 | ||||
| TUMOR STAGE | Spearman correlation test | N=1 | higher stage | N=1 | lower stage | N=0 |
Table S1. Basic characteristics of clinical feature: 'Time to Death'
| Time to Death | Duration (Months) | 0.3-180.2 (median=28.2) |
| censored | N = 112 | |
| death | N = 147 | |
| Significant markers | N = 1 | |
| associated with shorter survival | 0 | |
| associated with longer survival | 1 |
Table S2. Get Full Table List of one gene significantly associated with 'Time to Death' by Cox regression test
| HazardRatio | Wald_P | Q | C_index | |
|---|---|---|---|---|
| KRTCAP3|200634 | 0.68 | 2.147e-06 | 0.04 | 0.403 |
Figure S1. Get High-res Image As an example, this figure shows the association of KRTCAP3|200634 to 'Time to Death'. four curves present the cumulative survival rates of 4 quartile subsets of patients. P value = 2.15e-06 with univariate Cox regression analysis using continuous log-2 expression values.
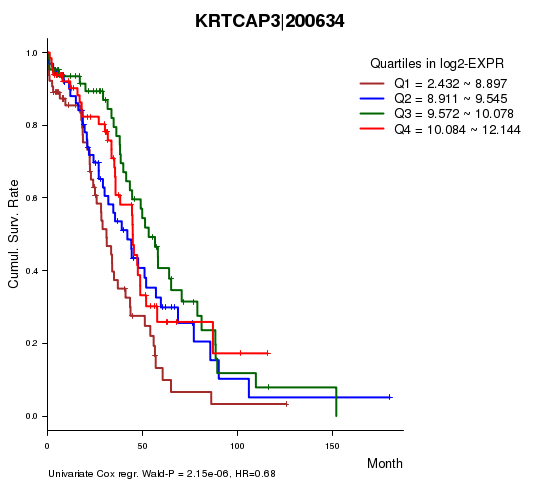
Table S3. Basic characteristics of clinical feature: 'AGE'
| AGE | Mean (SD) | 58.95 (11) |
| Significant markers | N = 57 | |
| pos. correlated | 30 | |
| neg. correlated | 27 |
Table S4. Get Full Table List of top 10 genes significantly correlated to 'AGE' by Spearman correlation test
| SpearmanCorr | corrP | Q | |
|---|---|---|---|
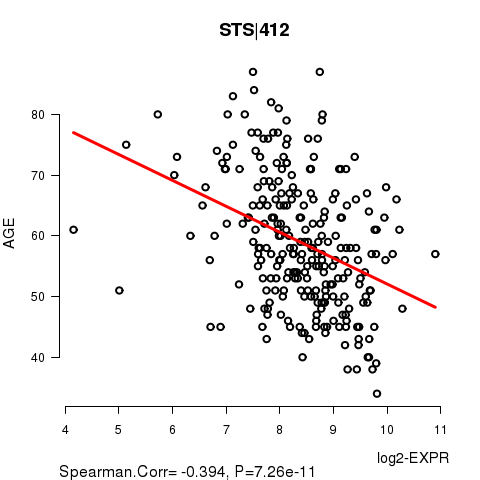
| STS|412 | -0.3941 | 7.256e-11 | 1.35e-06 |
| LRP6|4040 | 0.3679 | 1.469e-09 | 2.72e-05 |
| C8ORF55|51337 | -0.3595 | 3.661e-09 | 6.79e-05 |
| EIF4E3|317649 | -0.3556 | 5.503e-09 | 0.000102 |
| C12ORF4|57102 | 0.3554 | 5.62e-09 | 0.000104 |
| APPL2|55198 | 0.3475 | 1.28e-08 | 0.000237 |
| PDHA1|5160 | -0.3457 | 1.528e-08 | 0.000283 |
| GREB1|9687 | -0.3447 | 1.698e-08 | 0.000315 |
| CLSTN3|9746 | 0.3436 | 1.892e-08 | 0.000351 |
| ADAM15|8751 | -0.3408 | 2.507e-08 | 0.000465 |
Figure S2. Get High-res Image As an example, this figure shows the association of STS|412 to 'AGE'. P value = 7.26e-11 with Spearman correlation analysis. The straight line presents the best linear regression.
No gene related to 'KARNOFSKY.PERFORMANCE.SCORE'.
Table S5. Basic characteristics of clinical feature: 'KARNOFSKY.PERFORMANCE.SCORE'
| KARNOFSKY.PERFORMANCE.SCORE | Mean (SD) | 74.29 (12) |
| Score | N | |
| 60 | 5 | |
| 80 | 8 | |
| 100 | 1 | |
| Significant markers | N = 0 |
Table S6. Basic characteristics of clinical feature: 'TUMOR.STAGE'
| TUMOR.STAGE | Mean (SD) | 3.06 (0.44) |
| N | ||
| Stage 2 | 18 | |
| Stage 3 | 209 | |
| Stage 4 | 33 | |
| Significant markers | N = 1 | |
| pos. correlated | 1 | |
| neg. correlated | 0 |
Table S7. Get Full Table List of one gene significantly correlated to 'TUMOR.STAGE' by Spearman correlation test
| SpearmanCorr | corrP | Q | |
|---|---|---|---|
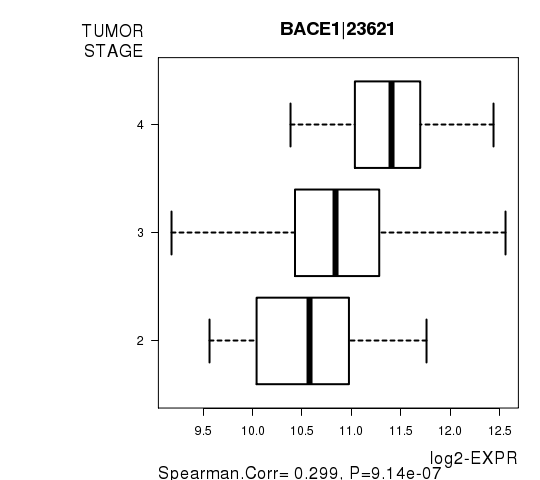
| BACE1|23621 | 0.2989 | 9.136e-07 | 0.017 |
Figure S3. Get High-res Image As an example, this figure shows the association of BACE1|23621 to 'TUMOR.STAGE'. P value = 9.14e-07 with Spearman correlation analysis.
-
Expresson data file = OV-TP.uncv2.mRNAseq_RSEM_normalized_log2.txt
-
Clinical data file = OV-TP.clin.merged.picked.txt
-
Number of patients = 261
-
Number of genes = 18555
-
Number of clinical features = 4
For survival clinical features, Wald's test in univariate Cox regression analysis with proportional hazards model (Andersen and Gill 1982) was used to estimate the P values using the 'coxph' function in R. Kaplan-Meier survival curves were plot using the four quartile subgroups of patients based on expression levels
For continuous numerical clinical features, Spearman's rank correlation coefficients (Spearman 1904) and two-tailed P values were estimated using 'cor.test' function in R
For multiple hypothesis correction, Q value is the False Discovery Rate (FDR) analogue of the P value (Benjamini and Hochberg 1995), defined as the minimum FDR at which the test may be called significant. We used the 'Benjamini and Hochberg' method of 'p.adjust' function in R to convert P values into Q values.
This is an experimental feature. The full results of the analysis summarized in this report can be downloaded from the TCGA Data Coordination Center.