This pipeline uses various statistical tests to identify mRNAs whose expression levels correlated to selected clinical features.
Testing the association between 17814 genes and 19 clinical features across 1593 samples, statistically thresholded by Q value < 0.05, 16 clinical features related to at least one genes.
-
3018 genes correlated to 'Time to Death'.
-
KLHL14 , ASS1 , IGSF11 , UPK1B , C4ORF32 , ...
-
3682 genes correlated to 'AGE'.
-
GREB1 , COL18A1 , DUOX2 , LDOC1 , GALNTL1 , ...
-
17315 genes correlated to 'PRIMARY.SITE.OF.DISEASE'.
-
KLHL14 , ZG16 , SLC22A2 , PDZD3 , EMX2 , ...
-
8993 genes correlated to 'GENDER'.
-
ESR1 , RSPO1 , DDX3Y , RPS4Y1 , EIF1AY , ...
-
206 genes correlated to 'KARNOFSKY.PERFORMANCE.SCORE'.
-
PPP1R9A , VASN , MARCH7 , CCDC135 , POGZ , ...
-
16971 genes correlated to 'HISTOLOGICAL.TYPE'.
-
KLHL14 , PDZD3 , EMX2 , NPR1 , FUT4 , ...
-
5911 genes correlated to 'PATHOLOGY.T'.
-
C13ORF3 , NR3C1 , CDCA7 , LIFR , C20ORF151 , ...
-
16 genes correlated to 'PATHOLOGY.N'.
-
TNFRSF10C , FAM73A , MGC50559 , ZNF273 , GABARAP , ...
-
30 genes correlated to 'PATHOLOGICSPREAD(M)'.
-
KCNC2 , TCF7 , HCN1 , C8ORF30A , SPACA3 , ...
-
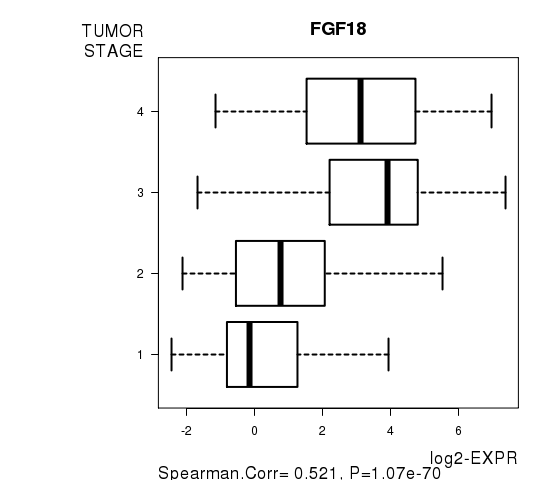
7395 genes correlated to 'TUMOR.STAGE'.
-
FGF18 , WT1 , KITLG , RBM38 , ELL2 , ...
-
5814 genes correlated to 'RADIATIONS.RADIATION.REGIMENINDICATION'.
-
CYP3A5 , CYP3A7 , CYP3A4 , TCF21 , MAP2K7 , ...
-
9 genes correlated to 'TOBACCOSMOKINGHISTORYINDICATOR'.
-
PSME4 , C1ORF64 , LMNB2 , LONP1 , SLC25A1 , ...
-
1 gene correlated to 'YEAROFTOBACCOSMOKINGONSET'.
-
MMP10
-
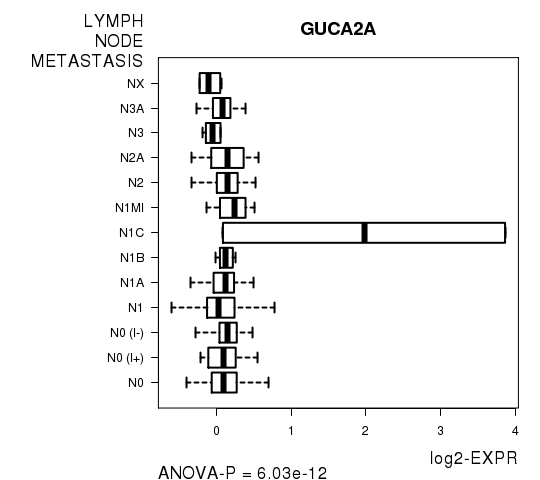
2 genes correlated to 'LYMPH.NODE.METASTASIS'.
-
GUCA2A , ASZ1
-
2319 genes correlated to 'COMPLETENESS.OF.RESECTION'.
-
NPR1 , WIT1 , DOK5 , THRSP , KLHL14 , ...
-
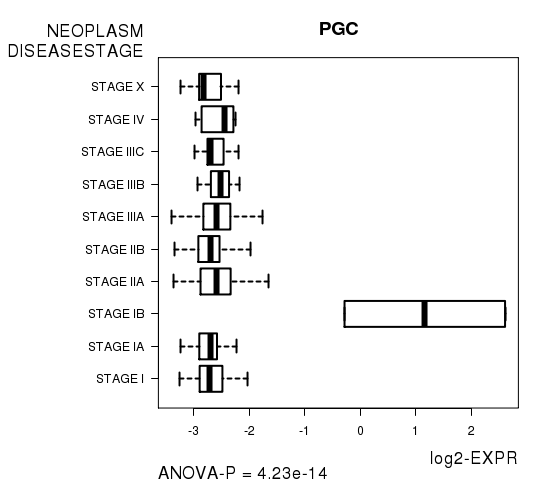
5 genes correlated to 'NEOPLASM.DISEASESTAGE'.
-
PGC , BMPER , LRP4 , GPER , PRSS2
-
No genes correlated to 'NUMBERPACKYEARSSMOKED', 'DISTANT.METASTASIS', and 'NUMBER.OF.LYMPH.NODES'.
Complete statistical result table is provided in Supplement Table 1
Table 1. Get Full Table This table shows the clinical features, statistical methods used, and the number of genes that are significantly associated with each clinical feature at Q value < 0.05.
| Clinical feature | Statistical test | Significant genes | Associated with | Associated with | ||
|---|---|---|---|---|---|---|
| Time to Death | Cox regression test | N=3018 | shorter survival | N=1360 | longer survival | N=1658 |
| AGE | Spearman correlation test | N=3682 | older | N=1748 | younger | N=1934 |
| PRIMARY SITE OF DISEASE | ANOVA test | N=17315 | ||||
| GENDER | t test | N=8993 | male | N=4112 | female | N=4881 |
| KARNOFSKY PERFORMANCE SCORE | Spearman correlation test | N=206 | higher score | N=129 | lower score | N=77 |
| HISTOLOGICAL TYPE | ANOVA test | N=16971 | ||||
| PATHOLOGY T | Spearman correlation test | N=5911 | higher pT | N=3176 | lower pT | N=2735 |
| PATHOLOGY N | Spearman correlation test | N=16 | higher pN | N=3 | lower pN | N=13 |
| PATHOLOGICSPREAD(M) | ANOVA test | N=30 | ||||
| TUMOR STAGE | Spearman correlation test | N=7395 | higher stage | N=3996 | lower stage | N=3399 |
| RADIATIONS RADIATION REGIMENINDICATION | t test | N=5814 | yes | N=2865 | no | N=2949 |
| NUMBERPACKYEARSSMOKED | Spearman correlation test | N=0 | ||||
| TOBACCOSMOKINGHISTORYINDICATOR | ANOVA test | N=9 | ||||
| YEAROFTOBACCOSMOKINGONSET | Spearman correlation test | N=1 | higher yearoftobaccosmokingonset | N=0 | lower yearoftobaccosmokingonset | N=1 |
| DISTANT METASTASIS | ANOVA test | N=0 | ||||
| LYMPH NODE METASTASIS | ANOVA test | N=2 | ||||
| COMPLETENESS OF RESECTION | ANOVA test | N=2319 | ||||
| NUMBER OF LYMPH NODES | Spearman correlation test | N=0 | ||||
| NEOPLASM DISEASESTAGE | ANOVA test | N=5 |
Table S1. Basic characteristics of clinical feature: 'Time to Death'
| Time to Death | Duration (Months) | 0.1-223.4 (median=23) |
| censored | N = 1000 | |
| death | N = 437 | |
| Significant markers | N = 3018 | |
| associated with shorter survival | 1360 | |
| associated with longer survival | 1658 |
Table S2. Get Full Table List of top 10 genes significantly associated with 'Time to Death' by Cox regression test
| HazardRatio | Wald_P | Q | C_index | |
|---|---|---|---|---|
| KLHL14 | 1.26 | 0 | 0 | 0.6 |
| ASS1 | 1.32 | 0 | 0 | 0.621 |
| IGSF11 | 1.36 | 0 | 0 | 0.641 |
| UPK1B | 1.21 | 0 | 0 | 0.636 |
| C4ORF32 | 0.77 | 0 | 0 | 0.38 |
| ZRSR1 | 0.55 | 0 | 0 | 0.349 |
| MDS1 | 1.37 | 0 | 0 | 0.621 |
| GALNT12 | 1.31 | 0 | 0 | 0.616 |
| MUC4 | 1.22 | 0 | 0 | 0.635 |
| NUBP1 | 0.46 | 0 | 0 | 0.354 |
Figure S1. Get High-res Image As an example, this figure shows the association of KLHL14 to 'Time to Death'. four curves present the cumulative survival rates of 4 quartile subsets of patients. P value = 0 with univariate Cox regression analysis using continuous log-2 expression values.
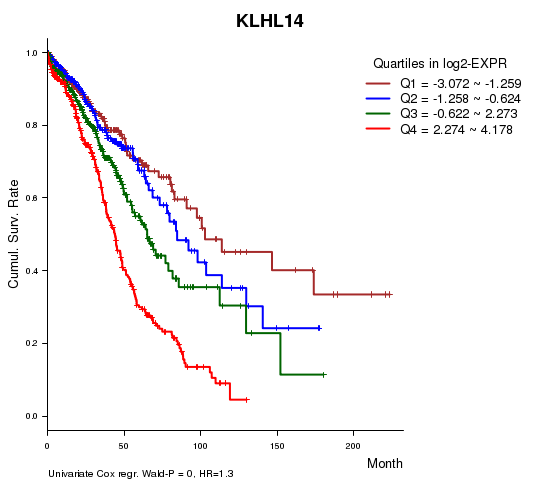
Table S3. Basic characteristics of clinical feature: 'AGE'
| AGE | Mean (SD) | 61.39 (13) |
| Significant markers | N = 3682 | |
| pos. correlated | 1748 | |
| neg. correlated | 1934 |
Table S4. Get Full Table List of top 10 genes significantly correlated to 'AGE' by Spearman correlation test
| SpearmanCorr | corrP | Q | |
|---|---|---|---|
| GREB1 | -0.288 | 1.648e-31 | 2.94e-27 |
| COL18A1 | -0.2771 | 3.469e-29 | 6.18e-25 |
| DUOX2 | 0.2769 | 3.755e-29 | 6.69e-25 |
| LDOC1 | -0.2689 | 1.588e-27 | 2.83e-23 |
| GALNTL1 | -0.2672 | 3.515e-27 | 6.26e-23 |
| OBSL1 | -0.2646 | 1.107e-26 | 1.97e-22 |
| FOXF1 | 0.262 | 3.685e-26 | 6.56e-22 |
| CYP2C18 | 0.2605 | 6.935e-26 | 1.23e-21 |
| BBOX1 | -0.2573 | 2.842e-25 | 5.06e-21 |
| SH3BP5 | -0.2572 | 3.097e-25 | 5.51e-21 |
Figure S2. Get High-res Image As an example, this figure shows the association of GREB1 to 'AGE'. P value = 1.65e-31 with Spearman correlation analysis. The straight line presents the best linear regression.
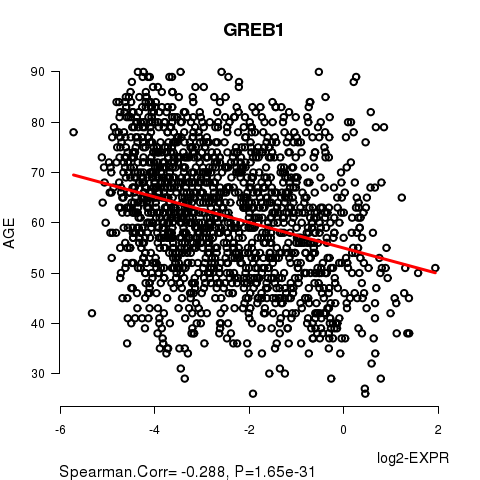
Table S5. Basic characteristics of clinical feature: 'PRIMARY.SITE.OF.DISEASE'
| PRIMARY.SITE.OF.DISEASE | Labels | N |
| BREAST | 526 | |
| COLON | 152 | |
| ENDOMETRIAL | 54 | |
| KIDNEY | 72 | |
| LUNG | 186 | |
| OMENTUM | 2 | |
| OVARY | 529 | |
| PERITONEUM (OVARY) | 2 | |
| RECTUM | 68 | |
| Significant markers | N = 17315 |
Table S6. Get Full Table List of top 10 genes differentially expressed by 'PRIMARY.SITE.OF.DISEASE'
| ANOVA_P | Q | |
|---|---|---|
| KLHL14 | 0 | 0 |
| ZG16 | 0 | 0 |
| SLC22A2 | 0 | 0 |
| PDZD3 | 0 | 0 |
| EMX2 | 0 | 0 |
| NPR1 | 0 | 0 |
| FUT4 | 0 | 0 |
| ACF | 0 | 0 |
| FXYD2 | 0 | 0 |
| UPK1B | 0 | 0 |
Figure S3. Get High-res Image As an example, this figure shows the association of KLHL14 to 'PRIMARY.SITE.OF.DISEASE'. P value = 0 with ANOVA analysis.
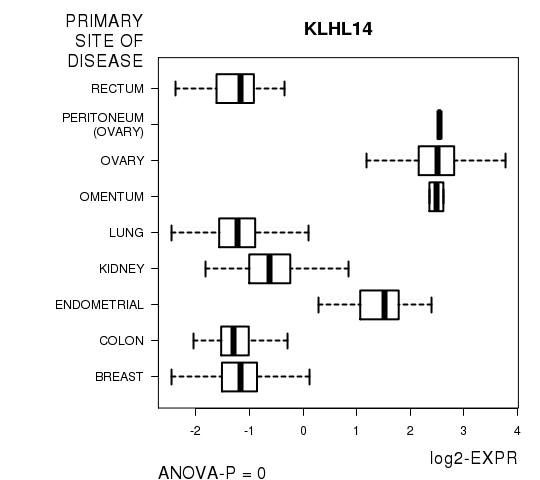
Table S7. Basic characteristics of clinical feature: 'GENDER'
| GENDER | Labels | N |
| FEMALE | 1304 | |
| MALE | 289 | |
| Significant markers | N = 8993 | |
| Higher in MALE | 4112 | |
| Higher in FEMALE | 4881 |
Table S8. Get Full Table List of top 10 genes differentially expressed by 'GENDER'
| T(pos if higher in 'MALE') | ttestP | Q | AUC | |
|---|---|---|---|---|
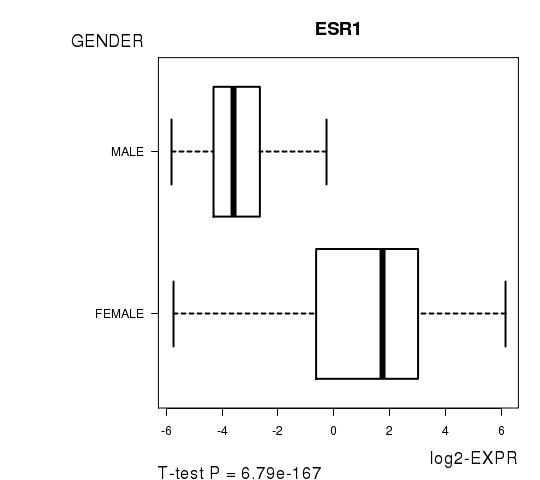
| ESR1 | -36.23 | 6.789e-167 | 1.21e-162 | 0.8781 |
| RSPO1 | -31.56 | 9.619e-167 | 1.71e-162 | 0.8493 |
| DDX3Y | 53.31 | 9.336e-164 | 1.66e-159 | 0.9839 |
| RPS4Y1 | 51.76 | 1.437e-155 | 2.56e-151 | 0.9717 |
| EIF1AY | 48.93 | 2.175e-151 | 3.87e-147 | 0.9839 |
| RPS4Y2 | 48.54 | 8.57e-148 | 1.53e-143 | 0.9816 |
| ERBB4 | -32.63 | 1.134e-147 | 2.02e-143 | 0.8588 |
| JARID1D | 44.53 | 5.72e-147 | 1.02e-142 | 0.9762 |
| SCGB2A2 | -29.47 | 7.483e-146 | 1.33e-141 | 0.8574 |
| CYORF15A | 43.55 | 3.378e-139 | 6.01e-135 | 0.9813 |
Figure S4. Get High-res Image As an example, this figure shows the association of ESR1 to 'GENDER'. P value = 6.79e-167 with T-test analysis.
206 genes related to 'KARNOFSKY.PERFORMANCE.SCORE'.
Table S9. Basic characteristics of clinical feature: 'KARNOFSKY.PERFORMANCE.SCORE'
| KARNOFSKY.PERFORMANCE.SCORE | Mean (SD) | 60.22 (34) |
| Significant markers | N = 206 | |
| pos. correlated | 129 | |
| neg. correlated | 77 |
Table S10. Get Full Table List of top 10 genes significantly correlated to 'KARNOFSKY.PERFORMANCE.SCORE' by Spearman correlation test
| SpearmanCorr | corrP | Q | |
|---|---|---|---|
| PPP1R9A | 0.5916 | 4.259e-10 | 7.59e-06 |
| VASN | 0.5749 | 1.671e-09 | 2.98e-05 |
| MARCH7 | -0.5551 | 7.711e-09 | 0.000137 |
| CCDC135 | 0.5548 | 7.875e-09 | 0.00014 |
| POGZ | 0.5503 | 1.102e-08 | 0.000196 |
| INSIG2 | -0.5485 | 1.255e-08 | 0.000223 |
| ZNF503 | 0.5479 | 1.318e-08 | 0.000235 |
| TLE1 | 0.5448 | 1.642e-08 | 0.000292 |
| ADK | -0.5439 | 1.761e-08 | 0.000314 |
| PCYT1A | -0.5421 | 1.996e-08 | 0.000355 |
Figure S5. Get High-res Image As an example, this figure shows the association of PPP1R9A to 'KARNOFSKY.PERFORMANCE.SCORE'. P value = 4.26e-10 with Spearman correlation analysis. The straight line presents the best linear regression.
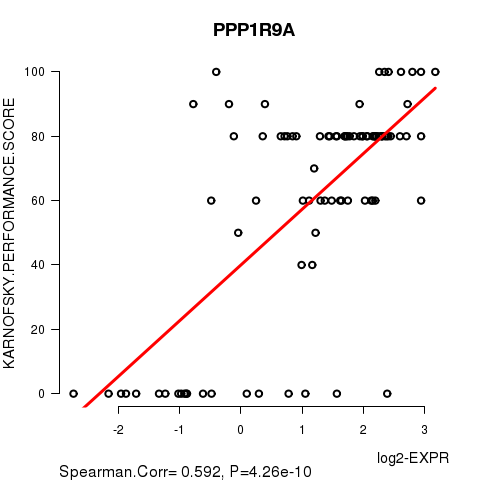
Table S11. Basic characteristics of clinical feature: 'HISTOLOGICAL.TYPE'
| HISTOLOGICAL.TYPE | Labels | N |
| COLON ADENOCARCINOMA | 126 | |
| COLON MUCINOUS ADENOCARCINOMA | 24 | |
| ENDOMETRIOID ENDOMETRIAL ADENOCARCINOMA | 41 | |
| INFILTRATING DUCTAL CARCINOMA | 110 | |
| INFILTRATING LOBULAR CARCINOMA | 12 | |
| KIDNEY CLEAR CELL RENAL CARCINOMA | 72 | |
| LUNG ADENOCARCINOMA MIXED SUBTYPE | 1 | |
| LUNG ADENOCARCINOMA- NOT OTHERWISE SPECIFIED (NOS) | 30 | |
| LUNG BASALOID SQUAMOUS CELL CARCINOMA | 5 | |
| LUNG CLEAR CELL ADENOCARCINOMA | 1 | |
| LUNG PAPILLARY SQUAMOUS CELL CARICNOMA | 1 | |
| LUNG SQUAMOUS CELL CARCINOMA- NOT OTHERWISE SPECIFIED (NOS) | 148 | |
| MIXED HISTOLOGY (PLEASE SPECIFY) | 5 | |
| MIXED SEROUS AND ENDOMETRIOID | 1 | |
| OTHER SPECIFY | 10 | |
| RECTAL ADENOCARCINOMA | 58 | |
| RECTAL MUCINOUS ADENOCARCINOMA | 7 | |
| SEROUS CYSTADENOCARCINOMA | 533 | |
| SEROUS ENDOMETRIAL ADENOCARCINOMA | 12 | |
| Significant markers | N = 16971 |
Table S12. Get Full Table List of top 10 genes differentially expressed by 'HISTOLOGICAL.TYPE'
| ANOVA_P | Q | |
|---|---|---|
| KLHL14 | 0 | 0 |
| PDZD3 | 0 | 0 |
| EMX2 | 0 | 0 |
| NPR1 | 0 | 0 |
| FUT4 | 0 | 0 |
| ACF | 0 | 0 |
| FXYD2 | 0 | 0 |
| SPINK4 | 0 | 0 |
| SFTPC | 0 | 0 |
| SLC12A2 | 0 | 0 |
Figure S6. Get High-res Image As an example, this figure shows the association of KLHL14 to 'HISTOLOGICAL.TYPE'. P value = 0 with ANOVA analysis.
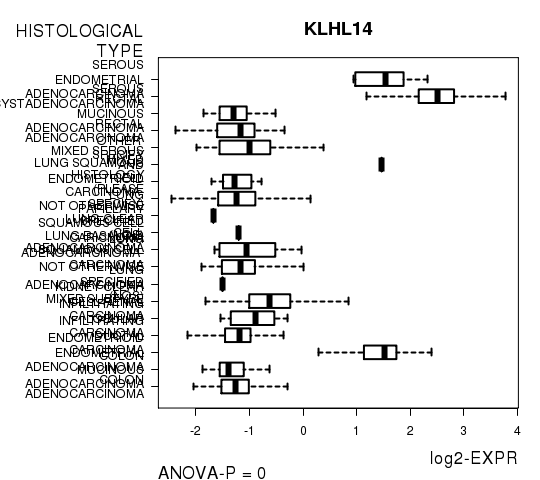
Table S13. Basic characteristics of clinical feature: 'PATHOLOGY.T'
| PATHOLOGY.T | Mean (SD) | 2.3 (0.85) |
| N | ||
| T1 | 92 | |
| T2 | 179 | |
| T3 | 178 | |
| T4 | 29 | |
| Significant markers | N = 5911 | |
| pos. correlated | 3176 | |
| neg. correlated | 2735 |
Table S14. Get Full Table List of top 10 genes significantly correlated to 'PATHOLOGY.T' by Spearman correlation test
| SpearmanCorr | corrP | Q | |
|---|---|---|---|
| C13ORF3 | 0.5211 | 1.264e-34 | 2.25e-30 |
| NR3C1 | -0.5184 | 3.085e-34 | 5.49e-30 |
| CDCA7 | 0.5156 | 7.924e-34 | 1.41e-29 |
| LIFR | -0.5143 | 1.235e-33 | 2.2e-29 |
| C20ORF151 | 0.5111 | 3.619e-33 | 6.45e-29 |
| NOXO1 | 0.5077 | 1.096e-32 | 1.95e-28 |
| PDSS1 | 0.5062 | 1.784e-32 | 3.18e-28 |
| B3GNT3 | 0.5004 | 1.188e-31 | 2.12e-27 |
| MAL | -0.4987 | 2.023e-31 | 3.6e-27 |
| POF1B | 0.4978 | 2.687e-31 | 4.78e-27 |
Figure S7. Get High-res Image As an example, this figure shows the association of C13ORF3 to 'PATHOLOGY.T'. P value = 1.26e-34 with Spearman correlation analysis.
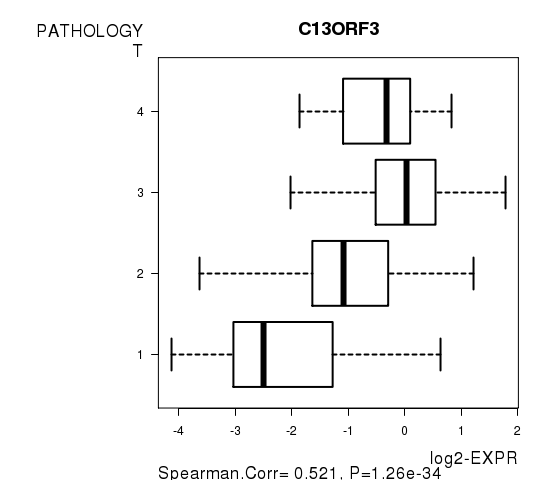
Table S15. Basic characteristics of clinical feature: 'PATHOLOGY.N'
| PATHOLOGY.N | Mean (SD) | 0.51 (0.77) |
| N | ||
| N0 | 290 | |
| N1 | 90 | |
| N2 | 60 | |
| N3 | 5 | |
| Significant markers | N = 16 | |
| pos. correlated | 3 | |
| neg. correlated | 13 |
Table S16. Get Full Table List of top 10 genes significantly correlated to 'PATHOLOGY.N' by Spearman correlation test
| SpearmanCorr | corrP | Q | |
|---|---|---|---|
| TNFRSF10C | -0.2603 | 2.519e-08 | 0.000449 |
| FAM73A | -0.2572 | 3.746e-08 | 0.000667 |
| MGC50559 | -0.2477 | 1.198e-07 | 0.00213 |
| ZNF273 | 0.2452 | 1.624e-07 | 0.00289 |
| GABARAP | -0.2423 | 2.285e-07 | 0.00407 |
| LUZP2 | 0.2388 | 3.561e-07 | 0.00634 |
| CNDP2 | -0.2304 | 8.931e-07 | 0.0159 |
| DHCR7 | 0.2301 | 9.331e-07 | 0.0166 |
| ZFP2 | -0.2294 | 1.007e-06 | 0.0179 |
| DCTN6 | -0.2263 | 1.417e-06 | 0.0252 |
Figure S8. Get High-res Image As an example, this figure shows the association of TNFRSF10C to 'PATHOLOGY.N'. P value = 2.52e-08 with Spearman correlation analysis.
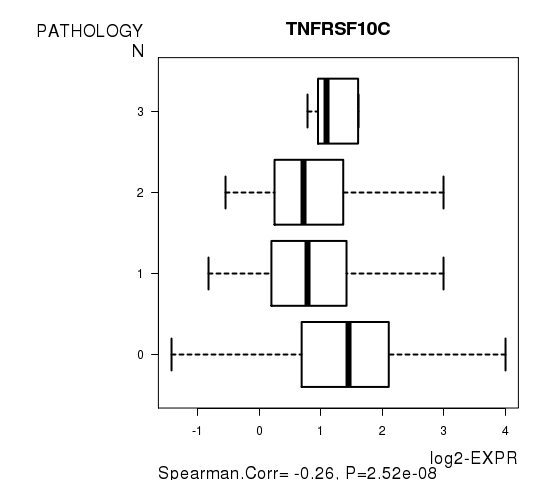
Table S17. Basic characteristics of clinical feature: 'PATHOLOGICSPREAD(M)'
| PATHOLOGICSPREAD(M) | Labels | N |
| M0 | 428 | |
| M1 | 44 | |
| M1A | 1 | |
| Significant markers | N = 30 |
Table S18. Get Full Table List of top 10 genes differentially expressed by 'PATHOLOGICSPREAD(M)'
| ANOVA_P | Q | |
|---|---|---|
| KCNC2 | 1.224e-09 | 2.18e-05 |
| TCF7 | 2.424e-08 | 0.000432 |
| HCN1 | 5.782e-08 | 0.00103 |
| C8ORF30A | 1.136e-07 | 0.00202 |
| SPACA3 | 2.624e-07 | 0.00467 |
| F10 | 4.444e-07 | 0.00791 |
| RBM26 | 5.393e-07 | 0.0096 |
| SERPINA4 | 6.055e-07 | 0.0108 |
| NPAS2 | 7.627e-07 | 0.0136 |
| PLOD3 | 9.144e-07 | 0.0163 |
Figure S9. Get High-res Image As an example, this figure shows the association of KCNC2 to 'PATHOLOGICSPREAD(M)'. P value = 1.22e-09 with ANOVA analysis.
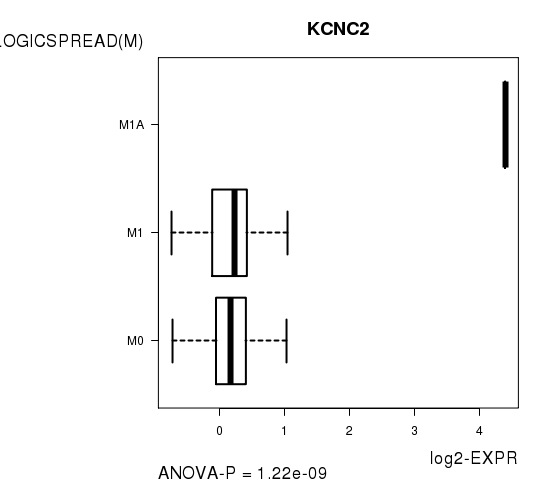
Table S19. Basic characteristics of clinical feature: 'TUMOR.STAGE'
| TUMOR.STAGE | Mean (SD) | 2.55 (0.95) |
| N | ||
| Stage 1 | 206 | |
| Stage 2 | 163 | |
| Stage 3 | 512 | |
| Stage 4 | 120 | |
| Significant markers | N = 7395 | |
| pos. correlated | 3996 | |
| neg. correlated | 3399 |
Table S20. Get Full Table List of top 10 genes significantly correlated to 'TUMOR.STAGE' by Spearman correlation test
| SpearmanCorr | corrP | Q | |
|---|---|---|---|
| FGF18 | 0.5209 | 1.067e-70 | 1.9e-66 |
| WT1 | 0.5115 | 7.953e-68 | 1.42e-63 |
| KITLG | -0.4949 | 5.798e-63 | 1.03e-58 |
| RBM38 | 0.4891 | 2.517e-61 | 4.48e-57 |
| ELL2 | -0.4855 | 2.59e-60 | 4.61e-56 |
| RIMS4 | 0.4826 | 1.629e-59 | 2.9e-55 |
| DOK7 | 0.4818 | 2.551e-59 | 4.54e-55 |
| ZNF503 | 0.4817 | 2.85e-59 | 5.07e-55 |
| KLK8 | 0.4805 | 5.754e-59 | 1.02e-54 |
| KLK6 | 0.4795 | 1.078e-58 | 1.92e-54 |
Figure S10. Get High-res Image As an example, this figure shows the association of FGF18 to 'TUMOR.STAGE'. P value = 1.07e-70 with Spearman correlation analysis.
5814 genes related to 'RADIATIONS.RADIATION.REGIMENINDICATION'.
Table S21. Basic characteristics of clinical feature: 'RADIATIONS.RADIATION.REGIMENINDICATION'
| RADIATIONS.RADIATION.REGIMENINDICATION | Labels | N |
| NO | 180 | |
| YES | 1413 | |
| Significant markers | N = 5814 | |
| Higher in YES | 2865 | |
| Higher in NO | 2949 |
Table S22. Get Full Table List of top 10 genes differentially expressed by 'RADIATIONS.RADIATION.REGIMENINDICATION'
| T(pos if higher in 'YES') | ttestP | Q | AUC | |
|---|---|---|---|---|
| CYP3A5 | 22.2 | 4.3e-77 | 7.66e-73 | 0.7877 |
| CYP3A7 | 20.4 | 1.717e-68 | 3.06e-64 | 0.7635 |
| CYP3A4 | 20.24 | 6.476e-68 | 1.15e-63 | 0.7729 |
| TCF21 | 21.02 | 1.431e-65 | 2.55e-61 | 0.7939 |
| MAP2K7 | 21.32 | 8.132e-65 | 1.45e-60 | 0.8098 |
| AADAC | 20.04 | 4.24e-63 | 7.55e-59 | 0.7714 |
| CCDC71 | 21.22 | 1.383e-62 | 2.46e-58 | 0.8195 |
| REG1A | 19.08 | 5.442e-59 | 9.69e-55 | 0.773 |
| CHMP4B | 20.11 | 6.206e-58 | 1.11e-53 | 0.8105 |
| PDZD3 | 17.13 | 1.326e-57 | 2.36e-53 | 0.6836 |
Figure S11. Get High-res Image As an example, this figure shows the association of CYP3A5 to 'RADIATIONS.RADIATION.REGIMENINDICATION'. P value = 4.3e-77 with T-test analysis.
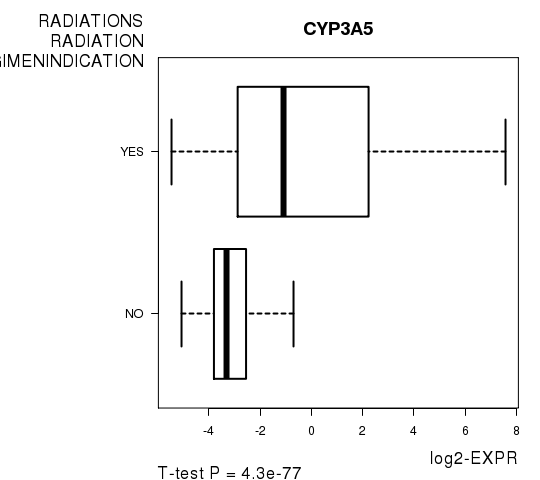
Table S23. Basic characteristics of clinical feature: 'NUMBERPACKYEARSSMOKED'
| NUMBERPACKYEARSSMOKED | Mean (SD) | 53.05 (35) |
| Significant markers | N = 0 |
9 genes related to 'TOBACCOSMOKINGHISTORYINDICATOR'.
Table S24. Basic characteristics of clinical feature: 'TOBACCOSMOKINGHISTORYINDICATOR'
| TOBACCOSMOKINGHISTORYINDICATOR | Labels | N |
| CURRENT REFORMED SMOKER FOR < OR = 15 YEARS | 93 | |
| CURRENT REFORMED SMOKER FOR > 15 YEARS | 49 | |
| CURRENT SMOKER | 31 | |
| LIFELONG NON-SMOKER | 11 | |
| Significant markers | N = 9 |
Table S25. Get Full Table List of 9 genes differentially expressed by 'TOBACCOSMOKINGHISTORYINDICATOR'
| ANOVA_P | Q | |
|---|---|---|
| PSME4 | 6.816e-08 | 0.00121 |
| C1ORF64 | 1.645e-07 | 0.00293 |
| LMNB2 | 1.211e-06 | 0.0216 |
| LONP1 | 1.573e-06 | 0.028 |
| SLC25A1 | 1.62e-06 | 0.0289 |
| IGFBP7 | 1.965e-06 | 0.035 |
| N6AMT2 | 2.361e-06 | 0.0421 |
| CATSPER3 | 2.469e-06 | 0.044 |
| LAS1L | 2.63e-06 | 0.0468 |
Figure S12. Get High-res Image As an example, this figure shows the association of PSME4 to 'TOBACCOSMOKINGHISTORYINDICATOR'. P value = 6.82e-08 with ANOVA analysis.
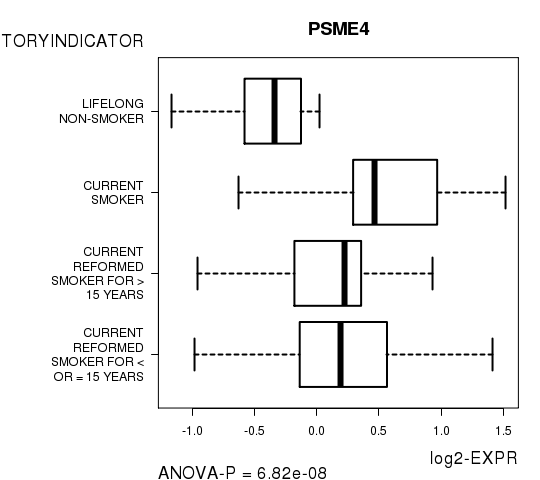
Table S26. Basic characteristics of clinical feature: 'YEAROFTOBACCOSMOKINGONSET'
| YEAROFTOBACCOSMOKINGONSET | Mean (SD) | 1959.74 (11) |
| Significant markers | N = 1 | |
| pos. correlated | 0 | |
| neg. correlated | 1 |
Table S27. Get Full Table List of one gene significantly correlated to 'YEAROFTOBACCOSMOKINGONSET' by Spearman correlation test
| SpearmanCorr | corrP | Q | |
|---|---|---|---|
| MMP10 | -0.4473 | 4.812e-07 | 0.00857 |
Figure S13. Get High-res Image As an example, this figure shows the association of MMP10 to 'YEAROFTOBACCOSMOKINGONSET'. P value = 4.81e-07 with Spearman correlation analysis. The straight line presents the best linear regression.
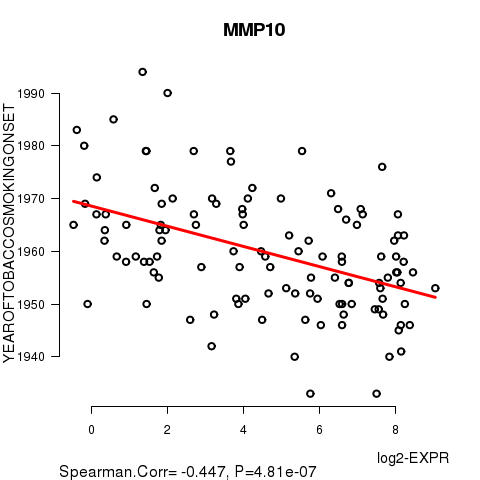
Table S28. Basic characteristics of clinical feature: 'DISTANT.METASTASIS'
| DISTANT.METASTASIS | Labels | N |
| CM0 (I+) | 2 | |
| M0 | 369 | |
| M1 | 8 | |
| MX | 10 | |
| Significant markers | N = 0 |
Table S29. Basic characteristics of clinical feature: 'LYMPH.NODE.METASTASIS'
| LYMPH.NODE.METASTASIS | Labels | N |
| N0 | 118 | |
| N0 (I+) | 7 | |
| N0 (I-) | 59 | |
| N1 | 41 | |
| N1A | 62 | |
| N1B | 14 | |
| N1C | 2 | |
| N1MI | 11 | |
| N2 | 24 | |
| N2A | 24 | |
| N3 | 5 | |
| N3A | 16 | |
| NX | 6 | |
| Significant markers | N = 2 |
Table S30. Get Full Table List of 2 genes differentially expressed by 'LYMPH.NODE.METASTASIS'
| ANOVA_P | Q | |
|---|---|---|
| GUCA2A | 6.031e-12 | 1.07e-07 |
| ASZ1 | 3.589e-08 | 0.000639 |
Figure S14. Get High-res Image As an example, this figure shows the association of GUCA2A to 'LYMPH.NODE.METASTASIS'. P value = 6.03e-12 with ANOVA analysis.
2319 genes related to 'COMPLETENESS.OF.RESECTION'.
Table S31. Basic characteristics of clinical feature: 'COMPLETENESS.OF.RESECTION'
| COMPLETENESS.OF.RESECTION | Labels | N |
| R0 | 403 | |
| R1 | 39 | |
| R2 | 34 | |
| RX | 7 | |
| Significant markers | N = 2319 |
Table S32. Get Full Table List of top 10 genes differentially expressed by 'COMPLETENESS.OF.RESECTION'
| ANOVA_P | Q | |
|---|---|---|
| NPR1 | 2.596e-40 | 4.62e-36 |
| WIT1 | 2.503e-37 | 4.46e-33 |
| DOK5 | 4.72e-35 | 8.41e-31 |
| THRSP | 5.822e-35 | 1.04e-30 |
| KLHL14 | 3.091e-34 | 5.51e-30 |
| WT1 | 1.009e-33 | 1.8e-29 |
| S100A1 | 2.162e-33 | 3.85e-29 |
| LYPD1 | 3.811e-30 | 6.79e-26 |
| MUC16 | 8.048e-29 | 1.43e-24 |
| SCGB1D2 | 1.049e-28 | 1.87e-24 |
Figure S15. Get High-res Image As an example, this figure shows the association of NPR1 to 'COMPLETENESS.OF.RESECTION'. P value = 2.6e-40 with ANOVA analysis.
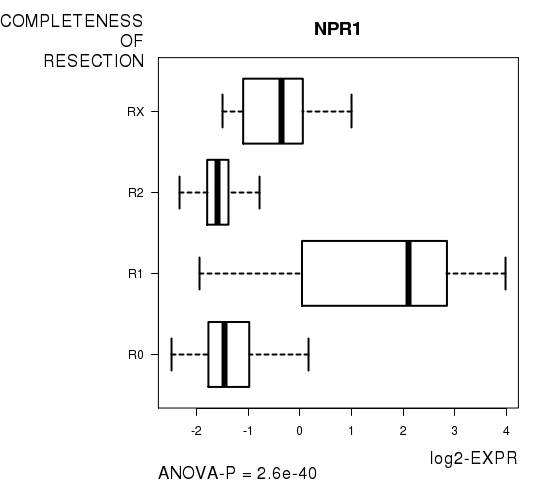
Table S33. Basic characteristics of clinical feature: 'NUMBER.OF.LYMPH.NODES'
| NUMBER.OF.LYMPH.NODES | Mean (SD) | 1.94 (4) |
| Significant markers | N = 0 |
Table S34. Basic characteristics of clinical feature: 'NEOPLASM.DISEASESTAGE'
| NEOPLASM.DISEASESTAGE | Labels | N |
| STAGE I | 41 | |
| STAGE IA | 22 | |
| STAGE IB | 2 | |
| STAGE IIA | 136 | |
| STAGE IIB | 83 | |
| STAGE IIIA | 60 | |
| STAGE IIIB | 12 | |
| STAGE IIIC | 14 | |
| STAGE IV | 8 | |
| STAGE X | 11 | |
| Significant markers | N = 5 |
Table S35. Get Full Table List of 5 genes differentially expressed by 'NEOPLASM.DISEASESTAGE'
| ANOVA_P | Q | |
|---|---|---|
| PGC | 4.234e-14 | 7.54e-10 |
| BMPER | 2.903e-09 | 5.17e-05 |
| LRP4 | 2.449e-08 | 0.000436 |
| GPER | 1.558e-07 | 0.00277 |
| PRSS2 | 5.544e-07 | 0.00987 |
Figure S16. Get High-res Image As an example, this figure shows the association of PGC to 'NEOPLASM.DISEASESTAGE'. P value = 4.23e-14 with ANOVA analysis.
-
Expresson data file = PANCAN12-TP.medianexp.txt
-
Clinical data file = PANCAN12-TP.clin.merged.picked.txt
-
Number of patients = 1593
-
Number of genes = 17814
-
Number of clinical features = 19
For survival clinical features, Wald's test in univariate Cox regression analysis with proportional hazards model (Andersen and Gill 1982) was used to estimate the P values using the 'coxph' function in R. Kaplan-Meier survival curves were plot using the four quartile subgroups of patients based on expression levels
For continuous numerical clinical features, Spearman's rank correlation coefficients (Spearman 1904) and two-tailed P values were estimated using 'cor.test' function in R
For multi-class clinical features (ordinal or nominal), one-way analysis of variance (Howell 2002) was applied to compare the log2-expression levels between different clinical classes using 'anova' function in R
For two-class clinical features, two-tailed Student's t test with unequal variance (Lehmann and Romano 2005) was applied to compare the log2-expression levels between the two clinical classes using 't.test' function in R
For multiple hypothesis correction, Q value is the False Discovery Rate (FDR) analogue of the P value (Benjamini and Hochberg 1995), defined as the minimum FDR at which the test may be called significant. We used the 'Benjamini and Hochberg' method of 'p.adjust' function in R to convert P values into Q values.
This is an experimental feature. The full results of the analysis summarized in this report can be downloaded from the TCGA Data Coordination Center.