This pipeline computes the correlation between significant copy number variation (cnv focal) genes and selected clinical features.
Testing the association between copy number variation 47 arm-level results and 5 clinical features across 154 patients, 2 significant findings detected with Q value < 0.25.
-
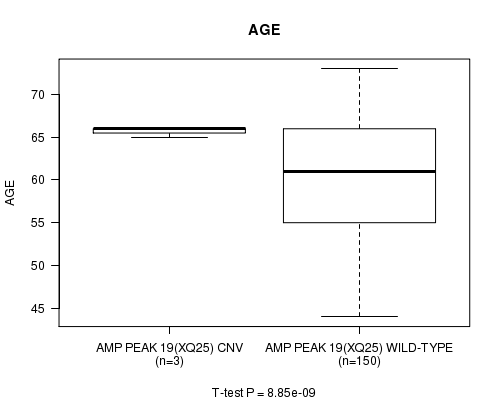
Amp Peak 19(Xq25) cnv correlated to 'AGE'.
-
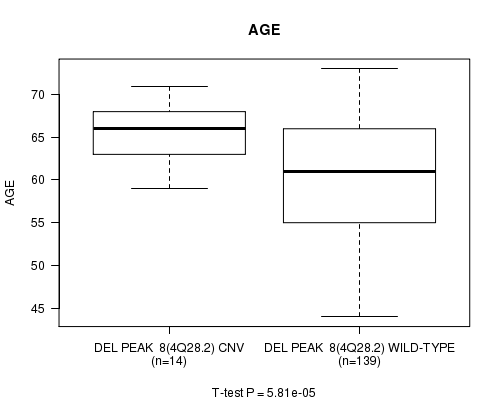
Del Peak 8(4q28.2) cnv correlated to 'AGE'.
Table 1. Get Full Table Overview of the association between significant copy number variation of 47 arm-level results and 5 clinical features. Shown in the table are P values (Q values). Thresholded by Q value < 0.25, 2 significant findings detected.
|
Clinical Features |
Time to Death |
AGE |
RADIATIONS RADIATION REGIMENINDICATION |
COMPLETENESS OF RESECTION |
NUMBER OF LYMPH NODES |
||
| nCNV (%) | nWild-Type | logrank test | t-test | Fisher's exact test | Fisher's exact test | t-test | |
| Amp Peak 19(Xq25) | 0 (0%) | 151 |
1 (1.00) |
8.85e-09 (2.08e-06) |
1 (1.00) |
1 (1.00) |
0.00151 (0.348) |
| Del Peak 8(4q28 2) | 0 (0%) | 140 |
1 (1.00) |
5.81e-05 (0.0136) |
1 (1.00) |
1 (1.00) |
0.138 (1.00) |
| Amp Peak 1(1q21 3) | 0 (0%) | 144 |
1 (1.00) |
0.606 (1.00) |
1 (1.00) |
0.728 (1.00) |
0.521 (1.00) |
| Amp Peak 2(3q26 2) | 0 (0%) | 130 |
1 (1.00) |
0.112 (1.00) |
1 (1.00) |
1 (1.00) |
0.274 (1.00) |
| Amp Peak 3(7p15 3) | 0 (0%) | 123 |
1 (1.00) |
0.413 (1.00) |
0.264 (1.00) |
0.0474 (1.00) |
0.344 (1.00) |
| Amp Peak 4(7q34) | 0 (0%) | 126 |
1 (1.00) |
0.13 (1.00) |
1 (1.00) |
0.342 (1.00) |
0.61 (1.00) |
| Amp Peak 5(8p11 22) | 0 (0%) | 139 |
1 (1.00) |
0.384 (1.00) |
1 (1.00) |
0.44 (1.00) |
0.267 (1.00) |
| Amp Peak 6(8q21 13) | 0 (0%) | 115 |
1 (1.00) |
0.0307 (1.00) |
0.331 (1.00) |
0.83 (1.00) |
0.545 (1.00) |
| Amp Peak 7(11q13 2) | 0 (0%) | 146 |
1 (1.00) |
0.628 (1.00) |
1 (1.00) |
0.154 (1.00) |
0.288 (1.00) |
| Amp Peak 8(12q24 32) | 0 (0%) | 147 |
1 (1.00) |
0.993 (1.00) |
0.21 (1.00) |
0.229 (1.00) |
0.408 (1.00) |
| Amp Peak 9(14q21 1) | 0 (0%) | 146 |
1 (1.00) |
0.00165 (0.374) |
0.0219 (1.00) |
0.291 (1.00) |
0.676 (1.00) |
| Amp Peak 10(20q13 33) | 0 (0%) | 142 |
1 (1.00) |
0.00537 (1.00) |
0.049 (1.00) |
0.0382 (1.00) |
0.00149 (0.348) |
| Amp Peak 11(21q21 3) | 0 (0%) | 149 |
1 (1.00) |
0.0238 (1.00) |
1 (1.00) |
0.611 (1.00) |
0.535 (1.00) |
| Amp Peak 12(Xp22 11) | 0 (0%) | 149 |
1 (1.00) |
0.697 (1.00) |
1 (1.00) |
1 (1.00) |
0.646 (1.00) |
| Amp Peak 13(Xp22 11) | 0 (0%) | 149 |
1 (1.00) |
0.128 (1.00) |
1 (1.00) |
0.604 (1.00) |
0.646 (1.00) |
| Amp Peak 14(Xp21 1) | 0 (0%) | 150 |
1 (1.00) |
0.126 (1.00) |
1 (1.00) |
1 (1.00) |
0.875 (1.00) |
| Amp Peak 15(Xq12) | 0 (0%) | 151 |
1 (1.00) |
0.647 (1.00) |
1 (1.00) |
0.519 (1.00) |
0.00151 (0.348) |
| Amp Peak 16(Xq21 1) | 0 (0%) | 147 |
1 (1.00) |
0.737 (1.00) |
1 (1.00) |
0.405 (1.00) |
0.787 (1.00) |
| Amp Peak 17(Xq21 1) | 0 (0%) | 149 |
1 (1.00) |
0.336 (1.00) |
1 (1.00) |
0.611 (1.00) |
0.352 (1.00) |
| Amp Peak 18(Xq21 31) | 0 (0%) | 149 |
1 (1.00) |
0.237 (1.00) |
1 (1.00) |
0.611 (1.00) |
0.00151 (0.348) |
| Amp Peak 20(Xq25) | 0 (0%) | 148 |
1 (1.00) |
0.72 (1.00) |
1 (1.00) |
0.399 (1.00) |
0.819 (1.00) |
| Amp Peak 21(Xq27 1) | 0 (0%) | 145 |
1 (1.00) |
0.298 (1.00) |
1 (1.00) |
1 (1.00) |
0.0015 (0.348) |
| Del Peak 1(1p31 3) | 0 (0%) | 135 |
1 (1.00) |
0.795 (1.00) |
1 (1.00) |
0.652 (1.00) |
0.816 (1.00) |
| Del Peak 2(1p21 3) | 0 (0%) | 142 |
1 (1.00) |
0.827 (1.00) |
1 (1.00) |
0.501 (1.00) |
0.283 (1.00) |
| Del Peak 3(1q23 1) | 0 (0%) | 147 |
1 (1.00) |
0.614 (1.00) |
1 (1.00) |
1 (1.00) |
0.0015 (0.348) |
| Del Peak 4(1q42 13) | 0 (0%) | 140 |
1 (1.00) |
0.159 (1.00) |
1 (1.00) |
1 (1.00) |
0.71 (1.00) |
| Del Peak 5(2q22 1) | 0 (0%) | 135 |
1 (1.00) |
0.0969 (1.00) |
1 (1.00) |
0.817 (1.00) |
0.567 (1.00) |
| Del Peak 6(3p13) | 0 (0%) | 128 |
1 (1.00) |
0.316 (1.00) |
0.0342 (1.00) |
0.728 (1.00) |
0.741 (1.00) |
| Del Peak 7(3q29) | 0 (0%) | 144 |
1 (1.00) |
0.238 (1.00) |
1 (1.00) |
1 (1.00) |
0.97 (1.00) |
| Del Peak 9(5q11 2) | 0 (0%) | 131 |
1 (1.00) |
0.243 (1.00) |
1 (1.00) |
1 (1.00) |
0.0749 (1.00) |
| Del Peak 10(5q21 1) | 0 (0%) | 128 |
1 (1.00) |
0.0201 (1.00) |
0.59 (1.00) |
0.485 (1.00) |
0.292 (1.00) |
| Del Peak 11(6q15) | 0 (0%) | 104 |
1 (1.00) |
0.0552 (1.00) |
0.175 (1.00) |
0.587 (1.00) |
0.0278 (1.00) |
| Del Peak 12(7q36 1) | 0 (0%) | 147 |
1 (1.00) |
0.336 (1.00) |
1 (1.00) |
1 (1.00) |
0.416 (1.00) |
| Del Peak 13(8p21 3) | 0 (0%) | 62 |
1 (1.00) |
0.277 (1.00) |
1 (1.00) |
0.864 (1.00) |
0.0102 (1.00) |
| Del Peak 14(8p11 21) | 0 (0%) | 103 |
1 (1.00) |
0.148 (1.00) |
0.171 (1.00) |
0.0433 (1.00) |
0.585 (1.00) |
| Del Peak 15(9p22 3) | 0 (0%) | 140 |
1 (1.00) |
0.233 (1.00) |
0.383 (1.00) |
0.774 (1.00) |
0.1 (1.00) |
| Del Peak 16(10q23 31) | 0 (0%) | 97 |
1 (1.00) |
0.944 (1.00) |
0.652 (1.00) |
0.889 (1.00) |
0.332 (1.00) |
| Del Peak 17(11q23 2) | 0 (0%) | 136 |
1 (1.00) |
0.584 (1.00) |
1 (1.00) |
0.805 (1.00) |
0.0728 (1.00) |
| Del Peak 18(12p13 2) | 0 (0%) | 122 |
1 (1.00) |
0.788 (1.00) |
1 (1.00) |
0.719 (1.00) |
0.499 (1.00) |
| Del Peak 19(13q14 13) | 0 (0%) | 84 |
1 (1.00) |
0.0106 (1.00) |
0.178 (1.00) |
0.497 (1.00) |
0.254 (1.00) |
| Del Peak 20(16q24 1) | 0 (0%) | 91 |
1 (1.00) |
0.178 (1.00) |
0.649 (1.00) |
0.51 (1.00) |
0.148 (1.00) |
| Del Peak 21(17p13 1) | 0 (0%) | 115 |
1 (1.00) |
0.424 (1.00) |
1 (1.00) |
0.863 (1.00) |
0.26 (1.00) |
| Del Peak 22(17q21 31) | 0 (0%) | 125 |
1 (1.00) |
0.628 (1.00) |
1 (1.00) |
0.317 (1.00) |
0.36 (1.00) |
| Del Peak 23(18q22 1) | 0 (0%) | 114 |
1 (1.00) |
0.858 (1.00) |
1 (1.00) |
0.773 (1.00) |
0.595 (1.00) |
| Del Peak 24(18q23) | 0 (0%) | 108 |
1 (1.00) |
0.153 (1.00) |
0.635 (1.00) |
0.495 (1.00) |
0.171 (1.00) |
| Del Peak 25(21q22 2) | 0 (0%) | 102 |
1 (1.00) |
0.866 (1.00) |
0.336 (1.00) |
0.504 (1.00) |
0.149 (1.00) |
| Del Peak 26(21q22 3) | 0 (0%) | 104 |
1 (1.00) |
0.698 (1.00) |
0.33 (1.00) |
0.543 (1.00) |
0.115 (1.00) |
P value = 8.85e-09 (t-test), Q value = 2.1e-06
Table S1. Gene #19: 'Amp Peak 19(Xq25)' versus Clinical Feature #2: 'AGE'
| nPatients | Mean (Std.Dev) | |
|---|---|---|
| ALL | 153 | 60.4 (6.9) |
| AMP PEAK 19(XQ25) CNV | 3 | 65.7 (0.6) |
| AMP PEAK 19(XQ25) WILD-TYPE | 150 | 60.3 (6.9) |
Figure S1. Get High-res Image Gene #19: 'Amp Peak 19(Xq25)' versus Clinical Feature #2: 'AGE'
P value = 5.81e-05 (t-test), Q value = 0.014
Table S2. Gene #29: 'Del Peak 8(4q28.2)' versus Clinical Feature #2: 'AGE'
| nPatients | Mean (Std.Dev) | |
|---|---|---|
| ALL | 153 | 60.4 (6.9) |
| DEL PEAK 8(4Q28.2) CNV | 14 | 65.2 (3.5) |
| DEL PEAK 8(4Q28.2) WILD-TYPE | 139 | 59.9 (6.9) |
Figure S2. Get High-res Image Gene #29: 'Del Peak 8(4q28.2)' versus Clinical Feature #2: 'AGE'
-
Mutation data file = all_lesions.conf_99.cnv.cluster.txt
-
Clinical data file = PRAD-TP.clin.merged.picked.txt
-
Number of patients = 154
-
Number of significantly arm-level cnvs = 47
-
Number of selected clinical features = 5
-
Exclude genes that fewer than K tumors have mutations, K = 3
For survival clinical features, the Kaplan-Meier survival curves of tumors with and without gene mutations were plotted and the statistical significance P values were estimated by logrank test (Bland and Altman 2004) using the 'survdiff' function in R
For continuous numerical clinical features, two-tailed Student's t test with unequal variance (Lehmann and Romano 2005) was applied to compare the clinical values between tumors with and without gene mutations using 't.test' function in R
For binary or multi-class clinical features (nominal or ordinal), two-tailed Fisher's exact tests (Fisher 1922) were used to estimate the P values using the 'fisher.test' function in R
For multiple hypothesis correction, Q value is the False Discovery Rate (FDR) analogue of the P value (Benjamini and Hochberg 1995), defined as the minimum FDR at which the test may be called significant. We used the 'Benjamini and Hochberg' method of 'p.adjust' function in R to convert P values into Q values.
This is an experimental feature. The full results of the analysis summarized in this report can be downloaded from the TCGA Data Coordination Center.