This pipeline uses various statistical tests to identify genes whose promoter methylation levels correlated to selected clinical features.
Testing the association between 17313 genes and 4 clinical features across 150 samples, statistically thresholded by Q value < 0.05, 2 clinical features related to at least one genes.
-
89 genes correlated to 'RADIATIONS.RADIATION.REGIMENINDICATION'.
-
NAA20 , ZNF280D , BCAS2 , AASDHPPT , VWDE , ...
-
4 genes correlated to 'COMPLETENESS.OF.RESECTION'.
-
WHAMM , CD36 , TGM4 , ZNF219
-
No genes correlated to 'AGE', and 'NUMBER.OF.LYMPH.NODES'.
Complete statistical result table is provided in Supplement Table 1
Table 1. Get Full Table This table shows the clinical features, statistical methods used, and the number of genes that are significantly associated with each clinical feature at Q value < 0.05.
| Clinical feature | Statistical test | Significant genes | Associated with | Associated with | ||
|---|---|---|---|---|---|---|
| AGE | Spearman correlation test | N=0 | ||||
| RADIATIONS RADIATION REGIMENINDICATION | t test | N=89 | yes | N=56 | no | N=33 |
| COMPLETENESS OF RESECTION | ANOVA test | N=4 | ||||
| NUMBER OF LYMPH NODES | Spearman correlation test | N=0 |
Table S1. Basic characteristics of clinical feature: 'AGE'
| AGE | Mean (SD) | 60.3 (6.8) |
| Significant markers | N = 0 |
89 genes related to 'RADIATIONS.RADIATION.REGIMENINDICATION'.
Table S2. Basic characteristics of clinical feature: 'RADIATIONS.RADIATION.REGIMENINDICATION'
| RADIATIONS.RADIATION.REGIMENINDICATION | Labels | N |
| NO | 5 | |
| YES | 145 | |
| Significant markers | N = 89 | |
| Higher in YES | 56 | |
| Higher in NO | 33 |
Table S3. Get Full Table List of top 10 genes differentially expressed by 'RADIATIONS.RADIATION.REGIMENINDICATION'
| T(pos if higher in 'YES') | ttestP | Q | AUC | |
|---|---|---|---|---|
| NAA20 | 11.13 | 3.896e-17 | 6.74e-13 | 0.8676 |
| ZNF280D | 10.9 | 1.563e-16 | 2.71e-12 | 0.8207 |
| BCAS2 | 8.86 | 7.037e-15 | 1.22e-10 | 0.7683 |
| AASDHPPT | 9.06 | 7.451e-15 | 1.29e-10 | 0.8761 |
| VWDE | 8.42 | 3.465e-14 | 6e-10 | 0.7793 |
| ZKSCAN4 | 11.29 | 4.078e-13 | 7.06e-09 | 0.8814 |
| CLEC4C | -8.18 | 6.031e-13 | 1.04e-08 | 0.7379 |
| KCNA4 | -8.73 | 6.356e-13 | 1.1e-08 | 0.7545 |
| PIK3CA | 8.44 | 7.373e-13 | 1.28e-08 | 0.8292 |
| VCAN | -9.32 | 8.649e-13 | 1.5e-08 | 0.7655 |
Figure S1. Get High-res Image As an example, this figure shows the association of NAA20 to 'RADIATIONS.RADIATION.REGIMENINDICATION'. P value = 3.9e-17 with T-test analysis.
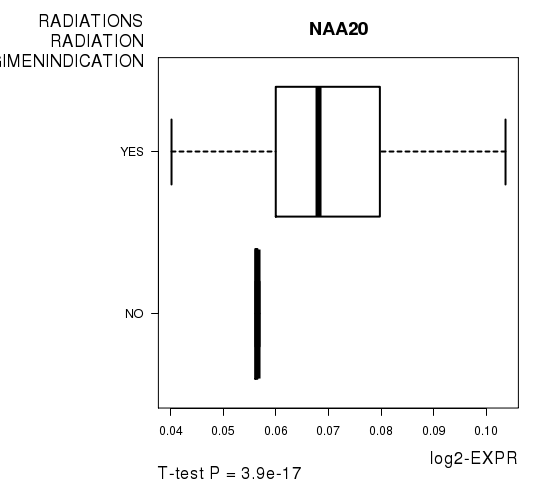
Table S4. Basic characteristics of clinical feature: 'COMPLETENESS.OF.RESECTION'
| COMPLETENESS.OF.RESECTION | Labels | N |
| R0 | 114 | |
| R1 | 29 | |
| RX | 2 | |
| Significant markers | N = 4 |
Table S5. Get Full Table List of 4 genes differentially expressed by 'COMPLETENESS.OF.RESECTION'
| ANOVA_P | Q | |
|---|---|---|
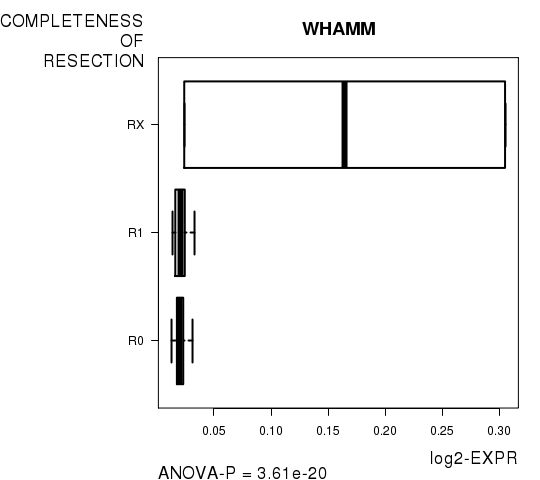
| WHAMM | 3.612e-20 | 6.25e-16 |
| CD36 | 3.046e-08 | 0.000527 |
| TGM4 | 1.666e-07 | 0.00288 |
| ZNF219 | 1.139e-06 | 0.0197 |
Figure S2. Get High-res Image As an example, this figure shows the association of WHAMM to 'COMPLETENESS.OF.RESECTION'. P value = 3.61e-20 with ANOVA analysis.
-
Expresson data file = PRAD-TP.meth.for_correlation.filtered_data.txt
-
Clinical data file = PRAD-TP.clin.merged.picked.txt
-
Number of patients = 150
-
Number of genes = 17313
-
Number of clinical features = 4
For continuous numerical clinical features, Spearman's rank correlation coefficients (Spearman 1904) and two-tailed P values were estimated using 'cor.test' function in R
For two-class clinical features, two-tailed Student's t test with unequal variance (Lehmann and Romano 2005) was applied to compare the log2-expression levels between the two clinical classes using 't.test' function in R
For multi-class clinical features (ordinal or nominal), one-way analysis of variance (Howell 2002) was applied to compare the log2-expression levels between different clinical classes using 'anova' function in R
For multiple hypothesis correction, Q value is the False Discovery Rate (FDR) analogue of the P value (Benjamini and Hochberg 1995), defined as the minimum FDR at which the test may be called significant. We used the 'Benjamini and Hochberg' method of 'p.adjust' function in R to convert P values into Q values.
This is an experimental feature. The full results of the analysis summarized in this report can be downloaded from the TCGA Data Coordination Center.