This pipeline computes the correlation between significantly recurrent gene mutations and selected clinical features.
Testing the association between mutation status of 13 genes and 4 clinical features across 83 patients, 6 significant findings detected with Q value < 0.25.
-
NKX3-1 mutation correlated to 'NUMBER.OF.LYMPH.NODES'.
-
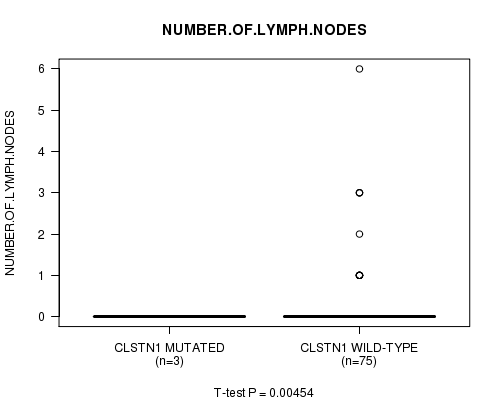
CLSTN1 mutation correlated to 'NUMBER.OF.LYMPH.NODES'.
-
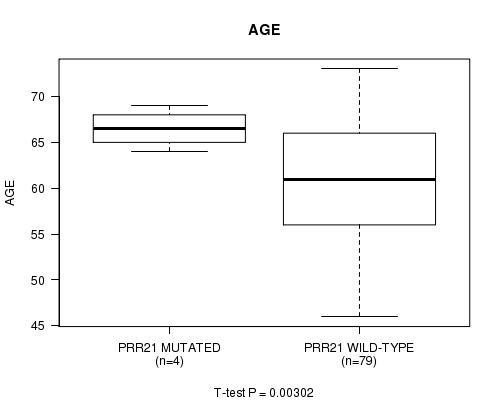
PRR21 mutation correlated to 'AGE'.
-
CTNNB1 mutation correlated to 'NUMBER.OF.LYMPH.NODES'.
-
DUSP27 mutation correlated to 'NUMBER.OF.LYMPH.NODES'.
-
OR4D5 mutation correlated to 'NUMBER.OF.LYMPH.NODES'.
Table 1. Get Full Table Overview of the association between mutation status of 13 genes and 4 clinical features. Shown in the table are P values (Q values). Thresholded by Q value < 0.25, 6 significant findings detected.
|
Clinical Features |
AGE |
RADIATIONS RADIATION REGIMENINDICATION |
COMPLETENESS OF RESECTION |
NUMBER OF LYMPH NODES |
||
| nMutated (%) | nWild-Type | t-test | Fisher's exact test | Fisher's exact test | t-test | |
| NKX3-1 | 5 (6%) | 78 |
0.463 (1.00) |
1 (1.00) |
0.368 (1.00) |
0.00452 (0.23) |
| CLSTN1 | 3 (4%) | 80 |
0.093 (1.00) |
0.0086 (0.396) |
0.177 (1.00) |
0.00454 (0.23) |
| PRR21 | 4 (5%) | 79 |
0.00302 (0.157) |
0.224 (1.00) |
0.588 (1.00) |
0.249 (1.00) |
| CTNNB1 | 3 (4%) | 80 |
0.992 (1.00) |
0.172 (1.00) |
1 (1.00) |
0.00454 (0.23) |
| DUSP27 | 3 (4%) | 80 |
0.824 (1.00) |
1 (1.00) |
1 (1.00) |
0.00454 (0.23) |
| OR4D5 | 3 (4%) | 80 |
0.092 (1.00) |
1 (1.00) |
1 (1.00) |
0.00454 (0.23) |
| TP53 | 5 (6%) | 78 |
0.64 (1.00) |
1 (1.00) |
0.368 (1.00) |
0.822 (1.00) |
| FRG1 | 4 (5%) | 79 |
0.0586 (1.00) |
0.224 (1.00) |
0.285 (1.00) |
0.834 (1.00) |
| SPOP | 4 (5%) | 79 |
0.481 (1.00) |
1 (1.00) |
0.588 (1.00) |
0.464 (1.00) |
| YBX1 | 3 (4%) | 80 |
0.784 (1.00) |
1 (1.00) |
1 (1.00) |
0.547 (1.00) |
| CCNF | 3 (4%) | 80 |
0.643 (1.00) |
0.172 (1.00) |
1 (1.00) |
0.374 (1.00) |
| AGT | 3 (4%) | 80 |
0.6 (1.00) |
1 (1.00) |
1 (1.00) |
0.945 (1.00) |
| OR6N1 | 3 (4%) | 80 |
0.367 (1.00) |
0.172 (1.00) |
0.0145 (0.651) |
0.945 (1.00) |
P value = 0.00452 (t-test), Q value = 0.23
Table S1. Gene #1: 'NKX3-1 MUTATION STATUS' versus Clinical Feature #4: 'NUMBER.OF.LYMPH.NODES'
| nPatients | Mean (Std.Dev) | |
|---|---|---|
| ALL | 78 | 0.3 (0.9) |
| NKX3-1 MUTATED | 5 | 0.0 (0.0) |
| NKX3-1 WILD-TYPE | 73 | 0.3 (1.0) |
Figure S1. Get High-res Image Gene #1: 'NKX3-1 MUTATION STATUS' versus Clinical Feature #4: 'NUMBER.OF.LYMPH.NODES'

P value = 0.00454 (t-test), Q value = 0.23
Table S2. Gene #7: 'CLSTN1 MUTATION STATUS' versus Clinical Feature #4: 'NUMBER.OF.LYMPH.NODES'
| nPatients | Mean (Std.Dev) | |
|---|---|---|
| ALL | 78 | 0.3 (0.9) |
| CLSTN1 MUTATED | 3 | 0.0 (0.0) |
| CLSTN1 WILD-TYPE | 75 | 0.3 (0.9) |
Figure S2. Get High-res Image Gene #7: 'CLSTN1 MUTATION STATUS' versus Clinical Feature #4: 'NUMBER.OF.LYMPH.NODES'
P value = 0.00302 (t-test), Q value = 0.16
Table S3. Gene #8: 'PRR21 MUTATION STATUS' versus Clinical Feature #1: 'AGE'
| nPatients | Mean (Std.Dev) | |
|---|---|---|
| ALL | 83 | 61.1 (6.8) |
| PRR21 MUTATED | 4 | 66.5 (2.1) |
| PRR21 WILD-TYPE | 79 | 60.8 (6.8) |
Figure S3. Get High-res Image Gene #8: 'PRR21 MUTATION STATUS' versus Clinical Feature #1: 'AGE'
P value = 0.00454 (t-test), Q value = 0.23
Table S4. Gene #10: 'CTNNB1 MUTATION STATUS' versus Clinical Feature #4: 'NUMBER.OF.LYMPH.NODES'
| nPatients | Mean (Std.Dev) | |
|---|---|---|
| ALL | 78 | 0.3 (0.9) |
| CTNNB1 MUTATED | 3 | 0.0 (0.0) |
| CTNNB1 WILD-TYPE | 75 | 0.3 (0.9) |
Figure S4. Get High-res Image Gene #10: 'CTNNB1 MUTATION STATUS' versus Clinical Feature #4: 'NUMBER.OF.LYMPH.NODES'

P value = 0.00454 (t-test), Q value = 0.23
Table S5. Gene #11: 'DUSP27 MUTATION STATUS' versus Clinical Feature #4: 'NUMBER.OF.LYMPH.NODES'
| nPatients | Mean (Std.Dev) | |
|---|---|---|
| ALL | 78 | 0.3 (0.9) |
| DUSP27 MUTATED | 3 | 0.0 (0.0) |
| DUSP27 WILD-TYPE | 75 | 0.3 (0.9) |
Figure S5. Get High-res Image Gene #11: 'DUSP27 MUTATION STATUS' versus Clinical Feature #4: 'NUMBER.OF.LYMPH.NODES'

P value = 0.00454 (t-test), Q value = 0.23
Table S6. Gene #12: 'OR4D5 MUTATION STATUS' versus Clinical Feature #4: 'NUMBER.OF.LYMPH.NODES'
| nPatients | Mean (Std.Dev) | |
|---|---|---|
| ALL | 78 | 0.3 (0.9) |
| OR4D5 MUTATED | 3 | 0.0 (0.0) |
| OR4D5 WILD-TYPE | 75 | 0.3 (0.9) |
Figure S6. Get High-res Image Gene #12: 'OR4D5 MUTATION STATUS' versus Clinical Feature #4: 'NUMBER.OF.LYMPH.NODES'

-
Mutation data file = PRAD-TP.mutsig.cluster.txt
-
Clinical data file = PRAD-TP.clin.merged.picked.txt
-
Number of patients = 83
-
Number of significantly mutated genes = 13
-
Number of selected clinical features = 4
-
Exclude genes that fewer than K tumors have mutations, K = 3
For continuous numerical clinical features, two-tailed Student's t test with unequal variance (Lehmann and Romano 2005) was applied to compare the clinical values between tumors with and without gene mutations using 't.test' function in R
For binary or multi-class clinical features (nominal or ordinal), two-tailed Fisher's exact tests (Fisher 1922) were used to estimate the P values using the 'fisher.test' function in R
For multiple hypothesis correction, Q value is the False Discovery Rate (FDR) analogue of the P value (Benjamini and Hochberg 1995), defined as the minimum FDR at which the test may be called significant. We used the 'Benjamini and Hochberg' method of 'p.adjust' function in R to convert P values into Q values.
This is an experimental feature. The full results of the analysis summarized in this report can be downloaded from the TCGA Data Coordination Center.