This pipeline uses various statistical tests to identify mRNAs whose expression levels correlated to selected clinical features.
Testing the association between 18257 genes and 4 clinical features across 153 samples, statistically thresholded by Q value < 0.05, 3 clinical features related to at least one genes.
-
1 gene correlated to 'AGE'.
-
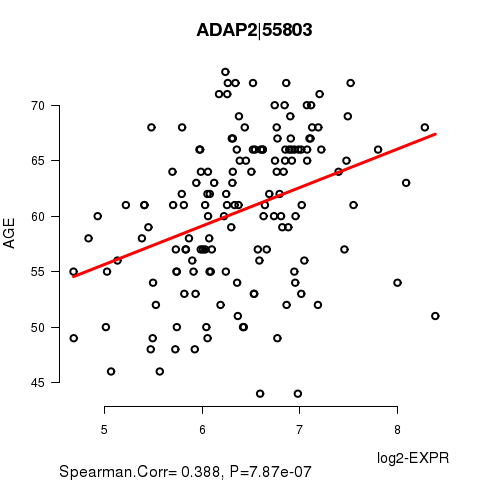
ADAP2|55803
-
30 genes correlated to 'RADIATIONS.RADIATION.REGIMENINDICATION'.
-
C14ORF126|112487 , CEBPZ|10153 , ABHD11|83451 , SFRS2|6427 , MCOLN2|255231 , ...
-
1 gene correlated to 'COMPLETENESS.OF.RESECTION'.
-
GLP2R|9340
-
No genes correlated to 'NUMBER.OF.LYMPH.NODES'
Complete statistical result table is provided in Supplement Table 1
Table 1. Get Full Table This table shows the clinical features, statistical methods used, and the number of genes that are significantly associated with each clinical feature at Q value < 0.05.
| Clinical feature | Statistical test | Significant genes | Associated with | Associated with | ||
|---|---|---|---|---|---|---|
| AGE | Spearman correlation test | N=1 | older | N=1 | younger | N=0 |
| RADIATIONS RADIATION REGIMENINDICATION | t test | N=30 | yes | N=8 | no | N=22 |
| COMPLETENESS OF RESECTION | ANOVA test | N=1 | ||||
| NUMBER OF LYMPH NODES | Spearman correlation test | N=0 |
Table S1. Basic characteristics of clinical feature: 'AGE'
| AGE | Mean (SD) | 60.49 (6.9) |
| Significant markers | N = 1 | |
| pos. correlated | 1 | |
| neg. correlated | 0 |
Table S2. Get Full Table List of one gene significantly correlated to 'AGE' by Spearman correlation test
| SpearmanCorr | corrP | Q | |
|---|---|---|---|
| ADAP2|55803 | 0.388 | 7.87e-07 | 0.0144 |
Figure S1. Get High-res Image As an example, this figure shows the association of ADAP2|55803 to 'AGE'. P value = 7.87e-07 with Spearman correlation analysis. The straight line presents the best linear regression.
30 genes related to 'RADIATIONS.RADIATION.REGIMENINDICATION'.
Table S3. Basic characteristics of clinical feature: 'RADIATIONS.RADIATION.REGIMENINDICATION'
| RADIATIONS.RADIATION.REGIMENINDICATION | Labels | N |
| NO | 5 | |
| YES | 148 | |
| Significant markers | N = 30 | |
| Higher in YES | 8 | |
| Higher in NO | 22 |
Table S4. Get Full Table List of top 10 genes differentially expressed by 'RADIATIONS.RADIATION.REGIMENINDICATION'
| T(pos if higher in 'YES') | ttestP | Q | AUC | |
|---|---|---|---|---|
| C14ORF126|112487 | -10.72 | 3.125e-17 | 5.47e-13 | 0.8527 |
| CEBPZ|10153 | -10.55 | 2.889e-16 | 5.05e-12 | 0.8554 |
| ABHD11|83451 | 12.03 | 4.211e-12 | 7.37e-08 | 0.9108 |
| SFRS2|6427 | -10.08 | 3.636e-11 | 6.36e-07 | 0.8392 |
| MCOLN2|255231 | -7.14 | 1.947e-10 | 3.41e-06 | 0.7054 |
| CDC40|51362 | -9.28 | 3.636e-10 | 6.36e-06 | 0.8514 |
| TMEM161B|153396 | -8.76 | 2.362e-09 | 4.13e-05 | 0.8851 |
| SFRS13A|10772 | -9.78 | 3.218e-09 | 5.63e-05 | 0.873 |
| ABCD1|215 | 8.33 | 3.263e-09 | 5.71e-05 | 0.8122 |
| PPIG|9360 | -7.15 | 4.42e-09 | 7.73e-05 | 0.7095 |
Figure S2. Get High-res Image As an example, this figure shows the association of C14ORF126|112487 to 'RADIATIONS.RADIATION.REGIMENINDICATION'. P value = 3.13e-17 with T-test analysis.
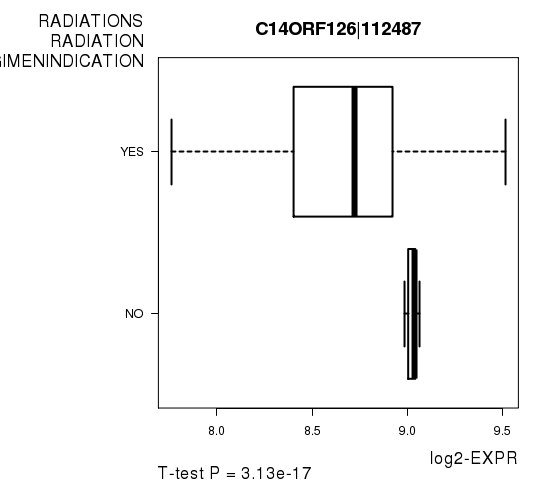
Table S5. Basic characteristics of clinical feature: 'COMPLETENESS.OF.RESECTION'
| COMPLETENESS.OF.RESECTION | Labels | N |
| R0 | 117 | |
| R1 | 29 | |
| RX | 2 | |
| Significant markers | N = 1 |
Table S6. Get Full Table List of one gene differentially expressed by 'COMPLETENESS.OF.RESECTION'
| ANOVA_P | Q | |
|---|---|---|
| GLP2R|9340 | 9.218e-10 | 1.68e-05 |
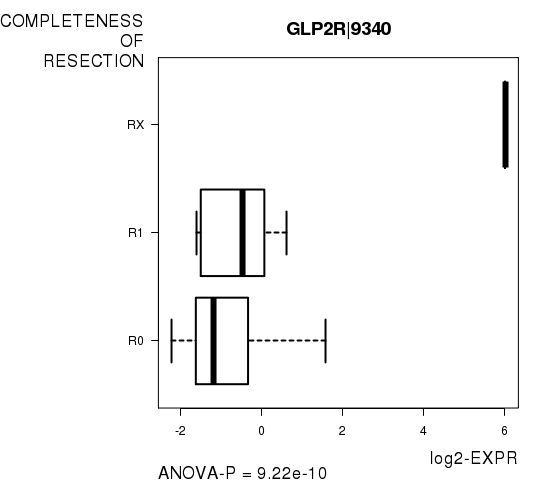
Figure S3. Get High-res Image As an example, this figure shows the association of GLP2R|9340 to 'COMPLETENESS.OF.RESECTION'. P value = 9.22e-10 with ANOVA analysis.
-
Expresson data file = PRAD-TP.uncv2.mRNAseq_RSEM_normalized_log2.txt
-
Clinical data file = PRAD-TP.clin.merged.picked.txt
-
Number of patients = 153
-
Number of genes = 18257
-
Number of clinical features = 4
For continuous numerical clinical features, Spearman's rank correlation coefficients (Spearman 1904) and two-tailed P values were estimated using 'cor.test' function in R
For two-class clinical features, two-tailed Student's t test with unequal variance (Lehmann and Romano 2005) was applied to compare the log2-expression levels between the two clinical classes using 't.test' function in R
For multi-class clinical features (ordinal or nominal), one-way analysis of variance (Howell 2002) was applied to compare the log2-expression levels between different clinical classes using 'anova' function in R
For multiple hypothesis correction, Q value is the False Discovery Rate (FDR) analogue of the P value (Benjamini and Hochberg 1995), defined as the minimum FDR at which the test may be called significant. We used the 'Benjamini and Hochberg' method of 'p.adjust' function in R to convert P values into Q values.
This is an experimental feature. The full results of the analysis summarized in this report can be downloaded from the TCGA Data Coordination Center.