This pipeline uses various statistical tests to identify miRs whose expression levels correlated to selected clinical features.
Testing the association between 475 genes and 4 clinical features across 154 samples, statistically thresholded by Q value < 0.05, 2 clinical features related to at least one genes.
-
3 genes correlated to 'RADIATIONS.RADIATION.REGIMENINDICATION'.
-
HSA-MIR-219-2 , HSA-MIR-449A , HSA-LET-7F-1
-
1 gene correlated to 'NUMBER.OF.LYMPH.NODES'.
-
HSA-MIR-378
-
No genes correlated to 'AGE', and 'COMPLETENESS.OF.RESECTION'.
Complete statistical result table is provided in Supplement Table 1
Table 1. Get Full Table This table shows the clinical features, statistical methods used, and the number of genes that are significantly associated with each clinical feature at Q value < 0.05.
| Clinical feature | Statistical test | Significant genes | Associated with | Associated with | ||
|---|---|---|---|---|---|---|
| AGE | Spearman correlation test | N=0 | ||||
| RADIATIONS RADIATION REGIMENINDICATION | t test | N=3 | yes | N=2 | no | N=1 |
| COMPLETENESS OF RESECTION | ANOVA test | N=0 | ||||
| NUMBER OF LYMPH NODES | Spearman correlation test | N=1 | higher number.of.lymph.nodes | N=0 | lower number.of.lymph.nodes | N=1 |
Table S1. Basic characteristics of clinical feature: 'AGE'
| AGE | Mean (SD) | 60.4 (6.9) |
| Significant markers | N = 0 |
3 genes related to 'RADIATIONS.RADIATION.REGIMENINDICATION'.
Table S2. Basic characteristics of clinical feature: 'RADIATIONS.RADIATION.REGIMENINDICATION'
| RADIATIONS.RADIATION.REGIMENINDICATION | Labels | N |
| NO | 5 | |
| YES | 149 | |
| Significant markers | N = 3 | |
| Higher in YES | 2 | |
| Higher in NO | 1 |
Table S3. Get Full Table List of 3 genes differentially expressed by 'RADIATIONS.RADIATION.REGIMENINDICATION'
| T(pos if higher in 'YES') | ttestP | Q | AUC | |
|---|---|---|---|---|
| HSA-MIR-219-2 | 11.4 | 1.2e-10 | 5.16e-08 | 0.9788 |
| HSA-MIR-449A | 5.76 | 1.993e-05 | 0.00855 | 0.7176 |
| HSA-LET-7F-1 | -6.58 | 8.213e-05 | 0.0351 | 0.8282 |
Figure S1. Get High-res Image As an example, this figure shows the association of HSA-MIR-219-2 to 'RADIATIONS.RADIATION.REGIMENINDICATION'. P value = 1.2e-10 with T-test analysis.
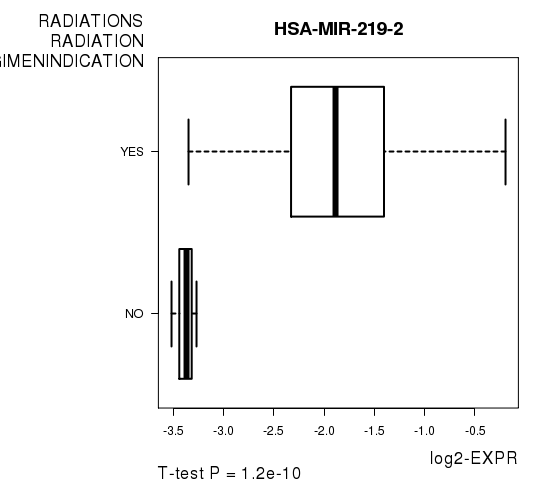
Table S4. Basic characteristics of clinical feature: 'COMPLETENESS.OF.RESECTION'
| COMPLETENESS.OF.RESECTION | Labels | N |
| R0 | 118 | |
| R1 | 29 | |
| RX | 2 | |
| Significant markers | N = 0 |
Table S5. Basic characteristics of clinical feature: 'NUMBER.OF.LYMPH.NODES'
| NUMBER.OF.LYMPH.NODES | Mean (SD) | 0.2 (0.74) |
| Significant markers | N = 1 | |
| pos. correlated | 0 | |
| neg. correlated | 1 |
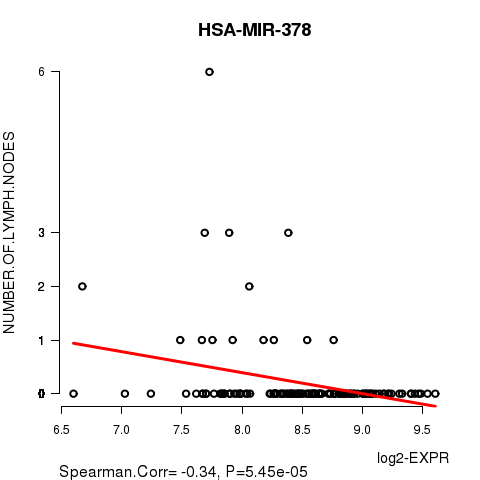
Table S6. Get Full Table List of one gene significantly correlated to 'NUMBER.OF.LYMPH.NODES' by Spearman correlation test
| SpearmanCorr | corrP | Q | |
|---|---|---|---|
| HSA-MIR-378 | -0.3401 | 5.449e-05 | 0.0258 |
Figure S2. Get High-res Image As an example, this figure shows the association of HSA-MIR-378 to 'NUMBER.OF.LYMPH.NODES'. P value = 5.45e-05 with Spearman correlation analysis. The straight line presents the best linear regression.
-
Expresson data file = PRAD-TP.miRseq_RPKM_log2.txt
-
Clinical data file = PRAD-TP.clin.merged.picked.txt
-
Number of patients = 154
-
Number of genes = 475
-
Number of clinical features = 4
For continuous numerical clinical features, Spearman's rank correlation coefficients (Spearman 1904) and two-tailed P values were estimated using 'cor.test' function in R
For two-class clinical features, two-tailed Student's t test with unequal variance (Lehmann and Romano 2005) was applied to compare the log2-expression levels between the two clinical classes using 't.test' function in R
For multi-class clinical features (ordinal or nominal), one-way analysis of variance (Howell 2002) was applied to compare the log2-expression levels between different clinical classes using 'anova' function in R
For multiple hypothesis correction, Q value is the False Discovery Rate (FDR) analogue of the P value (Benjamini and Hochberg 1995), defined as the minimum FDR at which the test may be called significant. We used the 'Benjamini and Hochberg' method of 'p.adjust' function in R to convert P values into Q values.
This is an experimental feature. The full results of the analysis summarized in this report can be downloaded from the TCGA Data Coordination Center.